

Abstract
Background and Aims
Patients with inflammatory bowel disease (IBD) have a higher risk of developing colorectal cancer than the general population. Genome-wide association studies have identified and replicated several loci associated with risk of IBD however it is currently unknown whether these loci are also associated with colon cancer risk.
Methods
We selected 15 validated SNPs associated with risk of either Crohn's disease, ulcerative colitis, or both in previous GWAS and tested whether these loci were also associated with colon cancer risk in a two-stage study design.
Results
We found that rs744166 in STAT3 was associated with colon cancer risk in two studies; however, the direction of the observation was reversed in TP53 mutant tumors possibly due to a nullification of the effect by mutant p53. The SNP, which lies within intron 1 of the STAT3 gene, was not associated with altered expression of either the 6 STAT3 mRNA isoforms or phospho-STAT3.
Conclusions
These data suggest that the STAT3 locus is associated with both IBD and cancer. Understanding the function of this variant, or the identification and function of one in linkage with it, could possibly explain the role of this gene in autoimmunity and cancer. Furthermore, an analysis of this locus, specifically in a population with IBD, could help to resolve the relationship between this SNP and cancer.
Keywords: Inflammatory bowel disease, colon cancer, STAT3
Introduction
Inflammatory bowel disease (IBD), a chronic disorder affecting the intestinal mucosa presents as one of two main forms: Crohn's disease (CD) or ulcerative colitis (UC). UC affects the inner lining of the large intestine, whereas CD is more widespread and extends deeper in to the intestinal wall. Although the exact etiology of these diseases is unknown, genetics, ethnicity, diet, appendectomy, antibiotic use, socioeconomic factors, and non-steroidal anti-inflammatory drugs are considered as risk factors [1]. Decreases in beneficial bacteria and increases in pathogenic bacteria [2-5] have been linked with IBD. Indeed, a key challenge faced by the immune system is maintenance of a balance between commensal and pathogenic microorganisms. It is thought that IBD develops through the loss of such homeostatic controls and a key population of T cells, called Th17 cells, has recently emerged as a player in the context of IBD. The importance of these cells, which express the IL-23 receptor and regulate autoimmunity, is exemplified by recent genome wide association studies (GWAS) that have shown a connection between genetic variation in IL-23 and risk of both CD and UC [6-9].
Although there is no unifying risk factor for both CD and UC, genetic susceptibility appears to be common to the etiology of both conditions [6, 10-15]. Both diseases display strong relative sibling risk [16, 17] and through GWAS, multiple risk loci have been identified and indeed replicated [6, 10-14, 17, 18]. Patients with IBD have a higher risk of developing colorectal cancer than the general population [19-22], an association that was first described by Crohn in 1925 [23]. Risk of colorectal cancer is a direct function of the length of time an individual has had IBD and the extent of intestinal involvement [24]. Colorectal cancer accounts for between 10% and 15% of deaths in patients with IBD [25]. In addition, mortality rates for colorectal cancer patients are higher among IBD-associated colorectal cancer cases, compared to colorectal cancer associated with other risk factors [26, 27]. Collectively, this suggests a directional link between IBD and colorectal cancer. Current trends in molecular pathological epidemiology converge on the theme of defining risk in terms of tumor subtype or tumor-specific exposures [28-30] and accumulating evidence suggests that IBD-associated colorectal cancer has a pathobiology that is distinct from non-IBD colorectal cancer. For example, the mean age of developing CRC in the setting of IBD is lower than for non-IBD CRC (40-50 vs. 60 years); dysplasia in ulcerative colitis (UC) is preceded by a long history of chronic inflammation whereas dysplasia in non-IBD colon cancer is usually associated with a discrete polyp without inflammation; RAS mutations are frequent in sporadic colon cancers but are not as common in IBD-associated colorectal cancer [31]; and loss of heterozygosity and mutations in TP53 are more common in IBD-associated colon cancer than non-IBD colorectal cancer [32, 33].
There is currently no clear way of identifying which patients with IBD will develop colorectal cancer [34], something which has substantially impacted and overburdened the clinical management of IBD. In this study we reasoned that, if some forms of colorectal cancer shared a common pathobiology with IBD, then loci associated with susceptibility to IBD might also be associated with risk of colorectal cancer. To test this hypothesis, we analyzed SNPs previously identified from GWAS of IBD and asked whether these loci are also associated with risk of colorectal cancer.
Materials and Methods
Study Populations
The NCI-University of Maryland Colorectal Cancer Case-Control Study
This study population consisted of 691 subjects. Incident colorectal cancer cases (n=245) and controls (n=446) were recruited from 1992-2003 and 1998-2003, respectively from the greater Baltimore, Maryland area. The controls were accrued from both a hospital setting (n=236) and a community setting (n=210). The inclusion and exclusion criteria have been previously described [35]. In brief, subjects were self-reported European American or African Americans born in the United States. Subjects were excluded if they self-reported a history of cancer other than colon, HIV, HBV, HCV, or IV drug use, were institutionalized, or had a mental impairment. Information to determine disease stage, treatment, and survival was obtained from medical records and pathology reports, Social Security Death Index, and the National Death Index. Disease staging was completed according to the tumor-node-metastasis system of the American Joint Committee on Cancer. The survival period was determined from date of hospital admission for surgery to date of last completed search for death entries in the Social Security Death Index (2010). Informed consent was obtained from all participants, and epidemiological questionnaires including personal history, family medical history, past medical history, tobacco history, dietary information, and information on work environment, were administered to all subjects. The study was approved by the institutional review boards of the participating institutions. The characteristics of this study population are described in Table 1.
Table 1. Characteristics of the study populations.
| Characteristics | NCI-MD Study | DALS Study | ||||
|---|---|---|---|---|---|---|
|
|
|
|||||
| Cases | Total Controls | Population Controls | Hospital Controls | Cases | Controls | |
| n | 245 | 446 | 236 | 210 | 1578 | 1980 |
| Age ± SD | 64.7 ± 11.7 | 65.0 ± 11.0 | 66.8 ± 9.7 | 63.1 ± 12.1 | 64.9 ± 9.8 | 65.0 ± 10.1 |
| Gender (%) | ||||||
| Male | 185 (75) | 212 (48) | 115 (48) | 97 (46) | 884 (56) | 1060 (54) |
| Female | 60 (25) | 234 (52) | 121 (51) | 113 (54) | 694 (44) | 920 (46) |
| Race (%) | ||||||
| African American* or Hispanic | 97 (40) | 190 (43) | 121 (51) | 69 (33) | 132 (8) | 130 (7) |
| European American | 148 (60) | 256 (57) | 115 (49) | 141 (67) | 1446 (92) | 1850 (93) |
| Stage (%) | ||||||
| Unknown | 4 (2) | 186 (12) | ||||
| I | 38 (16) | 475 (30) | ||||
| II | 69 (29) | 408 (26) | ||||
| III | 79 (33) | 380 (24) | ||||
| IV | 51 (21) | 129 (8) | ||||
| Survival | ||||||
| Overall (median months, IQR) | 56 (19 - 86) | 62 (42, 86) | ||||
| Colon Cancer Deaths | 19 (9 - 40) | 25 (16, 41) | ||||
| All Deaths | 19 (9 - 40) | 32 (20, 52) | ||||
| Alive (includes lost to follow-up) | 74 (52 - 104) | 73 (57, 94) | ||||
NCI-MD study did not include Hispanic participants
Diet Activity and Lifestyle Study
Participants from the Diet, Activity and Lifestyle Study were enrolled in a population-based case-control study of incident colon cancer (cases n=1,555) and population-based controls (n=1,956) who were identified between October 1, 1991 and September 30, 1994. It included people living in the Twin Cities Metropolitan Area, Kaiser Permanente Medical Care Program of Northern California (KPMCP) and a seven-county area of Utah. Cases were between 30 and 79 years old at time of diagnosis with adenocarcinoma, English speaking, mentally competent to complete the interview, with no previous history of colorectal cancer (CRC), and no known familial adenomatous polyposis, ulcerative colitis, or Crohn's disease. Controls were matched to cases by sex and by 5-year age groups. At KPMCP, controls were randomly selected from membership lists; in Utah, controls 65 years and older were randomly selected from the Health Care Financing Administration lists and younger controls were randomly selected from drivers' license lists. Controls were selected from drivers' license and state-identification lists in Minnesota. Details of the study have been previously reported [36, 37]. Interview data were collected by trained and certified interviewers using laptop computers. All interviews were audio-taped and reviewed for quality control purposes [38]. The referent period for the study was two years prior to diagnosis for cases and prior to selection for controls. Tumor registry data were obtained to determine disease stage at diagnosis and months of survival after diagnosis. Disease stage was categorized centrally by one pathologist in Utah using the sixth edition of the American Joint Committee on Cancer (AJCC) staging criteria. Local tumor registries also provided information on patient follow-up including vital status, cause of death, and contributing cause of death. The characteristics of this study population are described in Table 1.
SNP Selection and genotyping
The NCI-University of Maryland Colorectal Cancer Case-Control Study
We selected SNPs previously associated with risk of ulcerative colitis and Crohn's disease [6, 11-13] to test for a potential association with risk of colorectal (NCI-MD) and colon (DALS) cancer (Supplementary Table 1). For the NCI-MD study, genomic DNA was isolated from buffy coat or colorectal tissue using the Qiagen FlexiGene DNA Kit or the DNAeasy tissue kit, respectively (Qiagen, Valencia, CA). Cases and controls were genotyped at the Ohio State University Genotyping Core using Taqman assays (Life Technologies, Carlsbad, CA) for each SNP. The case, control, negative controls, and duplicate samples were randomly distributed for order of processing, with 10% duplicates to test both inter- and intra-plate concordance. All parties involved in genotyping were blinded to the case, control, and duplicate status of the samples. Samples that failed to genotype were recorded as undetermined. Both inter- and intra-plate duplicates were > 97% concordant and completion rates for all SNPs, except rs10761659, were > 95% (Supplementary Table 1).
Diet Activity and Lifestyle Study
DNA was extracted from whole blood. Rs744166 (STAT3) and rs10883365 (NKX2-3) were genotyped using TaqMan based assays. Genotyping reagents were purchased as complete assays from Applied Biosystems (Foster City, CA). For each 5 μl PCR reaction contained 20ng of genomic DNA, primers, probes, TaqMan Universal PCR Master Mix (containing AmpErase UNG, AmpliTaq Gold enzyme, dNTPs, and reaction buffer). PCR was carried out under the following conditions: 50°C for 2 minutes to activate UNG, 95°C for 10 min, followed by 40 cycles of 92°C for 15 sec, and 60°C for 1 minute using a 384 well dual block ABI 9700. Fluorescent endpoints of the TaqMan reactions were measured using a 7900HT sequence detection instrument. Control samples representing all three possible genotypes were included at four positions each in every 384-well tray. In addition, internal replicates representing >1% of the sample set were blinded and included.
Statistical Analysis
The NCI-University of Maryland Colorectal Cancer Case-Control Study
Statistical analyses of data from the NCI-MD study were performed using STATA 12.0 (College Station, TX). A P value of less than 0.05 was used as the criterion for statistical significance, and all statistical tests were two-sided. Departures from Hardy-Weinberg equilibrium were determined using a χ2 test. For the NCI-MD study, odds ratios (OR) and their corresponding 95% confidence intervals (CI) were estimated using an unconditional logistic regression model adjusted for age (continuous) and sex (categorical). Hazard ratios (HR) and 95% CI were estimated using a Cox proportional hazards regression model adjusted for age, sex, and stage of disease, as well as death from causes other than colorectal carcinoma. Proportional hazards assumptions were verified by visual inspection of log-log plots and using a non-zero slope test of the Schoenfeld residuals [39] (P=0.052 for African Americans, P=0.627 for European Americans). The method of Kaplan and Meier was used for plotting genotypes and survival. Statistical significance was tested using the Log-rank method. Tests for trend were conducted by calculating P-values for the β coefficient in logistic regression models with genotypes coded as an ordinal variable.
Diet Activity and Lifestyle Study
In the Diet, Activity and Lifestyle Study, statistical analyses were performed using SAS® version 9.2 (SAS Institute, Cary, NC). We report ORs and 95% CIs assessed from multivariable logistic regression models adjusting for age, center, race/ethnicity, and sex. P values for linear trend were assessed by comparing the likelihood ratio of a model with the ordinal genotype variable to the likelihood ratio of a model without the genotype variable using a chi-square test with 1 degree of freedom; p values for interaction were determined using a likelihood-ratio test comparing a full model including an ordinal multiplicative interaction term to a reduced model without an interaction term. Survival-months were calculated based on month and year of diagnosis and month and year of death or date of last contact. Associations between SNPs and colorectal cancer mortality were evaluated using Cox proportional hazards models to obtain multivariable HRRs and 95% confidence intervals. We adjusted for age at diagnosis, study center, race, sex, tumor molecular phenotype, and AJCC stage to estimate HRs.
Tumor Marker Data
We have previously evaluated tumors for CpG Island Methylator Phenotype (CIMP), microsatellite instability (MSI), TP53 mutations, and KRAS mutations [40-43] and were therefore able to evaluate variation in the specified genes in relation to molecularly defined subsets of CRC. Details for methods used to evaluate epigenetic and genetic changes have been described [40-42]. In order to compare specific types of mutations to controls while adjusting for the tumor mutations simultaneously in cases, generalized estimating equations (GEEs) with multinomial outcomes were used to calculate odds ratios, because case subjects could have multiple tumor alterations or mutations [44]. GEEs were implemented in SAS using the GENMOD procedure as described by Kuss and McLerran [45]. Trend p values are based on likelihood ratio tests from multiple logistic regression models comparing cases stratified by tumor marker type to controls.
TCGA Data
The Cancer Genome Atlas (TCGA) is supported by the National Cancer Institute and the National Human Genome Research Institute to chart the molecular landscape of tumor samples for more than 20 types of cancer (https://tcga-data.nci.nih.gov/tcga/). We used level-3 normalized data to infer the effects of single nucleotide polymorphisms on gene expression [46]. We downloaded matched samples by participants' sequence data, which have been processed by the Illumina GA Sequencer RNA-seq version 2 pipeline (Mapsplice alignment algorithm and the RSEM algorithm) to generate expression values for STAT3, NKX2-3, uc001kps.2 (DQ372722) and uc001kpt.2 (C10ORF139). For each sample, six individual files are generated by this pipeline and stored at TCGA FTP site. The files are: 1) non-normalized expression values of genes and 2) of isoforms; 3) normalized expression values of genes and 4) of isoforms; and 5) expression quantifications for exons and 6) junctions. Genotype calls for rs744166 and rs10883365 were extracted from Affymetrix GenomeWide SNP6.0 platform data, which had already been processed using Birdseed, were obtained from TCGA. Protein expression data for phospho-stat3 (tyrosine 05) were extracted from the MD Anderson Reverse Phase Protein Array. Genotype, protein expression and isoform-specific data from samples that did not pass the TCGA quality control (per the TCGA copy number Sample Data Relationship Format file) were removed. Genotype calls were coded as 0, 1, or 2 according to the number of variant alleles and filtered according to a Birdseed confidence threshold of 0.05. Differences in mRNA isoform expression and phospho-stat3 levels were compared across genotypes using the rank-sum test in STATA.
Results
SNPs associated with risk of both IBD and colorectal cancer
Of the 15 SNPs analyzed, three deviated from Hardy-Weinberg equilibrium (Supplementary Table 1). A SNP in NKX2-3, rs10883365, was associated with an increased risk of colorectal cancer; however, after adjustment for age, sex and race, the observation was observed only among individuals carrying the heterozygote genotype (ORAG vs. AA 1.59, 95% C.I. 1.08-2.35; P=0.019; n=714) (Table 2). Although our multivariable analysis of the homozygote genotype was sufficiently powered to detect an association, none was observed. This phenomenon, when a heterozygote has a more extreme phenotype that either of its parents, is called over-dominance and is unusual in genetic association studies [47]. Although African Americans with IBD are not at a greater risk of developing colorectal cancer compared with European Americans [48] differences in risk loci have been found [49, 50]. Our study had both African American and European American participants therefore we conducted a stratified analysis. The association was observed only in the European American population (Supplementary Table 2). We also found a SNP in STAT3, rs744166, that was associated with a lower risk of colorectal cancer (ORGG vs. AA 0.54, 95% C.I. 0.34-0.85; P=0.007; n=713) (Table 2). Again, this observation was found only in European Americans (ORGG vs. AA 0.46, 95% C.I. 0.24-0.81; P=0.007; n=416) (Supplementary Table 2). The NCI-MD study included both hospital and population controls. As hospital controls can introduce bias in genetic association studies, we conducted a sensitivity analysis including only the population controls in the reference group. The relationship between rs744166 and risk remained statistically significant (ORGG vs. AA 0.45, 95% C.I. 0.21-0.95; P=0.036; cases=288, population controls=236), suggesting that our results were not biased by the selection of population and hospital controls. There were no other significant associations found.
Table 2. Risk associations for IBD GWAS loci and colorectal cancer risk in the NCI-MD study.
| Gene (SNP) | Genotype | Controls | Cases | Univariable | Multivariable* | ||
|---|---|---|---|---|---|---|---|
|
|
|
||||||
| Odds Ratio (95% C.I.) | P | Odds Ratio (95% C.I.) | P | ||||
|
KIF21B-CACNA1S rs17419032 |
CC | 285 (65%) | 182 (64%) | Reference | Reference | ||
| CT | 130 (30%) | 88 (31%) | 1.06 (0.76 - 1.47) | 0.728 | 1.03 (0.72 - 1.47) | 0.878 | |
| TT | 22 (5%) | 15 (5%) | 1.07 (0.54 - 2.11) | 0.851 | 0.99 (0.48 - 2.07) | 0.993 | |
|
IL17REL rs5771069 |
GG | 130 (30%) | 87 (31%) | Reference | Reference | ||
| GA | 219 (50%) | 132 (48%) | 0.90 (0.64 - 1.27) | 0.544 | 0.90 (0.61 - 1.29) | 0.553 | |
| AA | 88 (20%) | 58 (21%) | 0.98 (0.64 - 1.51) | 0.944 | 0.93 (0.59 - 1.45) | 0.742 | |
|
IL12B rs6887695 |
GG | 175 (41%) | 100 (37%) | Reference | Reference | ||
| GC | 204 (48%) | 136 (50%) | 1.17 (0.84 - 1.62) | 0.357 | 1.10 (0.78 - 1.55) | 0.580 | |
| CC | 49 (11%) | 34 (13%) | 1.21 (0.74 - 2.01) | 0.448 | 1.15 (0.68 - 1.95) | 0.605 | |
|
PTPN2 rs2542151 |
TT | 291 (68%) | 192 (69%) | Reference | Reference | ||
| TG | 129 (30%) | 84 (30%) | 0.98 (0.71 - 1.37) | 0.938 | 0.97 (0.69 - 1.36) | 0.851 | |
| GG | 10 (2%) | 1 (1%) | 0.15 (0.02 - 1.19) | 0.073 | 0.15 (0.02 - 1.19) | 0.073 | |
|
BSN rs9858542 |
GG | 226 (53%) | 142 (53%) | Reference | Reference | ||
| GA | 166 (39%) | 112 (42%) | 1.07 (0.78 - 1.48) | 0.661 | 1.15 (0.82 - 1.60) | 0.415 | |
| AA | 32 (8%) | 13 (5%) | 0.64 (0.33 - 1.27) | 0.207 | 0.69 (0.34 - 1.39) | 0.298 | |
|
IRGM rs13361189 |
TT | 271 (63%) | 177 (64%) | Reference | Reference | ||
| TC | 126 (29%) | 71 (26%) | 0.86 (0.61 - 1.22) | 0.404 | 0.79 (0.53 - 1.18) | 0.254 | |
| CC | 35 (8%) | 28 (10%) | 1.22 (0.72 - 2.08) | 0.455 | 1.23 (0.66 - 2.31) | 0.516 | |
|
STAT3 rs744166 |
AA | 100 (23%) | 83 (30%) | Reference | Reference | ||
| AG | 192 (44%) | 128 (46%) | 0.80 (0.56 - 1.16) | 0.242 | 0.75 (0.51 - 1.11) | 0.154 | |
| GG | 142 (33%) | 68 (24%) | 0.58 (0.38 - 0.87) | 0.009 | 0.54 (0.34 - 0.85) | 0.007 | |
|
SLC22A23 rs17309827 |
TT | 252 (59%) | 143 (53%) | Reference | Reference | ||
| TG | 149 (35%) | 106 (39%) | 1.25 (0.91 - 1.73) | 0.170 | 1.19 (0.84 - 1.70) | 0.331 | |
| GG | 29 (7%) | 24 (9%) | 1.46 (0.82 - 2.60) | 0.201 | 1.38 (0.73 - 2.59) | 0.319 | |
|
NKX2-3 rs10883365 |
AA | 127 (29%) | 63 (23%) | Reference | Reference | ||
| AG | 194 (44%) | 147 (53%) | 1.53 (1.05 - 2.12) | 0.025 | 1.59 (1.08 - 2.35) | 0.019 | |
| GG | 116 (27%) | 67 (24%) | 1.16 (0.76 - 1.78) | 0.484 | 1.23 (0.79 - 1.93) | 0.354 | |
|
SMURF1/KPNA7 rs7809799 |
AA | 370 (84%) | 246 (86%) | Reference | Reference | ||
| AG | 66 (15%) | 38 (13%) | 0.87 (0.56 - 1.33) | 0.512 | 0.88 (0.56 - 1.39) | 0.590 | |
| GG | 3 (1%) | 1 (1%) | 0.50 (0.05 - 4.85) | 0.552 | 0.51 (0.05 - 5.36) | 0.578 | |
|
IL23R rs11209026 |
GG | 389 (90%) | 251 (90%) | Reference | Reference | ||
| GA | 44 (10%) | 26 (9%) | 0.92 (0.55 - 1.53) | 0.735 | 1.06 (0.62 - 1.83) | 0.824 | |
| AA | 0 0(%) | 1 (1%) | NA | NA | NA | ||
|
Intergenic rs12035082 |
CC | 193 (44%) | 127 (45%) | Reference | Reference | ||
| CT | 155 (36%) | 106 (38%) | 1.04 (0.75 - 1.45) | 0.821 | 0.86 (0.58 - 1.29) | 0.474 | |
| TT | 86 (20%) | 47 (17%) | 0.83 (0.55 - 1.26) | 0.386 | 0.72 (0.43 - 1.20) | 0.211 | |
|
Intergenic rs10761659 |
GG | 111 (26%) | 69 (25%) | Reference | Reference | ||
| GA | 208 (49%) | 131 (18%) | 1.01 (0.69 - 1.47) | 0.945 | 1.03 (0.69 - 1.53) | 0.881 | |
| AA | 109 (25%) | 75 (27%) | 1.10 (0.73 - 1.69) | 0.636 | 1.05 (0.66 - 1.65) | 0.845 | |
|
CCNY rs3936503 |
GG | 164 (38%) | 102 (38%) | Reference | Reference | ||
| GA | 196 (45%) | 131 (49%) | 1.07 (0.77 - 1.50) | 0.671 | 1.09 (0.77 - 1.55) | 0.637 | |
| AA | 74 (17%) | 34 (13%) | 0.74 (0.46 - 1.19) | 0.212 | 0.77 (0.46 - 1.27) | 0.302 | |
|
HERC2 rs916977 |
GG | 191 (44%) | 126 (45%) | Reference | Reference | ||
| GA | 126 (29%) | 80 (29%) | 0.96 (0.67 - 1.38) | 0.835 | 1.02 (0.67 - 1.56) | 0.909 | |
| AA | 120 (27%) | 74 (26%) | 0.93 (0.65 - 1.35) | 0.719 | 1.13 (0.66 - 1.95) | 0.657 | |
Adjusted for age, gender and race
We also examined a SNP in the IL-23 receptor (rs11209026) that has been associated with increased risk of IBD in several studies [6]. We did not find an association between this SNP and risk of colorectal cancer. However, as STAT3 is a mediator of signaling from the IL-23 receptor, we evaluated whether there was an interaction between the two SNPs (STAT3 rs744166 and IL-23 rs11209026): we did not find any evidence to support this (data not shown). We also tested whether rs744166 was associated with colorectal cancer survival in our population. In a model adjusted for age, sex and stage at diagnosis, there was no association between this SNP and outcome (HRGG vs. AA 0.72, 95% C.I. 0.34-1.49; P=0.372; n=162).
Our replication of STAT3 rs744166 in the Diet, Activity and Lifestyle Study (DALS) showed a slightly increased risk associated with the G allele with colon cancer after adjusting for age, race, sex and study center (ORGG vs. AA 1.27, 95% C.I. 1.05-1.54; n=3,558) (Table 3). It is important to notice that the association was in the opposite direction to that observed in the NCI-MD study. We also evaluated rs10883365, but did not observe a statistically significant relationship in the DALS data. Assessment of interaction between age, sex, NSAID use, exogenous estrogen exposure, cigarette smoking, family history of colorectal cancer, and BMI during the referent period with STAT3 rs744166 in the DALS data revealed several statistically marginal associations: Colon cancer risk was most likely to be observed in individuals less than 65 years of age at diagnosis (ORGG vs. AA 1.47, 95% C.I. 1.09-1.99; Ptrend=0.010), in women (ORGG vs. AA 1.46, 95% C.I. 1.10-1.94; Ptrend=0.008), those with recent aspirin or NSAID use (ORAG vs. AA 1.48, 95% C.I. 1.14-1.93; ORGG vs. AA 1.38, 95% C.I. 0.99-1.93; Ptrend=0.025), those with no exogenous exposure (ORGG vs. AA 1.54, 95% C.I. 1.07-2.21; Ptrend=0.020), recent cigarette smokers (ORAG vs. AA 1.44, 95% C.I. 1.02-2.04; ORGG vs. AA 1.61, 95% C.I. 1.02-2.55; Ptrend=0.022), those with no family history of colorectal cancer (ORGG vs. AA 1.28, 95% C.I. 1.04-1.57; Ptrend=0.015), and those with BMI of <25 (ORGG vs. AA 1.57, 95% C.I. 1.14-2.17; Ptrend=0.005) (Supplementary Table 3). Tumors from patients harboring the G allele were also more likely to be located in the proximal colon, than in the distal colon (ORGG vs. AA 1.39, 95% C.I. 1.10-1.77; Ptrend=0.006) (Supplementary Table 3). As observed in the NCI-MD study, there were no associations between rs744166 with colon cancer survival in this population.
Table 3. Risk Associations for rs744166 and rs108883365 and colon cancer in the DALS study.
| DALS Study | |||||
|---|---|---|---|---|---|
|
| |||||
| Gene SNP | Genotype | Controls | Cases | Odds Ratio (95% C.I.) | P* |
|
STAT3 rs744166 |
AA | 677 (34%) | 471 (30%) | Reference | |
| AG | 938 (47%) | 785 (50%) | 1.20 (1.03 - 1.40) | ||
| GG | 365 (18%) | 322 (21%) | 1.27 (1.05 - 1.54) | 0.019 | |
| P Trend | 0.008 | ||||
| AA | 677 (34%) | 471 (30%) | Reference | ||
| AG/GG | 1303 (66%) | 1107 (70%) | 1.22 (1.06 - 1.41) | 0.006 | |
|
NKX2-3 rs10883365 |
AA | 544 (27%) | 451 (28%) | Reference | |
| AG | 971 (49%) | 757 (48%) | 0.95 (0.81 - 1.11) | ||
| GG | 465 (23%) | 370 (23%) | 0.96 (0.79 - 1.15) | 0.789 | |
| PTrend | 0.614 | ||||
| AA | 544 (27%) | 451 (28%) | Reference | ||
| AG/GG | 1436 (73%) | 1127 (72%) | 0.95 (0.82 - 1.10) | 0.496 | |
Adjusted for age, center, race and gender
Association between rs744166 and risk of TP53 mutant colon cancer
Evaluation of tumor molecular phenotype available within the DALS Study included assessment of CpG island methylated phenotype (CIMP), KRAS, TP53, and microsatellite instability (MSI). The association between the G allele of STAT3 rs744166 was restricted to TP53-mutant tumors (ORGG vs. AA 1.35, 95% C.I. 1.06-1.73; Ptrend=0.010) (Table 4). We did not find an association between rs744166 and risk of KRAS-mutated colon cancer (Table 4) and there was no association between NKX2-3 rs10883365 and any of the molecular phenotypes of colorectal cancer evaluated (Table 4).
Table 4. Association between rs10883365 and rs744166 with colon cancer risk stratified by tumor marker in the DALS study.
| Controls | N | CIMP High | KRAS mutation | TP53 mutation | MSI unstable | |||||
|---|---|---|---|---|---|---|---|---|---|---|
| N | OR (95% C.I.) | N | OR (95% C.I.) | N | OR (95% C.I.) | N | OR (95% C.I.) | |||
|
STAT3 (rs744166) |
||||||||||
| AA | 677 | 83 | Reference | 113 | Reference | 151 | Reference | 53 | Reference | |
| AG | 938 | 138 | 1.13 (0.87 - 1.46) | 162 | 0.95 (0.75 - 1.20) | 251 | 1.14 (0.93 - 1.40) | 101 | 1.32 (0.96 - 1.83) | |
| GG | 365 | 55 | 1.08 (0.78 - 1.50) | 79 | 1.14 (0.86 - 1.51) | 118 | 1.35 (1.06 - 1.73) | 35 | 1.09 (0.72 - 1.66) | |
| *P Trend | 0.313 | 0.223 | 0.01 | 0.252 | ||||||
| AA | 677 | 83 | Reference | 113 | Reference | 151 | Reference | 53 | Reference | |
| AG/GG | 1303 | 193 | 1.11 (0.87 - 1.43) | 241 | 1.00 (0.80 - 1.25) | 369 | 1.20 (0.99 - 1.46) | 136 | 1.26 (0.92 - 1.71) | |
|
NKX2-3 (rs10883365) |
||||||||||
| AA | 544 | 72 | Reference | 102 | Reference | 140 | Reference | 51 | Reference | |
| AG | 971 | 143 | 1.11 (0.84 - 1.45) | 165 | 0.90 (0.70 - 1.15) | 246 | 0.99 (0.80 - 1.22) | 86 | 0.96 (0.68 - 1.34) | |
| GG | 465 | 61 | 0.93 (0.67 - 1.29) | 87 | 0.96 (0.72 - 1.27) | 134 | 1.10 (0.86 - 1.40) | 52 | 1.18 (0.81 - 1.72) | |
| *P Trend | 0.701 | 0.822 | 0.466 | 0.436 | ||||||
Adjusted for age, center, race, and sex
CIMP denotes CpG Island Methylator Phenotype
rs744166 does not modulate STAT3 isoform expression in colorectal cancer tissue
STAT3 rs744166 lies within intron 1 of the STAT3 gene. Analysis of the Haploreg database (http://www.broadinstitute.org/mammals/haploreg/haploreg.php) suggested that the SNP lay within a binding site for the transcription factors MAX and MXI-1. We therefore tested whether the SNP resided at an expression Quantitative Trait Locus (eQTL) using TCGA data. Specifically, we downloaded data for rs744166 and all of the six known isoforms of STAT3 from the colorectal cancer database. RPKM values corresponding to normalized expression levels of each STAT3 isoform were compared across samples with known rs744166 genotypes. Of the six variants analyzed, uc010wgh.1 (672 aa), which contains 23 exons, was the most abundantly expressed STAT3 isoform, followed by uc002hzl.1 (770 aa), uc002hzk.1 (722 aa), uc002hzn.1 (770 aa), uc002hzm.1 (769 aa) and uc010cyf.1 (89 aa) (Figure 1A). The last of these was barely detectable. Samples were then categorized based on rs744166 genotype and expression of each isoform was compared across each group. As shown in Figure 1A, there was no statistically significant difference in the expression of any STAT3 isoform across the three genotypes of rs744166. We also extracted data for phosphorylation of tyrosine 705 in STAT3 and compared its relative expression across the three rs744166 genotypes. Again, we did not observe any differences (Figure 1B). These data indicate that the rs744166 locus does not modulate STAT3 transcription or Y705 phosphorylation in colon cancer samples. Several SNPs within intron 1 lie in strong linkage with rs744166. We also tested STAT3 mRNA expression across the 8 other SNPs but did not find any significant associations (Supplementary Figure 1).
Figure 1.
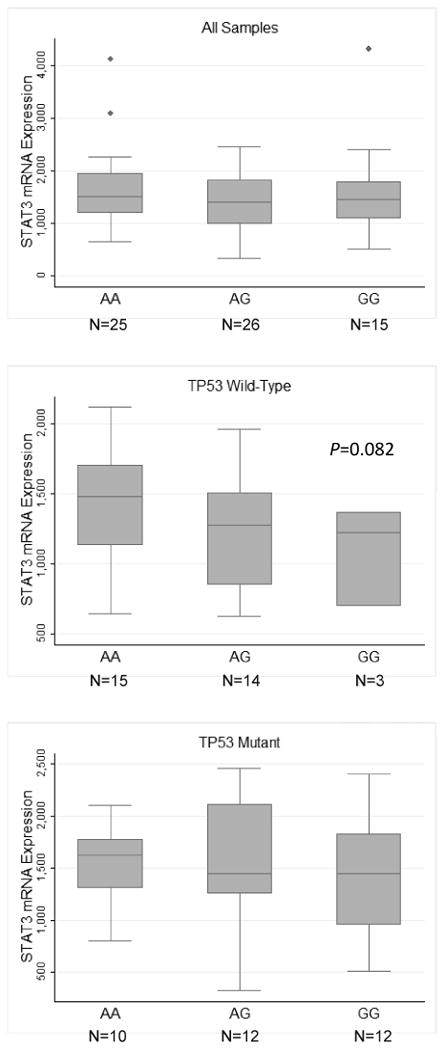
(A) Expression of the six STAT3 mRNA isoforms in colorectal carcinoma and STAT3 mRNA isoform expression stratified by rs744166 genotypes. (B) Phospho-tyrosine705 expression stratified by rs744166 genotype. Data were downloaded from TCGA website. mRNA isoform names refer to the former UCSC system of transcript identification, taken from Illumina RNA-seq version 2 data. SNP data was extracted from the Affymetrix SNP6.0 array. Phospho-stat3 expression was extracted from the MD Anderson Reverse Phase Protein array.
Discussion
We found that that the STAT3 SNP, which was previously associated with risk of IBD in several GWAS studies, was associated with lower risk of colorectal cancer in the NCI-MD study. This association was primarily restricted to a European American population. Our result was consistent with previous IBD GWAS studies, where the G allele of this SNP was also associated with reduced risk of UC and CD [11, 51]. Replication of these findings in a second study also showed a significant association between this SNP and colon cancer risk, however the direction of the association was reversed and restricted to TP53-mutant tumors. We are not sure why we observed the opposite direction of association in this population. One relevant possibility is that, unlike the NCI-MD study, the DALS population excluded individuals with a history of IBD and included only colon cancer cases and not rectal cancer. In addition, the DALS study included only population controls, whereas the NCI-MD study included both hospital and population controls. However, as a sub-group analysis of the SNP that included only the population controls in the NCI-MD study did not change the result, this is also unlikely to have been the cause of difference in direction of the association. However, as we observed that the positive association between the G allele and rs744166 with risk of colon cancer was restricted to TP53-mutated cancers in the DALS study, it is possible that mutant TP53 could reverse, or nullify, the association between this SNP and risk. This hypothesis is supported by a recent report showing that, in cancer cells, high levels of active STAT3 are correlated with mutant TP53 [52] and that loss of heterozygosity for TP53 is an early event IBD-associated colorectal cancer [32, 33]. Unfortunately, data were not available in the NCI-MD study to assess this possibility in that cohort. Notably, rs744166 represents a shared locus for several traits, many of which also demonstrate disparate connections. For example, rs744166-G is a “protective” allele for lung cancer [53], a “risk” allele for multiple sclerosis [18, 54, 55], and a “protective” allele for UC and CD [11, 51]. Jones and Cross tested the hypothesis that rs744166 predisposes to myeloproliferative neoplasms, as the incidence of this disease is reported to be higher in individuals with a prior history of CD [56]; however, they did not find evidence that the locus was involved [57]. These data suggest that the relationship between the STAT3 locus and this diverse range of phenotypes is complex.
rs744166 lies within intron 1 of STAT3. Analysis of the Haploreg database which includes ENCODE data indicated that the SNP was contained within a binding site for the transcription factors MAX and MXI-1. If this was the case, the SNP could potentially affect binding, and therefore, mRNA abundance. Indeed, an analysis of eQTL data from a normal blood-based eQTL database suggested that rs744166 was a eQTL locus for STAT3 mRNA expression (P=2.16E-20) [58]. We used TCGA data to directly address this possibility, and although we had sufficient resolution in our data to look at each of the six STAT3 mRNA isoforms, we did not observe a change in STAT3 expression across the three rs744166 genotypes in colon cancer tissue, nor did we observe a change in the phosphorylation status of Y705. Although it is possible that the SNP affects phosphorylation of serine 727, a marker that was not on the array, the data suggest that either the SNP affects some other aspect of STAT3 function or the SNP affects STAT3 expression in a tissue-specific manner. Either way, further study is needed in this region to decipher to functional interplay of these loci and their relationship to autoimmunity and cancer. Of note, four other SNPs in STAT3 have emerged as associated with phenotypic traits in GWAS; rs2293152 in multiple sclerosis [59] (R2=0.234, D′=0.739) , rs9891119 in CD [60] (R2=0.811, D′=1), rs12942547 in IBD [61] (R2=0.966, D′=1.0), and rs11871801 in CD [12] (R2=0.208, D′=0.653). Other SNPs in linkage with rs744166 (based on R2 ≥0.7 and/or D′=1) are also located within an intronic region of STAT3. We tested 8 of these again using the TCGA data (these were the only ones tagged) but again did not see any associations with mRNA expression.
The rs10883365 locus on chromosome 10 is another commonly associated region with IBD [10-13, 17, 61, 62]. Although we observed an association between this SNP and colorectal cancer in the NCI-MD study, it did not replicate with colon cancer in the DALS study. The SNP is described as residing upstream of the NKX2-3 gene, but it actually lies within a long non-coding RNA (lncRNA) called LINC00200. The TCGA analysis suggests that expression of this RNA could be higher in the presence of the variant allele (Supplementary Figure 2). Although an association with cancer may not be likely, the region may be of relevance to the susceptibility and biology of IBD and, as such, warrants further study.
The management of IBD is a difficult clinical challenge, one that is often compounded by the lack of clear indicators as to which patients with IBD will develop colorectal cancer and which patients will not. Identifying common genetic loci that mediate susceptibility to both IBD and cancer, will not only help in the clinical management of IBD, but it will also facilitate a greater understanding of the mechanisms of carcinogenesis in these patients. Genome-wide association studies have now identified approximately 99 susceptibility loci/genes relating to IBD. The work described here represents a step towards resolving which of these loci are also involved in cancer progression. The next step will be to ask whether these SNPs are associated with risk of colon cancer among a specific IBD population. Although the results of the NCI-MD and DALS studies differed in regard to rs744166, the previous GWAS studies combined with our data indicate that this region is potentially important for autoimmune diseases [11, 12, 14, 53-55, 63-66] and colon and rectal cancer. Larger studies, specifically in IBD populations, will be needed to understand the actual implications in colorectal cancer development in patients both with and without IBD.
Supplementary Material
Highlights.
We examine the relationship between susceptibility loci associated with risk of IBD for their association with colorectal cancer
We undertook a two-stage study design using the NCI-MD and DALS studies
A SNP in STAT3, rs744166, is associated with risk of colon cancer
The relationship between the SNP and risk may be modulated by TP53 mutation status
The SNP may be associated with STAT3 expression, only in TP53 wild-type tumors
Acknowledgments
We gratefully acknowledge contributions from the TCGA Research Network. BMR and CCH were involved in the conception and design of the study; BMR, RKW, NV, MK, AP, EDB, AL, BC, JP, CC and MLS were involved in the acquisition of the data; BMR, DR, DB AL, MLS and RKW were involved in the analysis of the data, BMR, CCH and MLS were involved in the interpretation of the data; BMR drafted the manuscript, BMR, RKW, NV, MK, DR, DB, AP, EDB, AL, BC, JP, CC MLS, and CCH revised the manuscript; BMR, RKW, NV, MK, DR, DB, AP, EDB, AL, BC, JP, CC MLS, and CCH gave final approval of manuscript submission.
This work was funded by the intramural research program of the National Cancer Institute (NCI) and R01-CA48998 (NCI).
Footnotes
Publisher's Disclaimer: This is a PDF file of an unedited manuscript that has been accepted for publication. As a service to our customers we are providing this early version of the manuscript. The manuscript will undergo copyediting, typesetting, and review of the resulting proof before it is published in its final citable form. Please note that during the production process errors may be discovered which could affect the content, and all legal disclaimers that apply to the journal pertain.
References
- 1.Ng SC, Bernstein CN, Vatn MH, Lakatos PL, Loftus EV, Jr, Tysk C, et al. Geographical variability and environmental risk factors in inflammatory bowel disease. Gut. 2013;62:630–49. doi: 10.1136/gutjnl-2012-303661. [DOI] [PubMed] [Google Scholar]
- 2.Sartor RB. Microbial influences in inflammatory bowel diseases. Gastroenterology. 2008;134:577–94. doi: 10.1053/j.gastro.2007.11.059. [DOI] [PubMed] [Google Scholar]
- 3.Boudeau J, Glasser AL, Masseret E, Joly B, Darfeuille-Michaud A. Invasive ability of an Escherichia coli strain isolated from the ileal mucosa of a patient with Crohn's disease. Infection and immunity. 1999;67:4499–509. doi: 10.1128/iai.67.9.4499-4509.1999. [DOI] [PMC free article] [PubMed] [Google Scholar]
- 4.Darfeuille-Michaud A, Neut C, Barnich N, Lederman E, Di Martino P, Desreumaux P, et al. Presence of adherent Escherichia coli strains in ileal mucosa of patients with Crohn's disease. Gastroenterology. 1998;115:1405–13. doi: 10.1016/s0016-5085(98)70019-8. [DOI] [PubMed] [Google Scholar]
- 5.Sepehri S, Kotlowski R, Bernstein CN, Krause DO. Phylogenetic analysis of inflammatory bowel disease associated Escherichia coli and the fimH virulence determinant. Inflammatory bowel diseases. 2009;15:1737–45. doi: 10.1002/ibd.20966. [DOI] [PubMed] [Google Scholar]
- 6.Duerr RH, Taylor KD, Brant SR, Rioux JD, Silverberg MS, Daly MJ, et al. A genome-wide association study identifies IL23R as an inflammatory bowel disease gene. Science. 2006;314:1461–3. doi: 10.1126/science.1135245. [DOI] [PMC free article] [PubMed] [Google Scholar]
- 7.Kugathasan S, Baldassano RN, Bradfield JP, Sleiman PM, Imielinski M, Guthery SL, et al. Loci on 20q13 and 21q22 are associated with pediatric-onset inflammatory bowel disease. Nature genetics. 2008;40:1211–5. doi: 10.1038/ng.203. [DOI] [PMC free article] [PubMed] [Google Scholar]
- 8.Libioulle C, Louis E, Hansoul S, Sandor C, Farnir F, Franchimont D, et al. Novel Crohn disease locus identified by genome-wide association maps to a gene desert on 5p13.1 and modulates expression of PTGER4. PLoS genetics. 2007;3:e58. doi: 10.1371/journal.pgen.0030058. [DOI] [PMC free article] [PubMed] [Google Scholar]
- 9.Beaudoin M, Goyette P, Boucher G, Lo KS, Rivas MA, Stevens C, et al. Deep resequencing of GWAS loci identifies rare variants in CARD9, IL23R and RNF186 that are associated with ulcerative colitis. PLoS genetics. 2013;9:e1003723. doi: 10.1371/journal.pgen.1003723. [DOI] [PMC free article] [PubMed] [Google Scholar]
- 10.Consortium UIG, Barrett JC, Lee JC, Lees CW, Prescott NJ, Anderson CA, et al. Genome-wide association study of ulcerative colitis identifies three new susceptibility loci, including the HNF4A region. Nature genetics. 2009;41:1330–4. doi: 10.1038/ng.483. [DOI] [PMC free article] [PubMed] [Google Scholar]
- 11.Franke A, Balschun T, Karlsen TH, Hedderich J, May S, Lu T, et al. Replication of signals from recent studies of Crohn's disease identifies previously unknown disease loci for ulcerative colitis. Nature genetics. 2008;40:713–5. doi: 10.1038/ng.148. [DOI] [PubMed] [Google Scholar]
- 12.Franke A, Balschun T, Sina C, Ellinghaus D, Hasler R, Mayr G, et al. Genome-wide association study for ulcerative colitis identifies risk loci at 7q22 and 22q13 (IL17REL) Nature genetics. 2010;42:292–4. doi: 10.1038/ng.553. [DOI] [PubMed] [Google Scholar]
- 13.Parkes M, Barrett JC, Prescott NJ, Tremelling M, Anderson CA, Fisher SA, et al. Sequence variants in the autophagy gene IRGM and multiple other replicating loci contribute to Crohn's disease susceptibility. Nature genetics. 2007;39:830–2. doi: 10.1038/ng2061. [DOI] [PMC free article] [PubMed] [Google Scholar]
- 14.Rioux JD, Xavier RJ, Taylor KD, Silverberg MS, Goyette P, Huett A, et al. Genome-wide association study identifies new susceptibility loci for Crohn disease and implicates autophagy in disease pathogenesis. Nature genetics. 2007;39:596–604. doi: 10.1038/ng2032. [DOI] [PMC free article] [PubMed] [Google Scholar]
- 15.Brant SR. Promises, delivery, and challenges of inflammatory bowel disease risk gene discovery. Clinical gastroenterology and hepatology : the official clinical practice journal of the American Gastroenterological Association. 2013;11:22–6. doi: 10.1016/j.cgh.2012.11.001. [DOI] [PubMed] [Google Scholar]
- 16.Bengtson MB, Solberg C, Aamodt G, Sauar J, Jahnsen J, Moum B, et al. Familial aggregation in Crohn's disease and ulcerative colitis in a Norwegian population-based cohort followed for ten years. Journal of Crohn's & colitis. 2009;3:92–9. doi: 10.1016/j.crohns.2008.11.002. [DOI] [PubMed] [Google Scholar]
- 17.Wellcome Trust Case Control C. Genome-wide association study of 14,000 cases of seven common diseases and 3,000 shared controls. Nature. 2007;447:661–78. doi: 10.1038/nature05911. [DOI] [PMC free article] [PubMed] [Google Scholar]
- 18.Jakkula E, Leppa V, Sulonen AM, Varilo T, Kallio S, Kemppinen A, et al. Genome-wide association study in a high-risk isolate for multiple sclerosis reveals associated variants in STAT3 gene. American journal of human genetics. 2010;86:285–91. doi: 10.1016/j.ajhg.2010.01.017. [DOI] [PMC free article] [PubMed] [Google Scholar]
- 19.Eaden JA, Abrams KR, Mayberry JF. The risk of colorectal cancer in ulcerative colitis: a meta-analysis. Gut. 2001;48:526–35. doi: 10.1136/gut.48.4.526. [DOI] [PMC free article] [PubMed] [Google Scholar]
- 20.von Roon AC, Reese G, Teare J, Constantinides V, Darzi AW, Tekkis PP. The risk of cancer in patients with Crohn's disease. Dis Colon Rectum. 2007;50:839–55. doi: 10.1007/s10350-006-0848-z. [DOI] [PubMed] [Google Scholar]
- 21.Ekbom A, Helmick C, Zack M, Adami HO. Ulcerative colitis and colorectal cancer. A population-based study. The New England journal of medicine. 1990;323:1228–33. doi: 10.1056/NEJM199011013231802. [DOI] [PubMed] [Google Scholar]
- 22.Ekbom A, Helmick C, Zack M, Adami HO. Increased risk of large-bowel cancer in Crohn's disease with colonic involvement. Lancet. 1990;336:357–9. doi: 10.1016/0140-6736(90)91889-i. [DOI] [PubMed] [Google Scholar]
- 23.Crohn UB, Rosenberg H. The sigmoidoscopic picture of chronic ulcerative colitis (non-specific) Am J Med Sci. 1925;170:220–8. [Google Scholar]
- 24.Beaugerie L, Svrcek M, Seksik P, Bouvier AM, Simon T, Allez M, et al. Risk of colorectal high-grade dysplasia and cancer in a prospective observational cohort of patients with inflammatory bowel disease. Gastroenterology. 2013;145:166–75 e8. doi: 10.1053/j.gastro.2013.03.044. [DOI] [PubMed] [Google Scholar]
- 25.Munkholm P. Review article: the incidence and prevalence of colorectal cancer in inflammatory bowel disease. Alimentary pharmacology & therapeutics. 2003;18:1–5. doi: 10.1046/j.1365-2036.18.s2.2.x. [DOI] [PubMed] [Google Scholar]
- 26.Richards ME, Rickert RR, Nance FC. Crohn's disease-associated carcinoma. A poorly recognized complication of inflammatory bowel disease. Annals of surgery. 1989;209:764–73. doi: 10.1097/00000658-198906000-00014. [DOI] [PMC free article] [PubMed] [Google Scholar]
- 27.Gearhart SL, Nathan H, Pawlik TM, Wick E, Efron J, Shore AD. Outcomes from IBD-associated and non-IBD-associated colorectal cancer: a Surveillance Epidemiology and End Results Medicare study. Diseases of the colon and rectum. 2012;55:270–7. doi: 10.1097/DCR.0b013e318242620f. [DOI] [PubMed] [Google Scholar]
- 28.Ogino S, Lochhead P, Chan AT, Nishihara R, Cho E, Wolpin BM, et al. Molecular pathological epidemiology of epigenetics: emerging integrative science to analyze environment, host, and disease. Modern pathology : an official journal of the United States and Canadian Academy of Pathology, Inc. 2013;26:465–84. doi: 10.1038/modpathol.2012.214. [DOI] [PMC free article] [PubMed] [Google Scholar]
- 29.Ogino S, King EE, Beck AH, Sherman ME, Milner DA, Giovannucci E. Interdisciplinary education to integrate pathology and epidemiology: towards molecular and population-level health science. American journal of epidemiology. 2012;176:659–67. doi: 10.1093/aje/kws226. [DOI] [PMC free article] [PubMed] [Google Scholar]
- 30.Ogino S, Chan AT, Fuchs CS, Giovannucci E. Molecular pathological epidemiology of colorectal neoplasia: an emerging transdisciplinary and interdisciplinary field. Gut. 2011;60:397–411. doi: 10.1136/gut.2010.217182. [DOI] [PMC free article] [PubMed] [Google Scholar]
- 31.Itzkowitz SH. Inflammatory bowel disease and cancer. Gastroenterology clinics of North America. 1997;26:129–39. doi: 10.1016/s0889-8553(05)70287-9. [DOI] [PubMed] [Google Scholar]
- 32.Hussain SP, Hollstein MH, Harris CC. p53 tumor suppressor gene: at the crossroads of molecular carcinogenesis, molecular epidemiology, and human risk assessment. Annals of the New York Academy of Sciences. 2000;919:79–85. doi: 10.1111/j.1749-6632.2000.tb06870.x. [DOI] [PubMed] [Google Scholar]
- 33.Hussain SP, Amstad P, Raja K, Ambs S, Nagashima M, Bennett WP, et al. Increased p53 mutation load in noncancerous colon tissue from ulcerative colitis: a cancer-prone chronic inflammatory disease. Cancer research. 2000;60:3333–7. [PubMed] [Google Scholar]
- 34.Triantafillidis JK, Nasioulas G, Kosmidis PA. Colorectal cancer and inflammatory bowel disease: epidemiology, risk factors, mechanisms of carcinogenesis and prevention strategies. Anticancer research. 2009;29:2727–37. [PubMed] [Google Scholar]
- 35.Goodman JE, Bowman ED, Chanock SJ, Alberg AJ, Harris CC. Arachidonate lipoxygenase (ALOX) and cyclooxygenase (COX) polymorphisms and colon cancer risk. Carcinogenesis. 2004;25:2467–72. doi: 10.1093/carcin/bgh260. [DOI] [PubMed] [Google Scholar]
- 36.Edwards S, Slattery ML, Mori M, Berry TD, Caan BJ, Palmer P, et al. Objective system for interviewer performance evaluation for use in epidemiologic studies. American journal of epidemiology. 1994;140:1020–8. doi: 10.1093/oxfordjournals.aje.a117192. [DOI] [PubMed] [Google Scholar]
- 37.Slattery ML, Caan BJ, Duncan D, Berry TD, Coates A, Kerber R. A computerized diet history questionnaire for epidemiologic studies. Journal of the American Dietetic Association. 1994;94:761–6. doi: 10.1016/0002-8223(94)91944-5. [DOI] [PubMed] [Google Scholar]
- 38.Liu K, Slattery M, Jacobs D, Jr, Cutter G, McDonald A, Van Horn L, et al. A study of the reliability and comparative validity of the cardia dietary history. Ethnicity & disease. 1994;4:15–27. [PubMed] [Google Scholar]
- 39.Hess KR. Graphical methods for assessing violations of the proportional hazards assumption in Cox regression. Stat Med. 1995;14:1707–23. doi: 10.1002/sim.4780141510. [DOI] [PubMed] [Google Scholar]
- 40.Samowitz WS, Curtin K, Ma KN, Edwards S, Schaffer D, Leppert MF, et al. Prognostic significance of p53 mutations in colon cancer at the population level. International journal of cancer Journal international du cancer. 2002;99:597–602. doi: 10.1002/ijc.10405. [DOI] [PubMed] [Google Scholar]
- 41.Samowitz WS, Curtin K, Schaffer D, Robertson M, Leppert M, Slattery ML. Relationship of Ki-ras mutations in colon cancers to tumor location, stage, and survival: a population-based study. Cancer epidemiology, biomarkers & prevention : a publication of the American Association for Cancer Research, cosponsored by the American Society of Preventive Oncology. 2000;9:1193–7. [PubMed] [Google Scholar]
- 42.Slattery ML, Curtin K, Anderson K, Ma KN, Ballard L, Edwards S, et al. Associations between cigarette smoking, lifestyle factors, and microsatellite instability in colon tumors. Journal of the National Cancer Institute. 2000;92:1831–6. doi: 10.1093/jnci/92.22.1831. [DOI] [PubMed] [Google Scholar]
- 43.Slattery ML, Curtin K, Sweeney C, Levin TR, Potter J, Wolff RK, et al. Diet and lifestyle factor associations with CpG island methylator phenotype and BRAF mutations in colon cancer. International journal of cancer Journal international du cancer. 2007;120:656–63. doi: 10.1002/ijc.22342. [DOI] [PubMed] [Google Scholar]
- 44.Burton P, Gurrin L, Sly P. Extending the simple linear regression model to account for correlated responses: an introduction to generalized estimating equations and multi-level mixed modelling. Statistics in medicine. 1998;17:1261–91. doi: 10.1002/(sici)1097-0258(19980615)17:11<1261::aid-sim846>3.0.co;2-z. [DOI] [PubMed] [Google Scholar]
- 45.Kuss O, McLerran D. A note on the estimation of the multinomial logistic model with correlated responses in SAS. Computer methods and programs in biomedicine. 2007;87:262–9. doi: 10.1016/j.cmpb.2007.06.002. [DOI] [PubMed] [Google Scholar]
- 46.Cancer Genome Atlas N. Comprehensive molecular characterization of human colon and rectal cancer. Nature. 2012;487:330–7. doi: 10.1038/nature11252. [DOI] [PMC free article] [PubMed] [Google Scholar]
- 47.Parsons PA, Bodmer WF. The evolution of overdominance: natural selection and heterozygote advantage. Nature. 1961;190:7–12. doi: 10.1038/190007a0. [DOI] [PubMed] [Google Scholar]
- 48.Hou JK, Kramer JR, Richardson P, Mei M, El-Serag HB. Risk of colorectal cancer among Caucasian and African American veterans with ulcerative colitis. Inflammatory bowel diseases. 2012;18:1011–7. doi: 10.1002/ibd.21840. [DOI] [PMC free article] [PubMed] [Google Scholar]
- 49.Wang MH, Okazaki T, Kugathasan S, Cho JH, Isaacs KL, Lewis JD, et al. Contribution of higher risk genes and European admixture to Crohn's disease in African Americans. Inflammatory bowel diseases. 2012;18:2277–87. doi: 10.1002/ibd.22931. [DOI] [PMC free article] [PubMed] [Google Scholar]
- 50.Moore L, Gaffney K, Lopez R, Shen B. Comparison of the natural history of ulcerative colitis in African Americans and non-Hispanic Caucasians: a historical cohort study. Inflammatory bowel diseases. 2012;18:743–9. doi: 10.1002/ibd.21796. [DOI] [PubMed] [Google Scholar]
- 51.Barrett JC, Hansoul S, Nicolae DL, Cho JH, Duerr RH, Rioux JD, et al. Genome-wide association defines more than 30 distinct susceptibility loci for Crohn's disease. Nature genetics. 2008;40:955–62. doi: 10.1038/NG.175. [DOI] [PMC free article] [PubMed] [Google Scholar]
- 52.Lin J, Jin X, Rothman K, Lin HJ, Tang H, Burke W. Modulation of signal transducer and activator of transcription 3 activities by p53 tumor suppressor in breast cancer cells. Cancer research. 2002;62:376–80. [PubMed] [Google Scholar]
- 53.Jiang B, Zhu ZZ, Liu F, Yang LJ, Zhang WY, Yuan HH, et al. STAT3 gene polymorphisms and susceptibility to non-small cell lung cancer. Genetics and molecular research : GMR. 2011;10:1856–65. doi: 10.4238/vol10-3gmr1071. [DOI] [PubMed] [Google Scholar]
- 54.Cenit MC, Alcina A, Marquez A, Mendoza JL, Diaz-Rubio M, de las Heras V, et al. STAT3 locus in inflammatory bowel disease and multiple sclerosis susceptibility. Genes and immunity. 2010;11:264–8. doi: 10.1038/gene.2010.10. [DOI] [PubMed] [Google Scholar]
- 55.Lill CM, Schjeide BM, Akkad DA, Blaschke P, Winkelmann A, Gerdes LA, et al. Independent replication of STAT3 association with multiple sclerosis risk in a large German case-control sample. Neurogenetics. 2012;13:83–6. doi: 10.1007/s10048-011-0305-6. [DOI] [PubMed] [Google Scholar]
- 56.Kristinsson SY, Landgren O, Samuelsson J, Bjorkholm M, Goldin LR. Autoimmunity and the risk of myeloproliferative neoplasms. Haematologica. 2010;95:1216–20. doi: 10.3324/haematol.2009.020412. [DOI] [PMC free article] [PubMed] [Google Scholar]
- 57.Jones AV, Cross NC. No association between myeloproliferative neoplasms and the Crohn's disease-associated STAT3 predisposition SNP rs744166. Haematologica. 2010;95:1226–7. doi: 10.3324/haematol.2010.023390. [DOI] [PMC free article] [PubMed] [Google Scholar]
- 58.Westra HJ, Peters MJ, Esko T, Yaghootkar H, Schurmann C, Kettunen J, et al. Systematic identification of trans eQTLs as putative drivers of known disease associations. Nature genetics. 2013;45:1238–43. doi: 10.1038/ng.2756. [DOI] [PMC free article] [PubMed] [Google Scholar]
- 59.Patsopoulos NA; Bayer Pharma MSGWG; Steering Committees of Studies Evaluating I-b; a CCRA; Consortium AN; GeneMsa et al. Genome-wide meta-analysis identifies novel multiple sclerosis susceptibility loci. Annals of neurology. 2011;70:897–912. doi: 10.1002/ana.22609. [DOI] [PMC free article] [PubMed] [Google Scholar]
- 60.Yamazaki K, Umeno J, Takahashi A, Hirano A, Johnson TA, Kumasaka N, et al. A genome-wide association study identifies 2 susceptibility Loci for Crohn's disease in a Japanese population. Gastroenterology. 2013;144:781–8. doi: 10.1053/j.gastro.2012.12.021. [DOI] [PubMed] [Google Scholar]
- 61.Jostins L, Ripke S, Weersma RK, Duerr RH, McGovern DP, Hui KY, et al. Host-microbe interactions have shaped the genetic architecture of inflammatory bowel disease. Nature. 2012;491:119–24. doi: 10.1038/nature11582. [DOI] [PMC free article] [PubMed] [Google Scholar]
- 62.Anderson CA, Massey DC, Barrett JC, Prescott NJ, Tremelling M, Fisher SA, et al. Investigation of Crohn's disease risk loci in ulcerative colitis further defines their molecular relationship. Gastroenterology. 2009;136:523–9 e3. doi: 10.1053/j.gastro.2008.10.032. [DOI] [PMC free article] [PubMed] [Google Scholar]
- 63.Cenit MC, Ortego-Centeno N, Raya E, Callejas JL, Garcia-Hernandez FJ, Castillo-Palma MJ, et al. Influence of the STAT3 genetic variants in the susceptibility to psoriatic arthritis and Behcet's disease. Human immunology. 2013;74:230–3. doi: 10.1016/j.humimm.2012.10.019. [DOI] [PubMed] [Google Scholar]
- 64.Danoy P, Pryce K, Hadler J, Bradbury LA, Farrar C, Pointon J, et al. Association of variants at 1q32 and STAT3 with ankylosing spondylitis suggests genetic overlap with Crohn's disease. PLoS genetics. 2010;6:e1001195. doi: 10.1371/journal.pgen.1001195. [DOI] [PMC free article] [PubMed] [Google Scholar]
- 65.Hu K, Hou S, Jiang Z, Kijlstra A, Yang P. JAK2 and STAT3 polymorphisms in a Han Chinese population with Behcet's disease. Investigative ophthalmology & visual science. 2012;53:538–41. doi: 10.1167/iovs.11-8440. [DOI] [PubMed] [Google Scholar]
- 66.Phillips CM, Goumidi L, Bertrais S, Field MR, Peloso GM, Shen J, et al. Dietary saturated fat modulates the association between STAT3 polymorphisms and abdominal obesity in adults. The Journal of nutrition. 2009;139:2011–7. doi: 10.3945/jn.109.110635. [DOI] [PubMed] [Google Scholar]
Associated Data
This section collects any data citations, data availability statements, or supplementary materials included in this article.