

Abstract
Objective
The purpose of this study was to define and select a core set of outcome-based quality indicators, accepted by stakeholders on usability and perceived added value as a quality improvement tool, and to formulate recommendations for the next implementation step.
Methods
In phase 1, 15 potential quality indicators were defined for patient-reported outcome measures and associated domains, namely the Numeric Pain Rating Scale (NPRS) for pain intensity, the Patient Specific Functioning Scale (PSFS) for physical activity, the Quebec Back Pain Disability Scale for physical functioning, and the Global Perceived Effect—Dutch Version for perceived effect. Their comparability and discriminatory characteristics were described using cohort data. In phase 2, a core set of quality indicators was selected based on consensus among stakeholders in focus group meetings.
Results
In total, 65,815 completed treatment episodes for patients with nonspecific low back pain were provided by 1009 physical therapists from 219 physical therapist practices. The discriminability between physical therapists of all potential 15 quality indicators was adequate, with intraclass correlation coefficients between 0.08 and 0.30. Stakeholders selected a final core set of 6 quality indicators: 2 process indicators (the routine measurement of NPRS and the PSFS) and 4 outcome indicators (pretreatment and posttreatment change scores for the NPRS, PSFS, Quebec Back Pain Disability Scale, and the minimal clinically important difference of the Global Perceived Effect—Dutch Version).
Conclusion
This study described and selected a core set of outcome-based quality indicators for physical therapy in patients with nonspecific low back pain. The set was accepted by stakeholders for having added value for daily practice in physical therapy primary care and was found useful for quality improvement initiatives. Further studies need to focus on improvement of using the core set of outcome-based quality indicators as a quality monitoring and evaluation instrument.
Impact
Patient-reported outcome–based quality indicators developed from routinely collected clinical data are promising for use in quality improvement in daily practice.
Keywords: Nonspecific Low Back Pain, Physical Therapy, PROMs, Quality Indicators
Introduction
Quality indicators based on health outcomes can be used as an implementation tool to improve quality of care by monitoring and evaluating treatment trajectories with patient-reported outcomes.1–4 Quality indicators are measurable items to monitor health care, referring to structure, processes, or outcomes of care.5 An important requirement is that these outcome-based quality indicators are well developed, described, and have added value in improving quality of care.3,6 Initial development of quality indicators is usually based on a theoretical perspective and consensus between stakeholders, whereas routinely collected clinical data should be included in the ecological validation process.5 Currently no core set of outcome-based quality indicators is developed for patients with nonspecific low back pain (NSLB) in primary care physical therapy based on such a comprehensive process.
In a previous study, we developed a standard set of outcome domains and patient-reported outcome measures (PROMs) for patients with NSLBP in primary care physical therapist practice.7 PROMs are questionnaires or single-item scales to assess patient-reported outcomes in relevant outcome domains, such as pain, physical functioning, or perceived treatment effect.5,8 The standard set with PROMs is the basis for our next step in the development and implementation of outcome-based quality indicators, which preferably can be used for large patient groups and are able to show changes in clinical practice over time.3,7
Various standards for development and selection of quality indicators exist.5,9 To develop quality indicators, firstly the comparability of the outcomes between physical therapists or practices needs to be adequate. When considering patient characteristics that may influence the outcome, but are not under the control of the physical therapist or practice, case-mix adjustment and stratification in subgroups can be used to improve the population comparability.5,9,10 Secondly, in order to drive quality improvement, the quality indicator should be able to discriminate between physical therapists or practices based on the outcome measures.5,9 Finally, quality indicators need to be accepted by stakeholders (ie, physical therapists, patients, and health insurers) based on the perceived added value and usability for quality improvement in daily practice. We used The Netherlands as a case study for the development of outcome-based quality indicators.
For development of outcome-based quality indicators for patients with NSLBP in Dutch physical therapy primary care practices, the aims of this study were:
1. To define potential outcome-based quality indicators based on the previous selected standard set of outcome domains and selected PROMs, and describe their comparability and discriminability.
2. To select a core set from potential outcome-based quality indicators, accepted by stakeholders on usability and perceived added value as quality improvement tools.
Methods
Design
In the current study, we intended to develop quality indicators in consecutive steps, using a mixed methods approach in a sequential explanatory design. In phase 1 (October 2017 to September 2019), we defined potential quality indicators and estimated their comparability and discriminatory characteristics using prospectively collected patient outcomes in a convenience cohort.
In phase 2 (October to December 2019), the outcomes were presented to stakeholders in a qualitative approach to explore the usability by interpreting their comparability, discriminability, and perceived added value, in order to select a core set of quality indicators.
Setting
In total, 1009 Dutch physical therapists working in 219 primary care practices collected outcomes of treatment trajectories of patients with NSLBP. All graduated, licensed Dutch physical therapists that treated patients with NSLBP could participate in the study, and they needed to be able to provide data to 1 of the 3 data registries, as specified below under “Data Collection.” They were recruited using convenience sampling via stakeholder organizations (professional physical therapy associations and health insurers) in Dutch primary physical therapy care and participated voluntarily in the project. All procedures were conducted according to the Declaration of Helsinki. The study protocol was approved by the Medical Ethical Committee of Radboud University Medical Center (registration # 2019–5455). Funding support for this study was provided by Dutch health insurers CZ & the Friesland. The sponsors had no influence on the process or outcomes of the study.
Data Collection
Treatment outcomes were anonymously collected through electronic health records (EHRs). All data were collected via 3 databases: the national data registry of the Association for Quality in Physical Therapy, the national data registry of the Royal Dutch Society for Physical Therapy, and the database of Spot On Medics—which is one of the EHR vendors. Participating physical therapists were instructed to seek informed consent of each included patient to use the data from the EHR for research and quality improvement.
PROMs
A standard set of PROMs and associated outcome domains was previously selected as relevant for clinical practice and as a basis for the development of quality indicators.7 This standard set included the Numeric Pain Rating Scale (NPRS) for measuring pain intensity, the Patient Specific Functional Scale (PSFS) for measuring physical activity, and the Quebec Back Pain Disability Scale (QBPDS) for measuring physical function, which were collected pretreatment and posttreatment to monitor changes in outcomes over time. The Global Perceived Effect—Dutch Version for measuring perceived effect was completed by patients at the end of the treatment episode to evaluate treatment effect. See Supplementary Appendix A for an overview of each measure, measurement protocol, and a comprehensive description of all measures.
Case-Mix Adjustment and Stratification
For each patient, we collected the following characteristics for case-mix adjustment: age, sex, and chronicity (expressed as the duration of the complaints before treatment). The Start Back Tool (SBT) was administered at the beginning of the treatment episode, and used to stratify patients in a low-, medium-, or high-risk profile.11
Inclusion and Exclusion Criteria
Participating physical therapists and practices included their patients aged 18 years or older with NSLBP. For each patient we aimed to collect the PROMs in the standard set as described under “Data Collection.” The patients received usual care from the participating physical therapists according to the Dutch clinical practice guidelines for NSLBP, meaning that we only measured outcomes of the treatment; the physical therapists individually decided which treatment was needed for their patients.12 Each physical therapist or practice had to include more than 5 patients during the data collection period to participate in this study.
We included only patients with a closed treatment episode. An episode was considered as closed when the physical therapist closed the episode in the EHR or if 8 weeks had passed after the last visit. The same patient can have more treatment episodes in a year, which in this study were handled as separate unique episodes.
Phase 1: Defining and Describing the Comparability and Discriminability of the Quality Indicators
Defining Potential Quality Indicators
Potential quality indicators were defined using national and international standards.5,9,10,13 Quality indicators can be quantified and expressed as a percentage using a denominator and a numerator.3 The denominator usually describes the number of persons in the target group for which the quality indicator is applicable. In the numerator, the number of “correct” scores is described, resulting in a percentage of correct scores.3 See Table 1 for an example of a quality indicator for pain intensity measured with the NPRS.
Table 1.
Example of a Quality Indicator Monitoring the Process for Pain Intensity Measured With the Numeric Pain Rating Scale (NPRS)
| Definition | The percentage of patients with low back pain who received physical therapist treatment and who completed the NPRS pretreatment and posttreatment to evaluate pain intensity |
| Rationale | Pain reduction is an important goal after physical therapist treatment. Pain management is measured with the NPRS |
| Numerator | The number of patients who received physical therapist treatment and who completed the NPRS pretreatment and posttreatment |
| Denominator | All patients who received physical therapist treatment |
| Specification | Pain intensity is measured in all patients using an 11-point NPRS, with 0 points being no pain at all and 10 points being unbearable pain |
| Type of indicator | Process |
For each of the 4 PROMs in the standard set, we defined 4 types of quality indicators:
Process indicator: the percentage of patients with low back pain who had physical therapist treatment in which a pretreatment and posttreatment measurement was used. Example 1: in 60% of the patients, pain intensity was measured pretreatment and posttreatment with the NPRS.
Mean end scores: the mean end score (with 95% CI) of patients with low back pain after physical therapy treatment. Example 2: the mean (SD) end score on physical function of patients measured with the QBPDS is 15 (7) points.
Mean change scores: the mean change score (with 95% CI) of patients with low back pain between pretreatment and posttreatment. Example 3: the mean (SD) change score in physical activity of patients measured with the PSFS is 3.2 (2.1) points of improvement.
Minimal clinically important difference (MCID): the percentage (with 95% CI) of patients who experienced an MCID between pretreatment and posttreatment to measure whether improvements in the outcome were clinically relevant. Example 4: 70% (7%) of the patients reported an MCID on pain intensity measured with NPRS after treatment.
Monitoring the change score was not applicable for Global Perceived Effect—Dutch Version and was measured only posttreatment. Hence, in total we defined 15 potential quality indicators. See Supplementary Appendix B for an extensive description of each defined potential quality indicator.
Sample Size
To allow a valid comparison of indicator scores between physical therapists and practices, a rule of thumb in multilevel analysis for general calculation is the 30/30 rule, that is, 30 practices or physical therapists should include a minimum of 30 patients.14,15 We used this rule of thumb as a threshold for estimating case-mix adjusted and stratified scores for each quality indicator. Descriptive statistics were used to determine whether thresholds for completion of PROMs were met for estimating (stratified) indicator scores. Physical therapists or physical therapy practices were excluded from the analysis for a specific quality indicator if they included less than 30 patients with NSLBP.
Comparability
We used linear and logistic multilevel analysis to compare outcomes on an aggregated level, that is, the level of physical therapists and practices. In this study, patients were clustered through their physical therapists or clustered within practices.16 To enhance the comparability of physical therapists or practices, the quality indicators were adjusted and stratified for explanatory variations in patient characteristics that influence the outcome, but are not under the control of the physical therapist or practice10:
1. Age, sex, chronicity, and the baseline score of each PROM were used for adjustment in the multilevel analyses. The analysis aimed to explain the random intercept variance starting with estimating only an intercept and the random variation around the intercept (intercept-only model). Then, explanatory case-mix variables were added to the model (adjusted model), and the influence of the explanatory variables was evaluated by the amount of the random intercept variance that is explained. In this modeling procedure, the outcome of interest is not the regression coefficient of the explanatory variables but the amount of random intercept variance that is explained.16
2. The SBT was used to stratify patients for each quality indicator in low-, medium-, and high-risk profiles.
For each physical therapist or practice in the case-mix adjusted multilevel analysis the mean scores were estimated with a 95% CI. For the analysis, we used PROMs measured at the beginning and end of the treatment.
Discriminative Ability
The intraclass correlation coefficient (ICC) was calculated for each quality indicator to estimate the variation in outcomes between physical therapists or between practices. In this study, the ICC for physical therapists was defined as the variance between physical therapists, divided by the total variance. The total variance is the summation of the variance between physical therapists and the variance within the physical therapists.16 The ICC for physical therapy practices was defined accordingly by dividing the variance between practices by the summation of the variance between and the variance within physical therapy practices. In multilevel analysis, most ICCs are between 0.05 and 0.20, and ICCs greater than 0.10 can be interpreted as adequate, indicating that the quality indicator is able to discriminate outcomes between physical therapist or practices.16,17
The ICC was also used to compare the intercept-only model with the adjusted model with explanatory variables (case-mix). For each final analysis, we stratified outcomes using the SBT, hence resulting in 3 (low-, medium-, or high-risk) multilevel analyses for each potential quality indicator.
Visual Representation of Indicator Scores
To present for each defined quality indicator the collection of mean outcomes of each participant (physical therapist or practice level) in 1 graph, we used caterpillars plots.17,18 Caterpillar plots are regarded as user friendly and very suitable to visually display quality indicators.13,19 We used relative norms by presenting 3 colors: blue (95% CI significantly lower than average), purple (no significant 95% CI difference from average), and green (95% CI significantly higher than average). We used the plots to present the outcomes of the cohort data to participants in phase 2 of the study.
Phase 2: Selecting a Core Set of Quality Indicators
Participating physical therapists were purposefully invited for semistructured interviews in focus groups. We intended to conduct at least 3 focus group meetings within every session for 6 to 10 physical therapists. In addition, we conducted a focus group meeting with Dutch senior physical therapy researchers who were members of the development team of the revised Dutch physical therapy guideline for low back pain.
In these focus group meetings, participants were asked to choose a core set of quality indicators, selected from the 15 defined potential quality indicators. They reflected on the perceived added value of using the presented indicators in daily practice for quality improvement. In addition, the senior researchers were asked to comment on the set of quality indicators from a scientific perspective.
In all focus group meetings, we started with a visual representation of each potential quality indicator, both at the level of the physical therapist and of the practice in comparison with benchmark data. During the focus group meetings, participants compared, interpreted, and discussed the outcomes with their peers. The usability was evaluated by the participants by interpreting the presented comparability and discriminability of all potential indicators. We also asked if the indicators were capable of making valid comparisons between physical therapists and practices. Furthermore, we were interested if the participants accepted the quality indicators as having added value for quality improvement initiatives. Finally, we asked them to select their preferred quality indicators for the core set.
After each focus group meeting, the chairman (A.C.V.) summarized the preferred quality indicators per outcome domain and asked if the group agreed with the final proposed selection. The focus group meeting was ended when the majority of the participants reached consensus about the core set.
Role of the Funding Source
The funders played no role in the design, conduct, or reporting of this study.
Results
Phase 1: Defining and Describing the Comparability and Discriminability of the Quality Indicators
Descriptive Statistics
In Table 2, descriptive statistics of included patients are presented for each SBT profile separately, including the number of physical therapists and practices. In total, 65,815 completed treatment episodes were provided by 1009 physical therapists and 219 physical therapy practices. The patient characteristics per SBT profile in Table 2 show that mean age, chronicity, treatment frequency, and treatment weeks are similar across the profiles, except for the mean treatment frequency of SBT profile I in comparison with profiles II and III. Table 3 presents the provided data for each PROM at physical therapist and practice level for the total population and stratified for each SBT profile. The change scores of the NPRS and PSFS per SBT profile were similar, whereas the change score on the QBPDS fluctuated between 23.2 (SBT I) and 32.7 (SBT III) points. For each measure, treatment episodes with repeated measurements were provided as follows: NPRS 22,740; PSFS 17,540; QBPDS 12,620; and GPE-DV 8171; see Supplementary Figure for an overview. The total number of included episodes (N) differed between the selected PROMs, because not all PROMs were registered in each patient record.
Table 2.
Descriptive Statistics of Included Patients and Number of Participating Physical Therapists and Practices, Stratified per Start Back Tool Profile and for the Total Populationa
| Number of treatment episodes in the dataset |
Total
N = 72,226 |
SBT I
N = 10,807 |
SBT II
N = 5310 |
SBT III
N = 1412 |
| Number of completed treatment episodes | Total N = 65,815 |
SBT I N = 9580 |
SBT II N = 4703 |
SBT III N = 1300 |
| Percentage of female patients | 52.5 | 47.3 | 53.9 | 55.5 |
| Mean (SD) age of patients, y | 51.3 (16.9) | 50.1 (16.3) | 52.9 (16.1) | 54.1 (16.2) |
| Percentage of patients with complaints <3 mo | 78.7b | 83.7 | 88.6 | 72.8 |
| Mean (SD) treatment frequency | 7.0 (7.3) | 5.6 (5.0) | 7.1 (6.5) | 7.6 (7.3) |
| Mean (SD) treatment duration, wk | 9.2 (12.8) | 7.2 (9.8) | 8.3 (10.2) | 8.7 (10.7) |
| Number of physical therapists who provided the data | 1009 | 687 | 579 | 313 |
| Number of physical therapy practices that provided the data | 219 | 179 | 181 | 130 |
a SBT = Start Back Tool.
b Based on 34,460 patients in the dataset due to missing data. The total number of provided patient records, physical therapists, and practices differs between the SBTs and total data, because an SBT was not registered in the data in all provided patient records.
Table 3.
Descriptive Statistics of Mean PROM Scores (Unadjusted) for the Total Population and Stratified per SBT Profilea
| NPRS | PSFS | QBPDS | GPE-DVb | |
|---|---|---|---|---|
| Percentage of female patients | 51.9 | 52.1 | 51.1 | 50.2 |
| Mean (SD) age of patients, y | 51.9 (16.8) | 50.8 (16.7) | 51.5 (16.4) | 51.4 (16.4) |
| Percentage of patients with complaints <3 mo | 79.2 | 78.9 | 79.3 | 80.8 |
| Number of treatment episodes with baseline measures | 44,251 | 46,016 | 26,142 | — |
| Mean (SD) baseline score | 6.3 (1.8) | 6.8 (1.92) | 36.8 (19.1) | — |
| Included patients with end scores | 22,740 | 17,540 | 12,620 | 8171 |
| Mean end score | 3.3 (2.8) | 2.8 (2.4) | 12.6 (15.3) | |
| Mean (SD) change Tend-T0 | 30 (3.1) | 4.2 (2.6) | 26.1 (19.2) | 1.8b |
| MCID of each PROM (reference) | >2 points (46,47) |
>2 points (48) |
>20 points (46,49) |
Score 1 or 2 (50) |
| Percentage patients improvedc | 71.5 | 83.8 | 57.5 | 84.8 |
| Percentage patients stabilizedc | 20 | 14.9 | 41.7 | 15.1 |
| Percentage patients deterioratedc | 8.5 | 1.3 | 0.8 | 0.1 |
| Number of physical therapists that provided data | 935 | 967 | 879 | 543 |
| Number of practices that provided data | 202 | 210 | 202 | 145 |
| Number of treatment episodes profile SBT I | 7177 | 7485 | 6699 | 2448 |
| SBT I: mean (SD) change Tend-T0 | 4.0 (2.2) | 4.4 (2.3) | 23.2 (17.4) | — |
| Number of treatment episodes profile SBT II | 4189 | 4215 | 3799 | 1718 |
| SBT II: mean (SD) change Tend-T0 | 4.3 (2.3) | 4.7 (2.6) | 28.6 (19.3) | — |
| Number of treatment episodes profile SBT III | 1195 | 1196 | 1044 | 294 |
| SBT III: mean (SD) change Tend-T0 | 4.1 (2.5) | 4.5 (3.7) | 32.7 (23.4) | — |
a GPE-DV = Global Perceived Effect—Dutch Version; MCID = minimal clinically important difference; NPRS = Numeric Pain Rating Scale; PROM = patient-reported outcome measure; PSFS = Patient Specific Functional Scale; QBPDS = Quebec Back Pain Disability Scale; SBT = Start Back Tool.
b GPE is monitored only at the end of the treatment.
c Improved, stabilized, or deteriorated based on MCID cutoff points.
Included Cases in Multilevel Analysis
In total, 140 physical therapists (out of 1009) and 85 physical therapy practices (out of 219) fulfilled the 30/30 rule for at least 1 PROM with successful follow-up measurement (ie, ≥2 scores on the PROM in patients who had ≥2 visits) and could be included in the multilevel analysis. For modeling outcomes of pain intensity using the NPRS, a total of 13,096 (30% of total) treatment episodes were provided. For modeling physical activity measured with the PSFS, 106 physical therapists and 83 physical therapy practices provided a total of 10,363 (25% of total) treatment episodes. For modeling physical functioning measured with the QBPDS, 88 physical therapists and 55 physical therapy practices provided a total of 9437 (15% of total) treatment episodes. For modeling perceived effect measured with the Global Perceived Effect—Dutch Version, 53 physical therapists and 48 physical therapy practices provided a total of 7121 (11% of total) treatment episodes. The 30/30 inclusion rule was not reached for each PROM and associated outcome domain per SBT subgroup.
Comparability and Discriminative Ability
Table 4 shows that the ICCs fluctuated between 0.08 and 0.30 and was therefore interpreted as adequate to discriminate between physical therapists or practices.17 The adjusted model was used for the visual representation of the quality indicators in the focus group interviews.
Table 4.
Intraclass Correlation Coefficients for Intercept-Only Model and Adjusted Model for Change, End, and MCID Scores for Each PROMa
| Physical Therapist Level | Practice Level | |||
|---|---|---|---|---|
| Intercept-Only Model | Adjusted Model | Intercept-Only Model | Adjusted Model | |
| NPRS end score | 0.12 | 0.12 | 0.08 | 0.08 |
| NPRS change score | 0.08 | 0.12b | 0.06 | 0.08b |
| NPRS MCID | 0.11 | 0.12b | 0.09 | 0.10b |
| PSFS end score | 0.12 | 0.12 | 0.09 | 0.09 |
| PSFS change score | 0.13 | 0.16b | 0.08 | 0.11b |
| PSFS MCID | 0.16 | 0.17b | 0.11 | 0.12b |
| QBPDS end score | 0.15 | 0.16b | 0.15 | 0.15 |
| QBPDS change score | 0.20 | 0.30b | 0.12 | 0.21b |
| QBPDS MCIDc | 0.10 | 0.13b | 0.10 | 0.13b |
| GPE-DV end score | 0.18 | 0.18 | 0.10 | 0.10 |
| GPE-DV MCID | 0.14 | 0.14 | 0.13 | 0.13 |
aWith repeated measures for the total population on practice level and physical therapist level that provided >30 patients. GPE-DV = Global Perceived Effect—Dutch Version; ICC = intraclass correlation coefficient; MCID = minimal clinically important difference; NPRS = Numeric Pain Rating Scale; PROM = patient-reported outcome measure; PSFS: Patient Specific Functional Scale; QBPDS = Quebec Back Pain Disability Scale; SBT = Start Back Tool.
b Increase of the ICC in comparison with the intercept-only model with adjustment for case-mix variables age, sex, chronicity, and begin score of the PROM.
c For the multilevel analysis of the QBPDS, an MCID >20 points was used.
Visual Representation of Indicator Scores
Examples of caterpillar plots from the quality indicators listed above are presented in the Figure. In line with the ICC (range = 0.08–0.30), the Supplementary Material and the Figure show adequate variation of treatment outcomes among physical therapist practices. Roughly one-third of the physical therapist practices were divided into significantly lower than average, no difference, or higher than average, based on 95% CI. See Supplementary Appendix C for a visual representation of each defined potential quality indicator.
Figure.
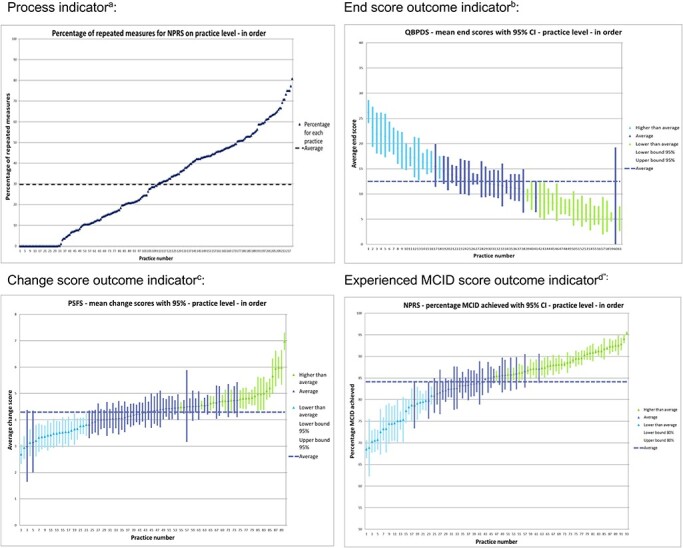
Visual representation of potential quality indicators at practice level. aThe percentage of patients with low back pain who received physical therapist treatment in which a pre and/or post NPRS was used. bThe mean end score with 95% CI on QBPDS of patients with nonspecific low back pain after physical therapist treatment. cThe mean change score with 95% CI on PSFS of patients with nonspecific low back pain between pretreatment and posttreatment. dThe percentage with 95% CI of patients with nonspecific low back pain who experienced a MCID on the NPRS between pretreatment and posttreatment. MCID = minimal clinically important difference; NPRS = Numeric Pain Rating Scale; PROM = patient-reported outcome measure; PSFS = Patient Specific Functional Scale; QBPDS = Quebec Back Pain Disability Scale.
Phase 2: Selecting a Core Set of Quality Indicators
Nineteen physical therapists and 4 senior researchers participated in 4 focus group interviews. The mean age was 37 years (range = 25–57); the average work experience was 11 years (range = 1–31). In general, the participants accepted the quality indicators for having added value in daily practice as quality improvement tools. The relative norms as presented (Figure) were interpreted as user friendly and easy to read. Participants mentioned that using the quality indicators can be a good opportunity to stimulate transparency of variation in outcomes between practices, but emphasized that for learning goals it is very important to create a safe environment for physical therapists when comparing outcomes. Furthermore, physical therapists expressed that, when comparing outcomes with their peers, they were interested in additional information, for example, treatment frequency and recurrences of NSLBP.
The majority of each focus group preferred the process indicators for routine measurement of the NPRS and PSFS, the pre-post treatment change scores of the NPRS, PSFS, QBPDS, and the MCID based on the posttreatment score of the Global Perceived Effect—Dutch Version for inclusion in the core set. Hence, the potential indicators with end scores and MCID were not selected for the NPRS, PSFS, and QBPDS. The final core set of quality indicators is presented in Table 5.
Table 5.
Selected Core Set of Quality Indicators That Is Accepted by Stakeholders on Usability and Perceived Added Value as Quality Improvement Tools Addeda
| Type of Indicator | PROM | Domain | Quality Indicator Description | Mean/Percentage (SD) b | Range b |
|---|---|---|---|---|---|
| Process | NPRS | Pain intensity | The percentage of patients with nonspecific low back pain who received physical therapy treatment and who completed the NPRS pretreatment and posttreatment to evaluate pain intensity | 30% | 0%–80% |
| Process | PSFS | Physical activity | The percentage of patients with nonspecific low back pain who received physical therapy treatment and who completed the PSFS pretreatment and posttreatment to evaluate physical activity | 25% | 0%–75% |
| Change | NPRS | Pain intensity | The mean change score + 95% CI of patients with nonspecific low back pain who received physical therapy treatment and are pre- and post-measured with the NPRS to evaluate pain intensity | 3.8 (0.6) | 2.3–5.8 |
| Change | PSFS | Physical activity | The mean change +95% CI score of patients with nonspecific low back pain who received physical therapy treatment and are pre- and post-measured with the PSFS to evaluate physical activity | 4.2 (0.7) | 2.7–7.0 |
| Change | QBPDS | Physical function | The mean change score + 95% CI of patients with nonspecific low back pain who received physical therapy treatment and are pre- and post-measured with the QBPDS to evaluate physical functioning | 24.6 (6.6) | 11.2–43.4 |
| MCID | GPE-DV | Perceived effect | The percentage of patients with nonspecific low back pain who received physical therapy treatment and experienced a MCID effect on the GPE-DV | 88% | 58%–96% |
a GPE-DV = Global Perceived Effect—Dutch Version; MCID = minimal clinically important difference; NPRS = Numeric Pain Rating Scale; PROM = patient-reported outcome measure; PSFS = Patient Specific Functional Scale; QBPDS = Quebec Back Pain Disability Scale.
b The mean/percentage and range are the outcomes of the cohort data that were used for describing and selecting the quality indicators for the core set.
Discussion
Of 15 defined potential outcome-based quality indicators, stakeholders selected a final core set of 6 quality indicators. The core set contains 2 process indicators: the percentage of completed NPRS for measuring pain intensity and the percentage of completed PSFS for measuring physical activity; and 4 outcome indicators: change scores for the NPRS, PSFS, and QBPDS for measuring pain intensity, physical activity, and physical functioning, respectively, and the Global Perceived Effect for measuring perceived effect using the MCID. All previously selected PROMs and associated outcome domains were included in the core set.7 The discriminability of the outcome-based quality indicators between physical therapists and physical therapy practices was adequate based on the ICCs. The outcome-based quality indicators were accepted by stakeholders for having added value in daily practice and for quality improvement purposes. To our knowledge, this is the first core set of outcome-based quality indicators developed for primary care physical therapists and practices treating patients with NSLBP.
The findings in the present study are supported by the work of other studies in this area. For example, the study of Hildon et al,20 which described views of patients and clinicians on comparing quality indicators for providers of surgery, underlined the value of comparison of outcomes between providers for quality improvement. The visual representation of caterpillar plots and the selection of the change scores and MCID for defining quality indicators based on PROMs has been used in other studies.5,13,19
The main difference with the present study is that our study explicitly focused on collecting and interpreting outcomes of care, whereas other studies mainly focused on process indicators, for example, by monitoring guideline adherence, the quality of the clinical reasoning process, and shared decision making.21–26
Also, although not all physical therapists routinely collected enough data, the amount of participating physical therapists and provided cohort data are significantly higher than in other studies.25,26 With physical therapists who routinely collected data and participated in focus group meetings for selection of the core set, engagement of end-users was optimally stimulated. We therefore believe that the usability and added value of the core set for daily practice is guaranteed, but that more effort is needed to implement the quality indicators in clinical practice.
The selected outcome domains and associated PROMs in the core set, that is, pain intensity, physical activity, physical functioning, and perceived effect, are partly in line with other research regarding the development of core outcome sets for patients with NSLBP.27–31 However, these core outcome sets are developed for clinical trial purposes and have not been tested for their relevance and feasibility in daily practice.7
To increase the usability of the indicators, we chose to include all available case-mix variables for adjustment in the multilevel analysis to enhance the acceptance of the quality indicators as a quality improvement tool. Excluding these case-mix variables might lead physical therapists to attribute differences in outcomes to these factors (eg, age of the patient or chronicity of the LBP) instead of to their own treatment decisions.
Implications for Research and Practice
As presented, physical therapists and physical therapist practices, who routinely sample sufficient data, can use this core set for monitoring and comparing treatment outcomes in research and daily practice to evaluate and stimulate quality of care. To develop a full picture of the validity and usefulness of the core set of outcome-based quality indicators, further research will be needed in which quality indicators are measured over time. Quality indicator scores can then be used for longitudinal evaluation and monitoring of achievements of physical therapists and practices using outcomes of patients.
An example of an approach for daily practice is comparing outcomes and receiving feedback from supervisors or colleagues in peer-review assessments.32,33 In such an approach, it is important to formulate explicit targets and action plans to enhance quality improvement initiatives.32 A plan-do-study-act cycle is a way to provide a structure for iterative testing and evaluation of change to improve quality of care.34 When using the plan-do-study-act cycle, physical therapists and physical therapy practices can define action plans that are based on their own specific learning goals. The quality indicators can play a key role in this process, thus leading to a substantial improvement in the care for patients with NSLBP.
As also mentioned by participating physical therapists in our focus groups, an important condition for comparing outcomes between peers is creating a safe environment to share and discuss real-world data.35 A safe environment for learning purposes stimulates the possibility to learn from each other, to try different treatment approaches, and to learn from mistakes, and thus to increase outcomes for future patients based on the interpretation of outcomes. Recently, Dutch physical therapy associations have developed manuals that guide peer assessment meetings in comparing real-world outcomes data as an instrument for continuous quality improvement.36,37 The next step is to investigate the impact of these meetings on quality of care.
Limitations
The most relevant limitation of our study is that many physical therapists did not reach the threshold of 30 treatment episodes with repeated measurements of PROMs, and they were therefore excluded for the multilevel analysis, and therefore from the comparison between physical therapists and practices. Moreover, the missing values on the SBT prohibited us from performing the multilevel analysis with the subgroups based on the SBT, whereas these subgroups were judged as clinically relevant by the physical therapists. This was confirmed by the descriptive statistics (Tab. 3) showing differences in baseline and change scores between the subgroups.
There are several possible reasons why many physical therapists did not provide more than 30 patients with NSLBP, including: low motivation for data sampling or having problems with data sampling routines in physical therapy; low motivation or missing skills to answer the questionnaires in patients; and technical issues with data extraction from the EHR to the national registries.2 Physical therapists in The Netherlands register their data via various EHR vendors that are responsible for providing data to national data registries.2 Each EHR has its own data infrastructure, interface, and privacy policy, which makes it complex to standardize outcomes in national data registries. Hence, standardizing outcomes of patients for each EHR vendor is time-consuming and requires collaboration of all stakeholders, including researchers, physical therapists, policy makers, and most importantly the EHR vendors themselves to solve technical issues.2 For example, technical issues can be identified and addressed by conducting end-to-end validations to investigate whether outcomes provided by physical therapists and patients are correctly documented in a national registry.
To implement the use of patient-reported outcome–based quality indicators in daily practice, an analysis of implementation determinants hindering or facilitating the data sampling process is necessary. These determinants are needed to choose strategies to improve the process from data sampling to data evaluation and to change practice routines.38 It is obvious that no single implementation strategy will be sufficient while differences between practices are large, so the implementation strategies should be tailored to determinants relevant in individual practices. However, studies in the past showed that using implementation strategies considerably increases the registration in physical therapist practice.2,39,40 Moreover, a qualitative study in physical therapy patients showed that they are motivated to use PROMs if physical therapists explain the added value.41 Therefore, we conclude that the next step should be focused on tailored implementation strategies to enable, motivate, and train patients and physical therapists to structurally register PROMs by solving technical and organizational issues with data sampling by patients and data extraction from EHRs.
Another limitation is that our study did not use a formal voting system to reach consensus in the selection of the core set, as is common in Delphi studies for developing quality indicators.42 However, the majority in each of the 4 focus groups selected the same outcome-based quality indicators. We think the absence of a formal voting system did not affect the selection of the core set of indicators.
In the current study we used convenience sampling for recruiting physical therapists. This may potentially have led to selection bias of Dutch physical therapists enthusiastic for participation in a study collecting and comparing their outcomes with their peers.
Indicators using the MCID were expressed as the percentage (with 95% CI) of patients who experienced a MCID between pretreatment and posttreatment to measure whether improvements in the outcome were clinically relevant. Natural history and regression to the mean are potential confounders that may influence indicator scores. However, we did not aim to perform an effectiveness study in a controlled setting, and we explored for the explained variation of real-world outcomes on the level of physical therapist practice. Still, when using MCID scores in quality indicators, the minimal detectable change also needs to be taken into account because the MCID scores may be smaller than the minimal detectable changes of investigated PROMs. In the current study, the minimal detectable changes of included measures were all within or the same as the MCID: for the PSFS, 1.443 (MCID 2 points); QBPDS, 15.8 points44 (MCID 20 points); and NPRS, 2 points45 (MCID 2 points).
Future work is required to identify more patient characteristics that could influence treatment outcomes of physical therapists or physical therapy practices. For example, socioeconomic status or recurrences of episodes in the same patient could be used as a case-mix variable in the multilevel analysis.
Conclusion
This study has defined, described, and selected a core set of outcome-based quality indicators based on cohort data and consensus. The core set was accepted by users and stakeholders for having added value for daily practice in physical therapy primary care and was found useful for quality improvement initiatives. Further studies should focus on further tailored implementation strategies that stimulate the use of the core set of outcome-based quality indicators, to register PROMs routinely for monitoring the quality of physical therapy care, and to use the indicators in plan-do-study-act cycles by evaluating specific improvement goals at the level of physical therapists or physical therapy practices.
Supplementary Material
Acknowledgments
The authors acknowledge the following individuals: Juliette Cruijsberg and Janine Liefers, research members; François Maissan, Bob van den Meiracker, Jasper Bier, and Harald Miedema, senior researchers; and all physical therapists who participated and provided data or participated in the focus group meetings.
Contributor Information
Arie C Verburg, Radboud University Medical Center, Radboud Institute for Health Sciences, IQ Healthcare, PO Box 9101, 6500 HB, Nijmegen, The Netherlands.
Simone A van Dulmen, Radboud University Medical Center, Radboud Institute for Health Sciences, IQ Healthcare, PO Box 9101, 6500 HB, Nijmegen, The Netherlands.
Henri Kiers, Institute of Human Movement Studies, Utrecht University of Applied Sciences, Utrecht, The Netherlands; Association for Quality in Physical Therapy (SKF), Zwolle, The Netherlands.
Maria W G Nijhuis-van der Sanden, Radboud University Medical Center, Radboud Institute for Health Sciences, IQ Healthcare, PO Box 9101, 6500 HB, Nijmegen, The Netherlands.
Philip J van der Wees, Radboud University Medical Center, Radboud Institute for Health Sciences, IQ Healthcare, PO Box 9101, 6500 HB, Nijmegen, The Netherlands.
Author Contributions
Concept/idea/research design: A.C. Verburg, S. Dulmen, H. Kiers, P. van der Wees
Writing: A.C. Verburg, S. Dulmen, H. Kiers, M. Nijhuis-van der Sanden
Data collection: A.C. Verburg, S. Dulmen, H. Kiers
Data analysis: A.C. Verburg
Project management: A.C. Verburg, P. van der Wees
Fund procurement: S. Dulmen, H. Kiers
Providing participants: A.C. Verburg, S. Dulmen, H. Kiers
Providing facilities/equipment: A.C. Verburg, S. Dulmen, H. Kiers
Providing institutional liaisons: A.C. Verburg, S. Dulmen, H. Kiers, P. van der Wees
Clerical/secretarial support: A.C. Verburg
Consultation (including review of manuscript before submitting): S. Dulmen, H. Kiers, P. van der Wees
Funding
The funders played no role in the design, conduct, or reporting of this study.
Ethics Approval
All procedures were conducted according to the Declaration of Helsinki. The study protocol was approved by the Medical Ethical Committee of Radboud University Medical Center (registration no. 2019–5455).
Disclosures
The authors completed the ICMJE Form for Disclosure of Potential Conflicts of Interest and reported no conflicts of interest. H. Kiers is a member of the board of directors of the Association for Quality in Physical Therapy (SKF), which made the data of participating physical therapists available for this study free of charge. P. van der Wees serves on the Editorial Board of PTJ and on the American Physical Therapy Association’s Scientific Advisory Panel.
References
- 1. Westby MD, Klemm A, Li LC, Jones CA. Emerging role of quality indicators in physical therapist practice and health service delivery. Phys Ther. 2016;96:90–100. [DOI] [PMC free article] [PubMed] [Google Scholar]
- 2. Meerhoff GA, van Dulmen SA, Maas MJM, Heijblom K, der Sanden MWG N-v, Van der Wees PJ. Development and evaluation of an implementation strategy for collecting data in a National Registry and the use of patient-reported outcome measures in physical therapist practices: quality improvement study. Phys Ther. 2017;97:837–851. [DOI] [PubMed] [Google Scholar]
- 3. van der Wees PJ, Verkerk EW, Verbiest MEA, et al. Development of a framework with tools to support the selection and implementation of patient-reported outcome measures. J Patient Rep Outcomes. 2019;3:75. [DOI] [PMC free article] [PubMed] [Google Scholar]
- 4. Cella D, Hahn EA, Jensen SE, Butt Z, Nowinski CJ, Rothrock N. Methodological Issues in the Selection, Administration and Use of Patient-Reported Outcomes in Performance Measurement in Health Care Settings. Washington, DC, USA: National Quality Forum (NQF); 2012. [Google Scholar]
- 5. National Quality Forum. Patient Reported Outcomes (PROs) in Performance Measurement. 2012. Accessed July 6, 2021. http://www.qualityforum.org/Publications/2012/12/Patient-Reported_Outcomes_in_Performance_Measurement.aspx.
- 6. Campbell SM, Braspenning J, Hutchinson A, Marshall MN. Research methods used in developing and applying quality indicators in primary care. BMJ. 2003;326:816–819. [DOI] [PMC free article] [PubMed] [Google Scholar]
- 7. Verburg AC, van Dulmen SA, Kiers H, der Sanden MWG N-v, van der Wees PJ. Development of a standard set of outcome measures for non-specific low back pain in Dutch primary care physiotherapy practices: a Delphi study. Eur Spine J. 2019;28:1550–1564. [DOI] [PubMed] [Google Scholar]
- 8. Weldring T, Smith SM. Patient-reported outcomes (PROs) and patient-reported outcome measures (PROMs). Health Serv Insights. 2013;6:61–68. [DOI] [PMC free article] [PubMed] [Google Scholar]
- 9. Kessel Pv, Triemstra M, de Boer D. Handreiking voor het meten van kwaliteit van zorg met [Patient reported outcome measures]. Zorginstituut Nederaland. 2014. Accessed April 14, 2021. https://nivel.nl/sites/default/files/bestanden/Handreiking-meten-kwaliteit-zorg-met-Patient-Reported-Outcome-Measures.pdf
- 10. Greenhalgh J, Dalkin S, Gooding K, et al. Functionality and feedback: a realist synthesis of the collation, interpretation and utilisation of patient-reported outcome measures data to improve patient care. Health Services and Delivery Research. Southampton, UK: NIHR Journals Library; 2017. [PubMed] [Google Scholar]
- 11. Hill JC, Dunn KM, Lewis M, et al. A primary care back pain screening tool: identifying patient subgroups for initial treatment. Arthritis Rheum. 2008;59:632–641. [DOI] [PubMed] [Google Scholar]
- 12. Staal J, Hendriks E, Heijmans M, et al. KNGF-richtlijn Lage rugpijn Verantwoording en toelichting. KNGF; 2013. [Google Scholar]
- 13. Hildon Z, Neuburger J, Allwood D, van der Meulen J, Black N. Clinicians' and patients' views of metrics of change derived from patient reported outcome measures (PROMs) for comparing providers' performance of surgery. BMC Health Serv Res. 2012;12:171. [DOI] [PMC free article] [PubMed] [Google Scholar]
- 14. Ali A, Ali S, Khan SA, et al. Sample size issues in multilevel logistic regression models. PLoS One. 2019;14:e0225427. [DOI] [PMC free article] [PubMed] [Google Scholar]
- 15. Koolman X, Zuidgeest M, Visser J, Appelman M. Indicatorstandaard 2.0: Methodologische criteria voor de ontwikkeling van betrouwbare kwaliteitsindicatoren in de zorg. Kwaliteitsinstituut; 2012. [Google Scholar]
- 16. Twisk JWR. Applied Mixed Model Analysis: A Practical Guide. 2nd ed. Cambridge: Cambridge University Press; 2019. [Google Scholar]
- 17. Boer D, Triemstra M, Koopman L, Zuidgeest M. Tool Analyses; voor het vergelijken van patiëntervaringen tussen zorgaanbieders versie 1.0. Zorginstituut Nederland: Diemen/Utrecht: NIVEL; 2016. https://www.nivel.nl/nl/publicatie/tool-analyses-voor-het-vergelijken-van-patientervaringen-tussen-zorgaanbieders-versie-10. [Google Scholar]
- 18. Goldstein H, Michael JRH. The graphical presentation of a collection of means. J R Stat Soc Ser A Stat Soc. 1995;158:175–177. [Google Scholar]
- 19. Hildon Z, Allwood D, Black N. Making data more meaningful: patients' views of the format and content of quality indicators comparing health care providers. Patient Educ Couns. 2012;88:298–304. [DOI] [PubMed] [Google Scholar]
- 20. Hildon Z, Allwood D, Black N. Patients' and clinicians' views of comparing the performance of providers of surgery: a qualitative study. Health Expect. 2015;18:366–378. [DOI] [PMC free article] [PubMed] [Google Scholar]
- 21. Petersson IF, Strombeck B, Andersen L, et al. Development of healthcare quality indicators for rheumatoid arthritis in Europe: the eumusc.net project. Ann Rheum Dis. 2014;73:906–908. [DOI] [PubMed] [Google Scholar]
- 22. Westby MD, Marshall DA, Jones CA. Development of quality indicators for hip and knee arthroplasty rehabilitation. Osteoarthr Cartil. 2018;26:370–382. [DOI] [PubMed] [Google Scholar]
- 23. Peter WF, Hurkmans EJ, van der Wees PJ, EJM H, van Bodegom-Vos L, TPM VV. Healthcare quality indicators for physiotherapy management in hip and knee osteoarthritis and rheumatoid arthritis: a Delphi study. Musculoskeletal Care. 2016;14:219–232. [DOI] [PubMed] [Google Scholar]
- 24. Scholte M, Neeleman-van der Steen CW, Hendriks EJ, Nijhuis-van der Sanden MW, Braspenning J. Evaluating quality indicators for physical therapy in primary care. Int J Qual Health Care. 2014;26:261–270. [DOI] [PubMed] [Google Scholar]
- 25. Oostendorp RA, Rutten GM, Dommerholt J, Nijhuis-van der Sanden MW, Harting J. Guideline-based development and practice test of quality indicators for physiotherapy care in patients with neck pain. J Eval Clin Pract. 2013;19:1044–1053. [DOI] [PubMed] [Google Scholar]
- 26. Oostendorp RAB, Elvers JWH, van Trijffel E, et al. Relationships between context, process, and outcome indicators to assess quality of physiotherapy care in patients with whiplash-associated disorders: applying Donabedian's model of care. Patient Prefer Adherence. 2020;14:425–442. [DOI] [PMC free article] [PubMed] [Google Scholar]
- 27. Chiarotto A, Boers M, Deyo RA, et al. Core outcome measurement instruments for clinical trials in nonspecific low back pain. Pain. 2018;159:481–495. [DOI] [PMC free article] [PubMed] [Google Scholar]
- 28. Chiarotto A, Deyo RA, Terwee CB, et al. Core outcome domains for clinical trials in non-specific low back pain. Eur Spine J. 2015;24:1127–1142. [DOI] [PubMed] [Google Scholar]
- 29. Clement RC, Welander A, Stowell C, et al. A proposed set of metrics for standardized outcome reporting in the management of low back pain. Acta Orthop. 2015;86:523–533. [DOI] [PMC free article] [PubMed] [Google Scholar]
- 30. Deyo RA, Battie M, Beurskens AJ, et al. Outcome measures for low back pain research. A proposal for standardized use. Spine. 1998;23:2003–2013. [DOI] [PubMed] [Google Scholar]
- 31. Bombardier C. Outcome assessments in the evaluation of treatment of spinal disorders: summary and general recommendations. Spine. 2000;25:3100–3103. [DOI] [PubMed] [Google Scholar]
- 32. Ivers N, Jamtvedt G, Flottorp S, et al. Audit and feedback: effects on professional practice and healthcare outcomes. Cochrane Database Syst Rev. 2012:CD000259. [DOI] [PMC free article] [PubMed] [Google Scholar]
- 33. Maas MJM, Driehuis F, Meerhoff GA, et al. Impact of self- and peer assessment on the clinical performance of physiotherapists in primary care: a cohort study. Physiother Can. 2018;70:393–401. [DOI] [PMC free article] [PubMed] [Google Scholar]
- 34. Taylor MJ, McNicholas C, Nicolay C, Darzi A, Bell D, Reed JE. Systematic review of the application of the plan-do-study-act method to improve quality in healthcare. BMJ Qual Saf. 2014;23:290–298. [DOI] [PMC free article] [PubMed] [Google Scholar]
- 35. Maas MJ, Nijhuis-van der Sanden MW, Driehuis F, Heerkens YF, van der Vleuten CP, van der Wees PJ. Feasibility of peer assessment and clinical audit to self-regulate the quality of physiotherapy services: a mixed methods study. BMJ Open. 2017;7:e013726. [DOI] [PMC free article] [PubMed] [Google Scholar]
- 36. Maas MJ, de Leur M, Wees PJvd, Kiers H. Peer review—meetinformatie gebruiken om te leren en verbeteren. Keurmerk Fysiotherapie. 2020. Accessed April 14, 2021. https://www.keurmerkfysiotherapie.nl/wp-content/uploads/2020/06/peer-review-2020-thema-1.-data-1.0.pdf [Google Scholar]
- 37. Maas MJ, van Poelgeest E, Weymans C, PJvd W. Module 3 feedback op proces en uitkomsten. KNGF; 2018.
- 38. van Achterberg T, Schoonhoven L, Grol R. Nursing implementation science: how evidence-based nursing requires evidence-based implementation. J Nurs Scholarsh. 2008;40:302–310. [DOI] [PubMed] [Google Scholar]
- 39. Baker R, Camosso-Stefinovic J, Gillies C, et al. Tailored interventions to address determinants of practice. Cochrane Database Syst Rev. 2015;2015:CD005470. [DOI] [PMC free article] [PubMed] [Google Scholar]
- 40. Bosch M, van der Weijden T, Wensing M, Grol R. Tailoring quality improvement interventions to identified barriers: a multiple case analysis. J Eval Clin Pract. 2007;13:161–168. [DOI] [PubMed] [Google Scholar]
- 41. Meerhoff GA, van Dulmen SA, Maas MJM, Bakker-Jacobs A, der Sanden MWG N-V, van der Wees PJ. Exploring the perspective of patients with musculoskeletal health problems in primary care on the use of patient-reported outcome measures to stimulate quality improvement in physiotherapist practice; a qualitative study [Published online October 22, 2019]. Physiother Theory Pract. doi: 10.1080/09593985.2019.16782052019. [DOI] [PubMed] [Google Scholar]
- 42. Boulkedid R, Abdoul H, Loustau M, Sibony O, Alberti C. Using and reporting the Delphi method for selecting healthcare quality indicators: a systematic review. PLoS One. 2011;6:e20476. [DOI] [PMC free article] [PubMed] [Google Scholar]
- 43. Maughan EF, Lewis JS. Outcome measures in chronic low back pain. Eur Spine J. 2010;19:1484–1494. [DOI] [PMC free article] [PubMed] [Google Scholar]
- 44. Demoulin C, Ostelo R, Knottnerus JA, Smeets RJ. Quebec back pain disability scale was responsive and showed reasonable interpretability after a multidisciplinary treatment. J Clin Epidemiol. 2010;63:1249–1255. [DOI] [PubMed] [Google Scholar]
- 45. Childs JD, Piva SR, Fritz JM. Responsiveness of the numeric pain rating scale in patients with low back pain. Spine. 2005;30:1331–1334. [DOI] [PubMed] [Google Scholar]
- 46. Ostelo RW, Deyo RA, Stratford P, et al. Interpreting change scores for pain and functional status in low back pain: towards international consensus regarding minimal important change. Spine. 2008;33:90–94. [DOI] [PubMed] [Google Scholar]
- 47. Farrar JT, Young JP Jr, LaMoreaux L, Werth JL, Poole RM. Clinical importance of changes in chronic pain intensity measured on an 11-point numerical pain rating scale. Pain. 2001;94:149–158. [DOI] [PubMed] [Google Scholar]
- 48. van Dulmen SA, van der Wees PJ, Bart Staal J, Braspenning JCC, Nijhuis-van der Sanden MWG. Patient reported outcome measures (PROMs) for goalsetting and outcome measurement in primary care physiotherapy, an explorative field study. Physiotherapy. 2017;103:66–72. [DOI] [PubMed] [Google Scholar]
- 49. Schoppink LE, van Tulder MW, Koes BW, Beurskens SA, de Bie RA. Reliability and validity of the Dutch adaptation of the Quebec back pain disability scale. Phys Ther. 1996;76:268–275. [DOI] [PubMed] [Google Scholar]
- 50. Ostelo RW, de Vet HC. Clinically important outcomes in low back pain. Best Pract Res Clin Rheumatol. 2005;19:593–607. [DOI] [PubMed] [Google Scholar]
Associated Data
This section collects any data citations, data availability statements, or supplementary materials included in this article.