Abstract
Liver stiffness is an essential clinical biomarker for diagnosing liver fibrosis and cirrhosis. In current clinical practice, elastography techniques are standard non-invasive diagnosis tools to assess stiffness of liver, using either Ultrasound (US) or magnetic resonance imaging (MRI). However, the US elastography yields ≈ 10 % failure rate and degraded performance on obese patients, while the MR elastography is costlier and less available. Compared with US and MRI, the computerized tomography (CT) imaging has not been widely used in measuring liver stiffness. In this paper, we performed a pilot study to assess if volumetric variations of liver can be captured from paired inspiratory-expiratory chest (PIEC) CT scans. To enable the assessment, we propose a Hierarchical Intra-Patient Organ-specific (HIPO) registration pipeline to quantify the partial liver volumetric variations with lung pressure from a respiratory cycle. The PIEC protocol is employed since it naturally provides two paired CT scans with liver deformation from regulated respiratory motions. For the subjects whose registration results passed both an automatic quantitative quality assurance (QA) and another visual qualitative QA, 6.0% average volumetric variations of liver were measured, from inspiratory phase to expiratory phase. Future clinical validations will be required to validate the findings in this pilot study.
Keywords: liver volumetric variation, liver segmentation, liver registration, cirrhosis diagnosis
1. INTRODUCTION
Liver biopsy is the standard tool for diagnosing liver fibrosis.1 However, due to poor patient acceptance and risk of complication, a number of noninvasive imaging techniques have emerged and may potentially replace liver biopsy, including ultrasound (US), computed tomography (CT), and magnetic resonance imaging (MRI).2 A simple and inexpensive approach to evaluate a suspected liver fibrosis is US elastography using either transient elastography (TE) “Fibroscan” or acoustic radiation force impulse (ARFI) elastography. However, the US elastography techniques are limited by the observer variability, local measurements on a small liver volume, and degraded performance on obese patients.3 Without such limitations, magnetic resonance elastography (MR elastography) is preferable to US elastography, which is currently regarded as the most reliable noninvasive method for staging liver fibrosis.3 However, the limited availability outside of academia and the higher cost are still major obstacles of deploying MR elastography.4 A recent large retrospective study5 elucidated that the MR elastography failure is significantly associated with massive ascites, body mass index, iron deposition, and 3T vs.1.5T MRI scanner.
Compared with US and MR, CT is currently less investigated especially for analyzing liver stiffness.2 Current CT imaging techniques have been studied for diagnosing liver fibrosis, such as using perfusion, fractional extracellular space techniques, and dual energy.5 However, such techniques are still yield inferior performance compared with elastography techniques. In clinical practice, we noticed that the shape of liver can vary along with breathing (Figure 1). Therefore, the liver stiffness might be reflected by the amount of volumetric variations during the respiratory cycle. In this paper, as the first step towards assessing this clinical hypothesis, we perform a pilot study to assess if there are volumetric variations of liver on randomly selected patients across paired inspiratory-expiratory chest (PIEC) CT scans. To enable such assessment, we propose a Hierarchical Intra-Patient Organ-specific (HIPO) registration pipeline to quantify the partial liver volumetric variations under the internal respiratory pressures.
Figure 1.
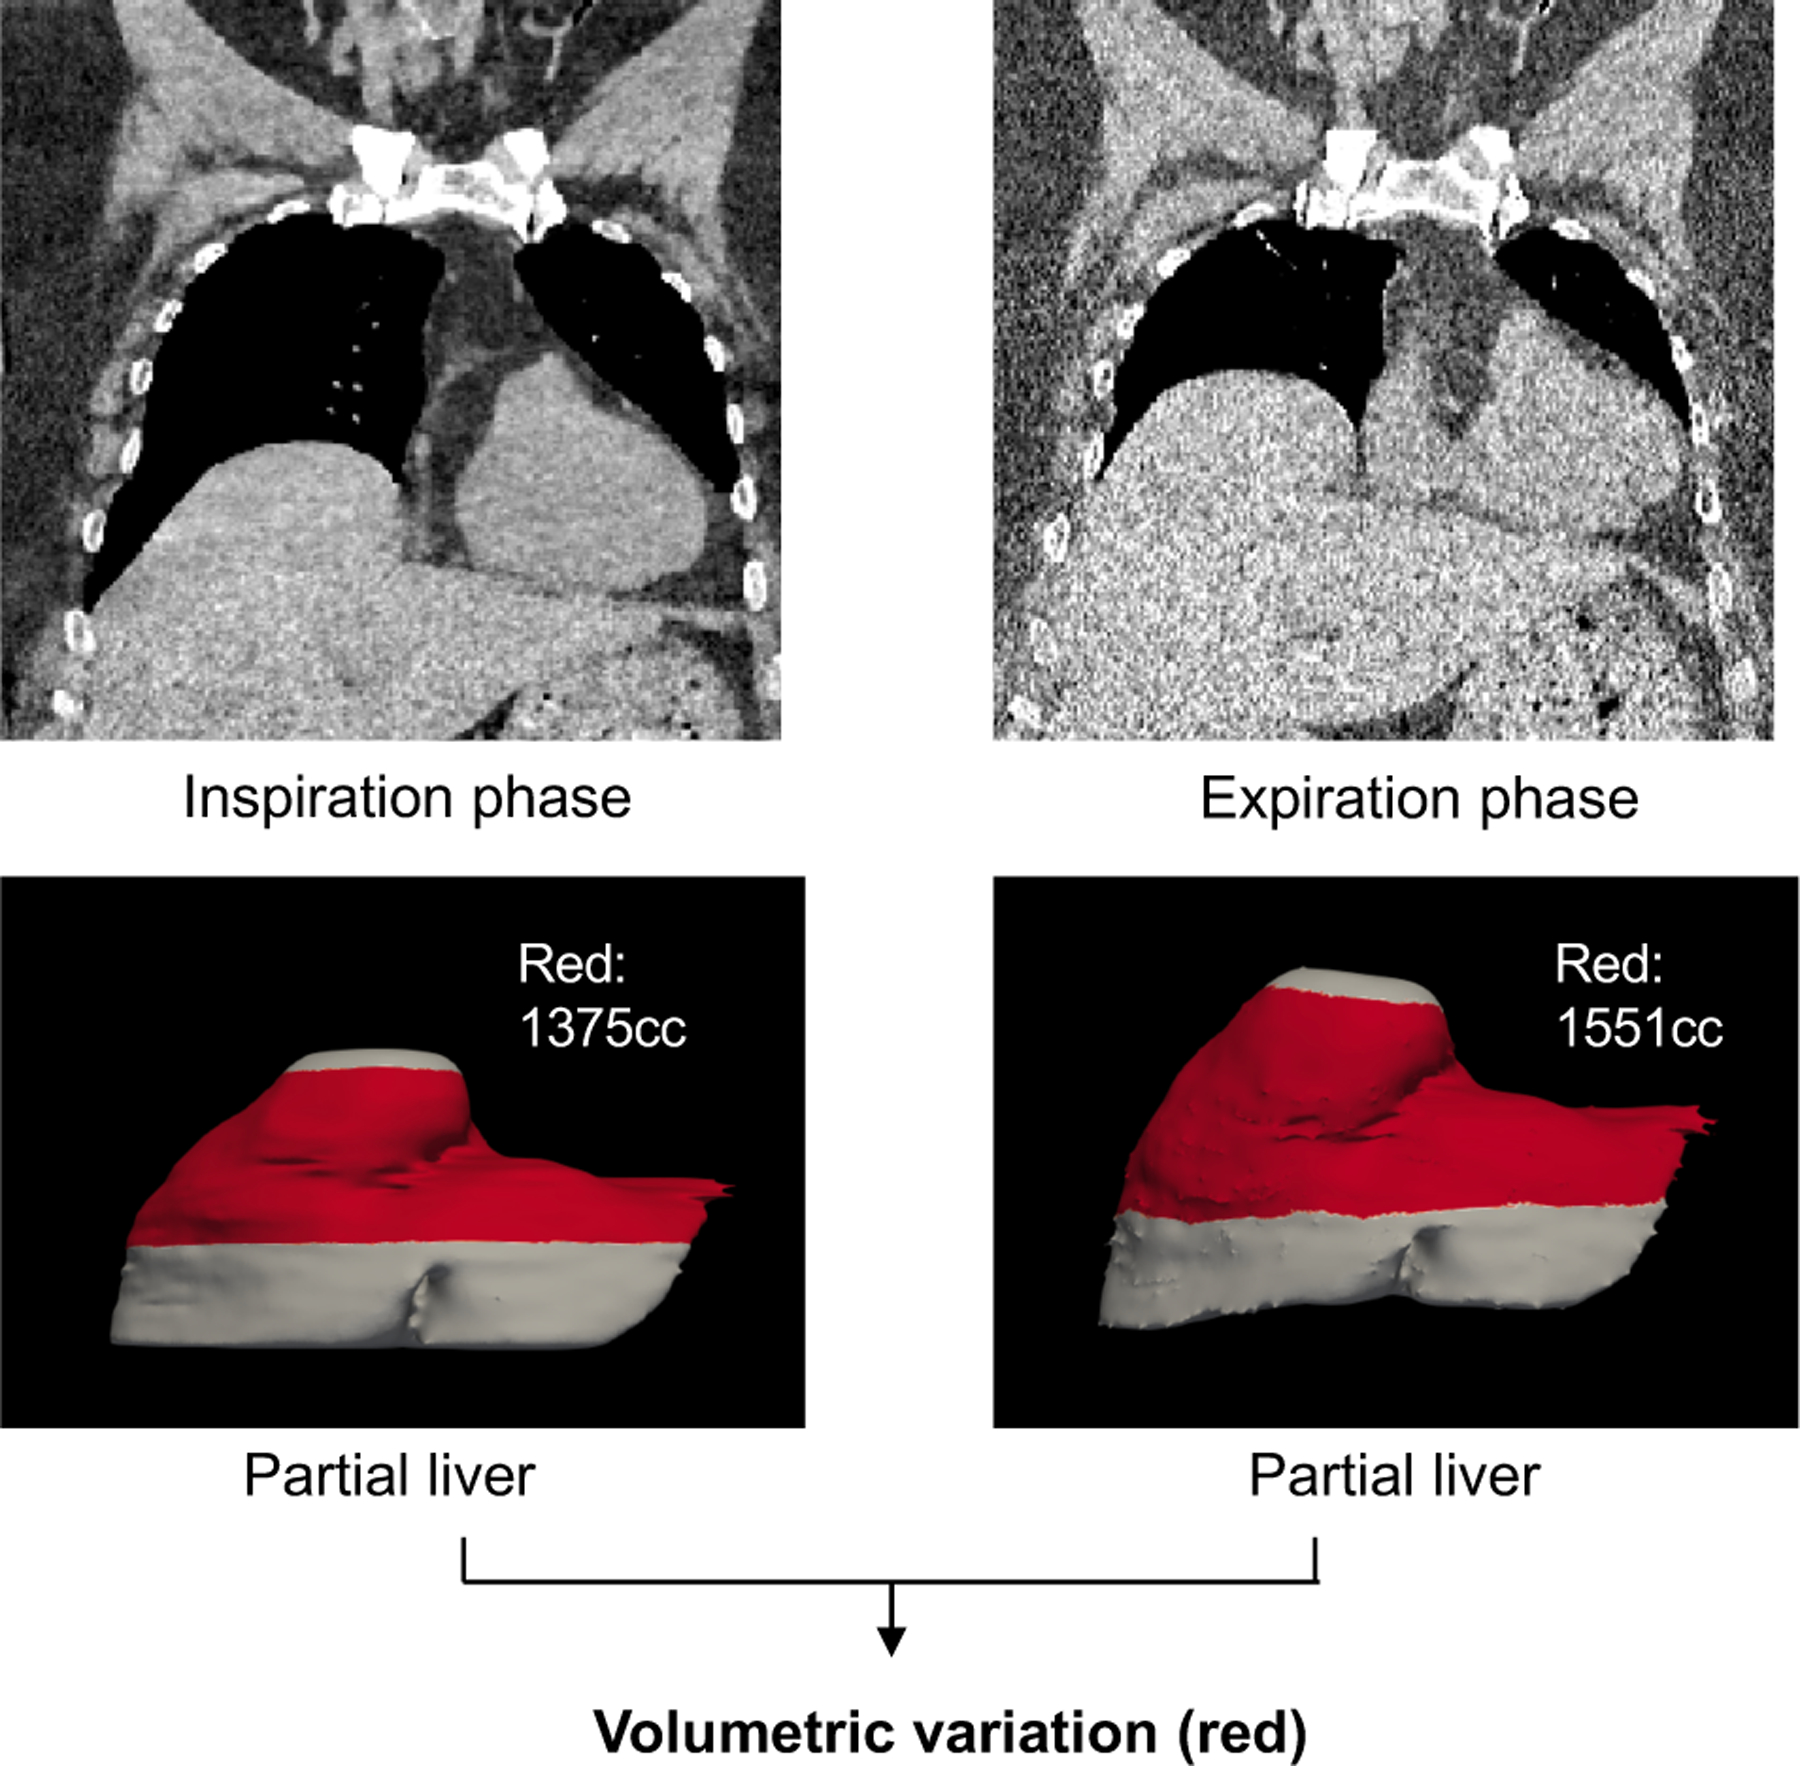
This figure shows the overall motivation of this study, which is to measure partial liver volumetric variations across paired inspiratory-expiratory chest (PIEC) CT scans.
As the PIEC CT scans are designed for diagnosing lung diseases, the inferior boarder of the livers is typically not covered (Figure 1). Therefore, it is impractical to manually annotate complete livers in both phases and calculate the differences. To estimate the elastic volumetric variations across PIEC CT scans, the partial livers were manually annotated in inspiratory (INS) phase. Then, the annotated liver masks were registered to expiratory (EXP) phase by applying the deformation fields, which were calculated by using our HIPO algorithm from the paired intensity CT scans (Figure 2). PIEC CT scans from 23 patients were randomly obtained from our clinical database (without filtering specific diseases). To alleviate impacts of local registration errors when calculating the volumetric changes, we calculated the average volumetric differences across different liver sections for each subject, rather than from a single partial liver estimation. Next, the liver sections were filtered by keeping the ones within 3.4%6 cycle consistent registration error (described in §2.3). After the quantitative filtering and visual inspections, volumetric variations from 13 patients were reported in this study. Among those patients, more than 50% of the subjects had more than 8% of liver enlargement, from INS to EXP phase.
Figure 2.
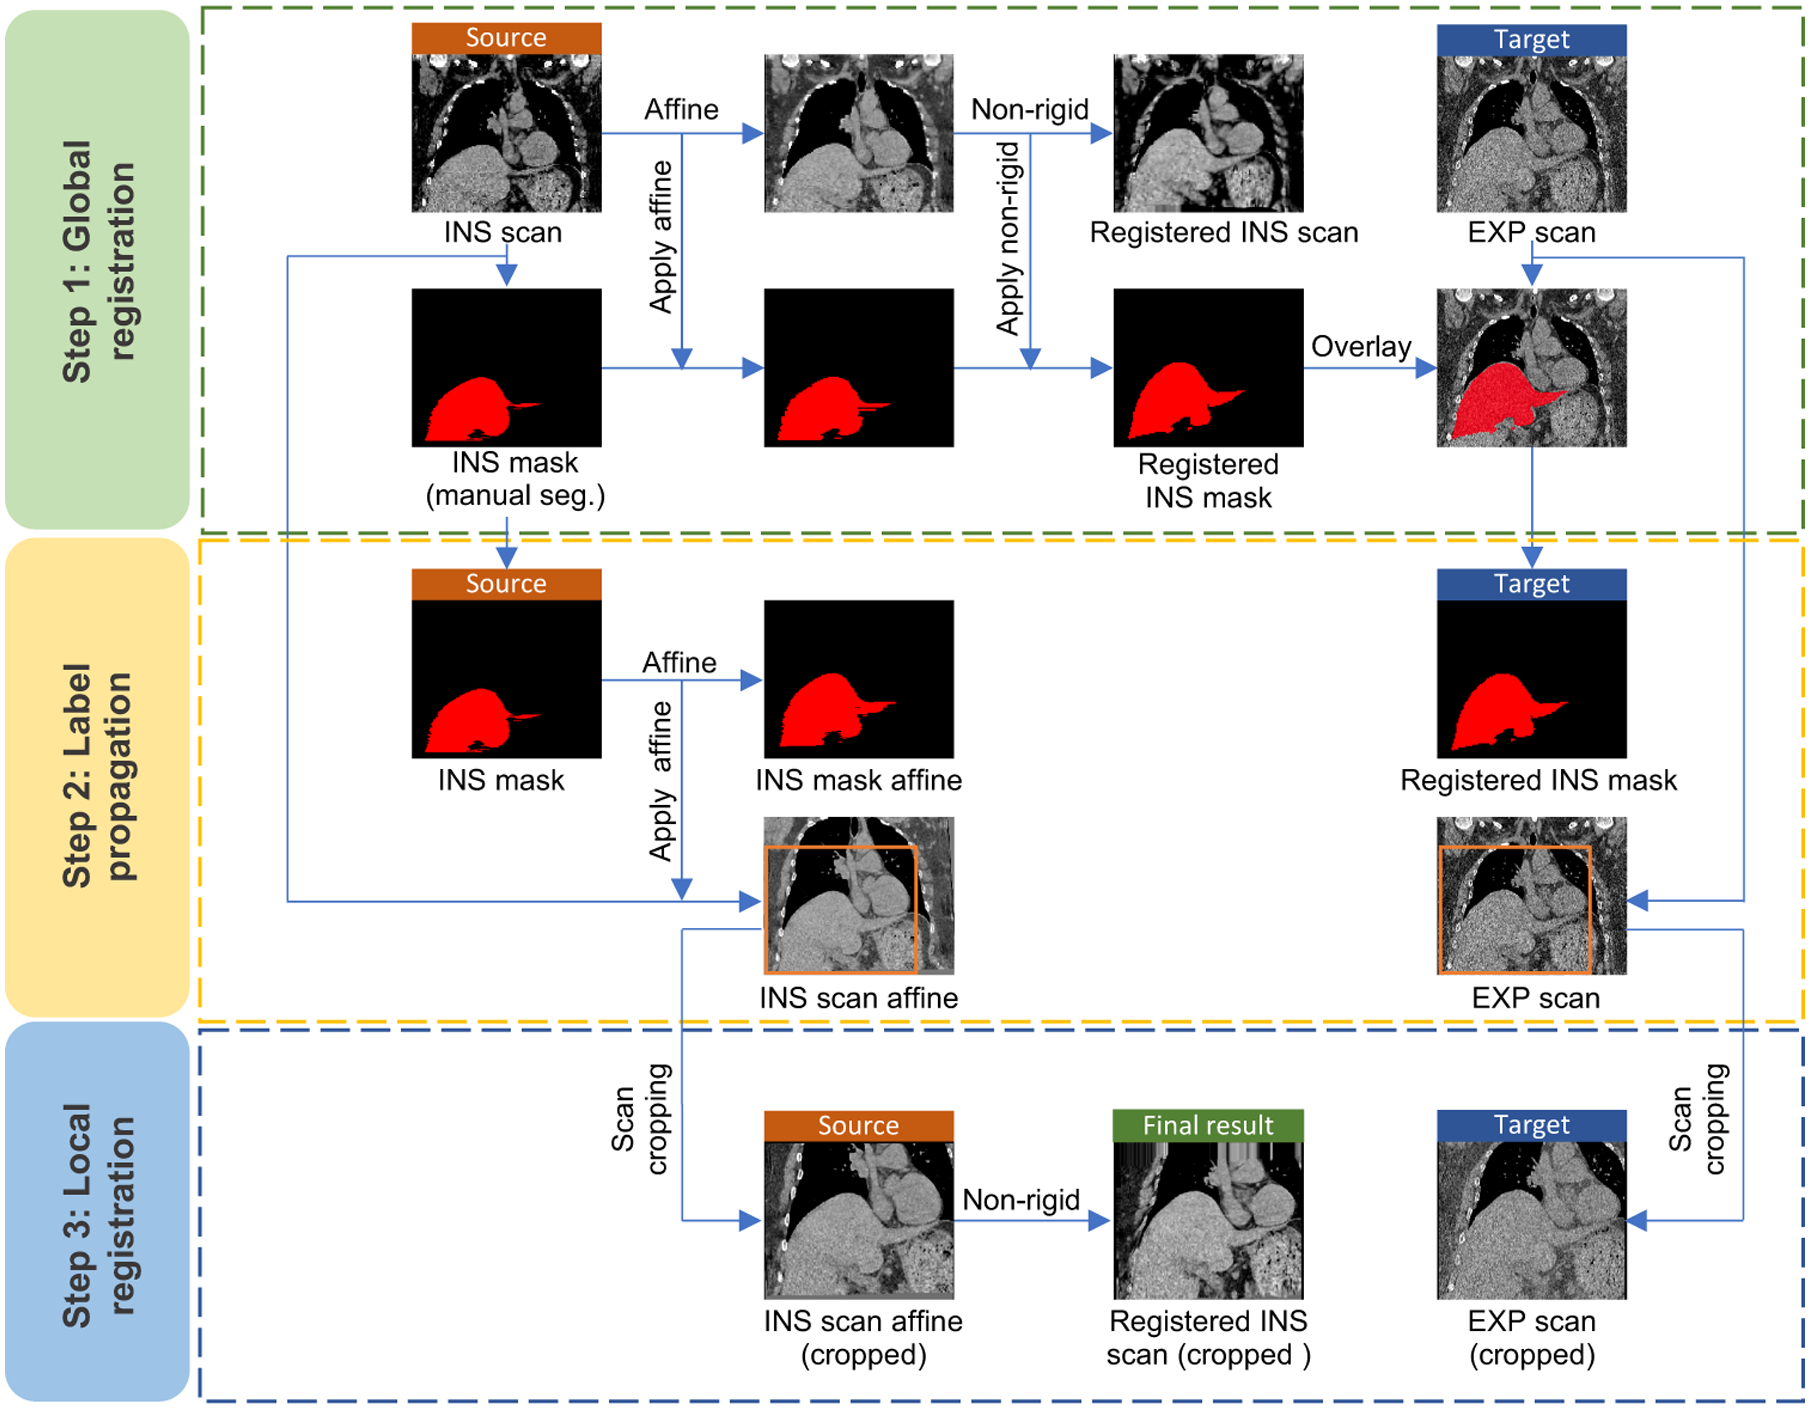
This figure presents the registration framework of the proposed Hierarchical Intra-Patient Organ-specific (HIPO) registration pipeline. The registration pipeline is divided into 3 stages: (1) scan-wise global registration, (2) liver mask based organ alignment, and (3) liver-wise local registration.
2. METHOD
2.1. Hierarchical intra-patient organ-specific (HIPO) registration pipeline
The overall registration pipeline of the proposed HIPO method is presented in Figure 2. A three-stages strategy is proposed to achieve optimized registration performance for liver. First, a scan-wise global registration is performed to propagate the manual liver masks from INS phase to EXP phase. Then, an Affine registration is used to roughly align the livers across paired CT scans. Next, the liver regions in both phases are manually cropped and aligned by another non-rigid registration.
2.1.1. Scan-wise global registration
First, all partial livers were manually traced for all INS phase scans by an experienced annotator, and confirmed by another senior annotator with more than five years’ liver annotation experience. Then, the scan-wise global registration was performed between INS scan (as source image) and EXP scan (as target image). Briefly, an Affine registration (NiftyReg7), followed by a non-rigid registration (DEEDS8) was employed, to register the INS scan to EXP scan (Step 1 in Figure 2). The DEEDS registration was used as it outperformed other registration methods for aligning abdomen organs.9 Next, we applied the Affine transformation matrix and the non-rigid deformation fields to transfer the manual liver masks from INS phase to EXP phase.
2.1.2. Liver mask based organ alignment
As scan-wise global registration was not specifically designed for the liver, it was used as a coarse registration step to roughly locate the liver in the EXP scan. Then, we performed another independent Affine registration to align the paired liver masks (Step 2 in Figure 2). By applying the Affine matrix, the liver region in INS phase was roughly aligned to EXP phase.
2.1.3. Liver-wise local registration
The last stage in the HIPO algorithm was to align the livers in a fine level. Since previous study has demonstrated that the organ registration using cropped regions is more precise than using whole scans,10 we manually cropped the liver regions before performing the fine registration (Step 3 in Figure 2). Then, the same DEEDS registration8 was employed to perform the organ specific fine level registration.
2.2. Volumetric variation calculation
Figure 1 shows the example of registering the INS phase to EXP phase. The volumetric variation from INS phase to EXP phase ϕItoE was calculated as
| (1) |
where the VINS was volume of the manual mask in INS phase, while the was volume of the deformed mask in EXP phase. To enhance the robustness of ϕ, we performed another HIPO registration from EXP to INS, and the volumetric variation was calculated as
| (2) |
where the was volume of the deformed liver mask in Eq. 1, while the was volume of the deformed mask in INS phase, by performing another independent HIPO registration from EXP phase to INS phase using as input mask (Figure 3). The final volumetric variation of the liver from INS phase to EXP phase was calculated as
| (3) |
Figure 3.
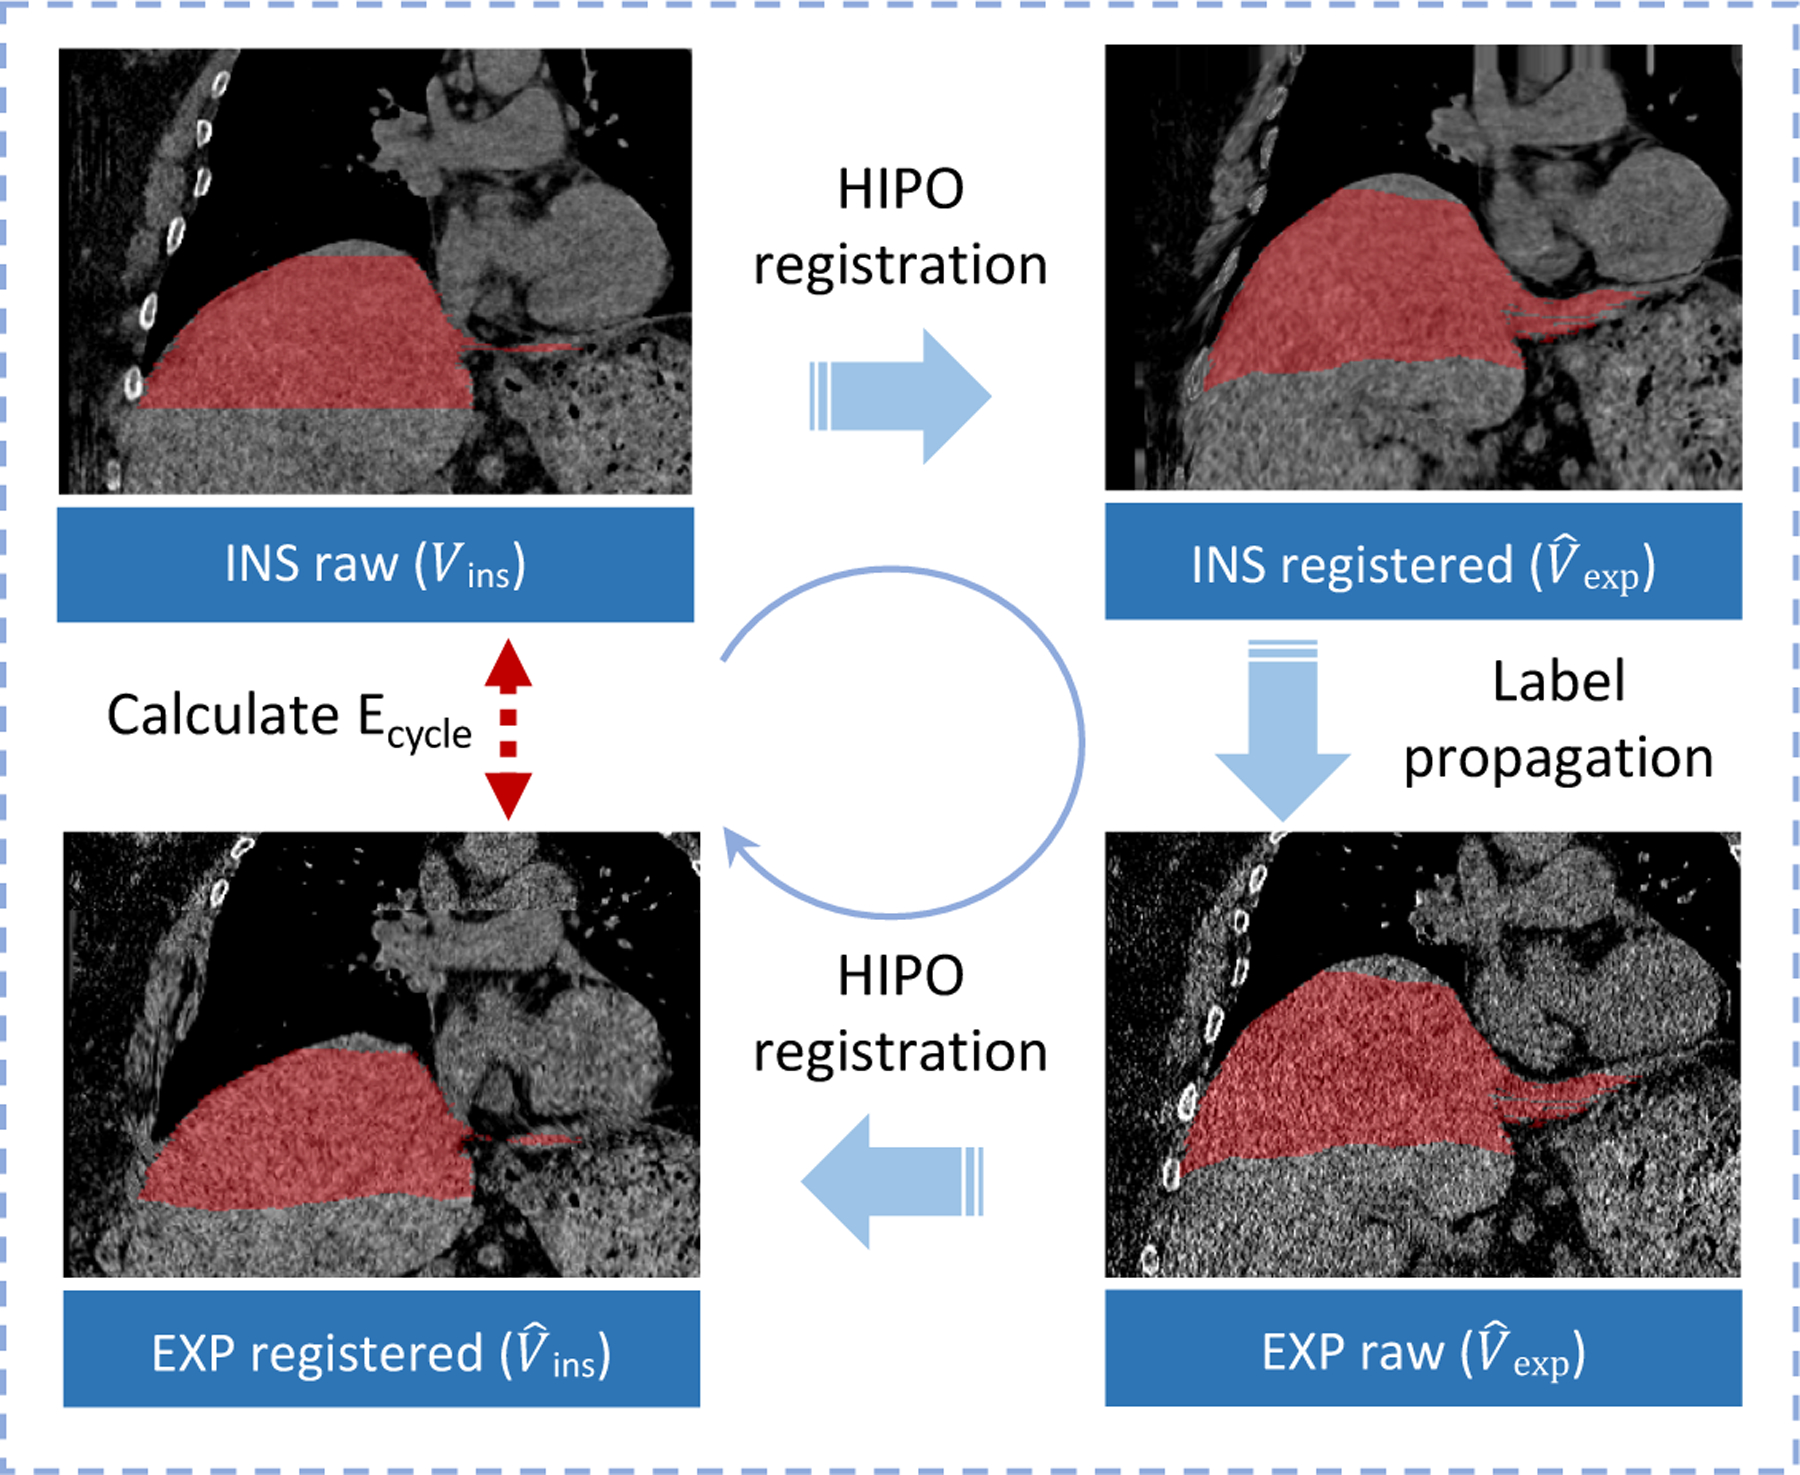
This figure elucidates the framework of computing cycle consistent error.
2.3. Cycle consistent error estimation
Ideally, the ϕItoE should be identical to ϕEtoI, without registration error. However, the registration error is typically inevitable when computing the deformation fields and performing interpolations. Therefore, we calculated the cycle consistent error Ecycle as
| (4) |
With the cycle consistent error, we were able to solidify a necessary condition of successful registration. Concretely, we excluded the results of which Ecycle > T. T was empirically set to 3.4% as it was the maximum inter-rater variability between two clinical experts to annotate the same liver in CT.6 Note that the Ecycle ≤ T was only used as a necessary condition, but not a sufficient condition. Satisfying necessary condition did not guaranteed a successful registration. Therefore, another visual inspection was performed (described in §3.2) to further validate the results.
3. EXPERIMENTS
3.1. Data
The 46 PIEC CT scans from 23 anonymous patients were used in this study. The CT scans were randomly selected from Vanderbilt University Medical Center (VUMC) clinical database system. All scans were non-contrast high resolution CT (HRCT) scans, with voxel size between 0.6×0.6×0.6mm3 and 1.0×1.0×1.0mm3.
3.2. Quality Assurance
As the PIEC CT scans typically contained partial liver volumes in this study, the percentages of available liver tissue varied in this study. Aiming to a fair comparison between different patients, also to alleviate the registration errors, the liver sections were used in this study to calculate the and Ecycle in Eq. 3 and 4. The calculation strategy is presented in Figure 4, where the and Ecycle of all possible liver sections are presented. The variations were performed on the manual INS liver masks, by changing the starting slice (ztop) and ending slice (zbottom).
Figure 4.
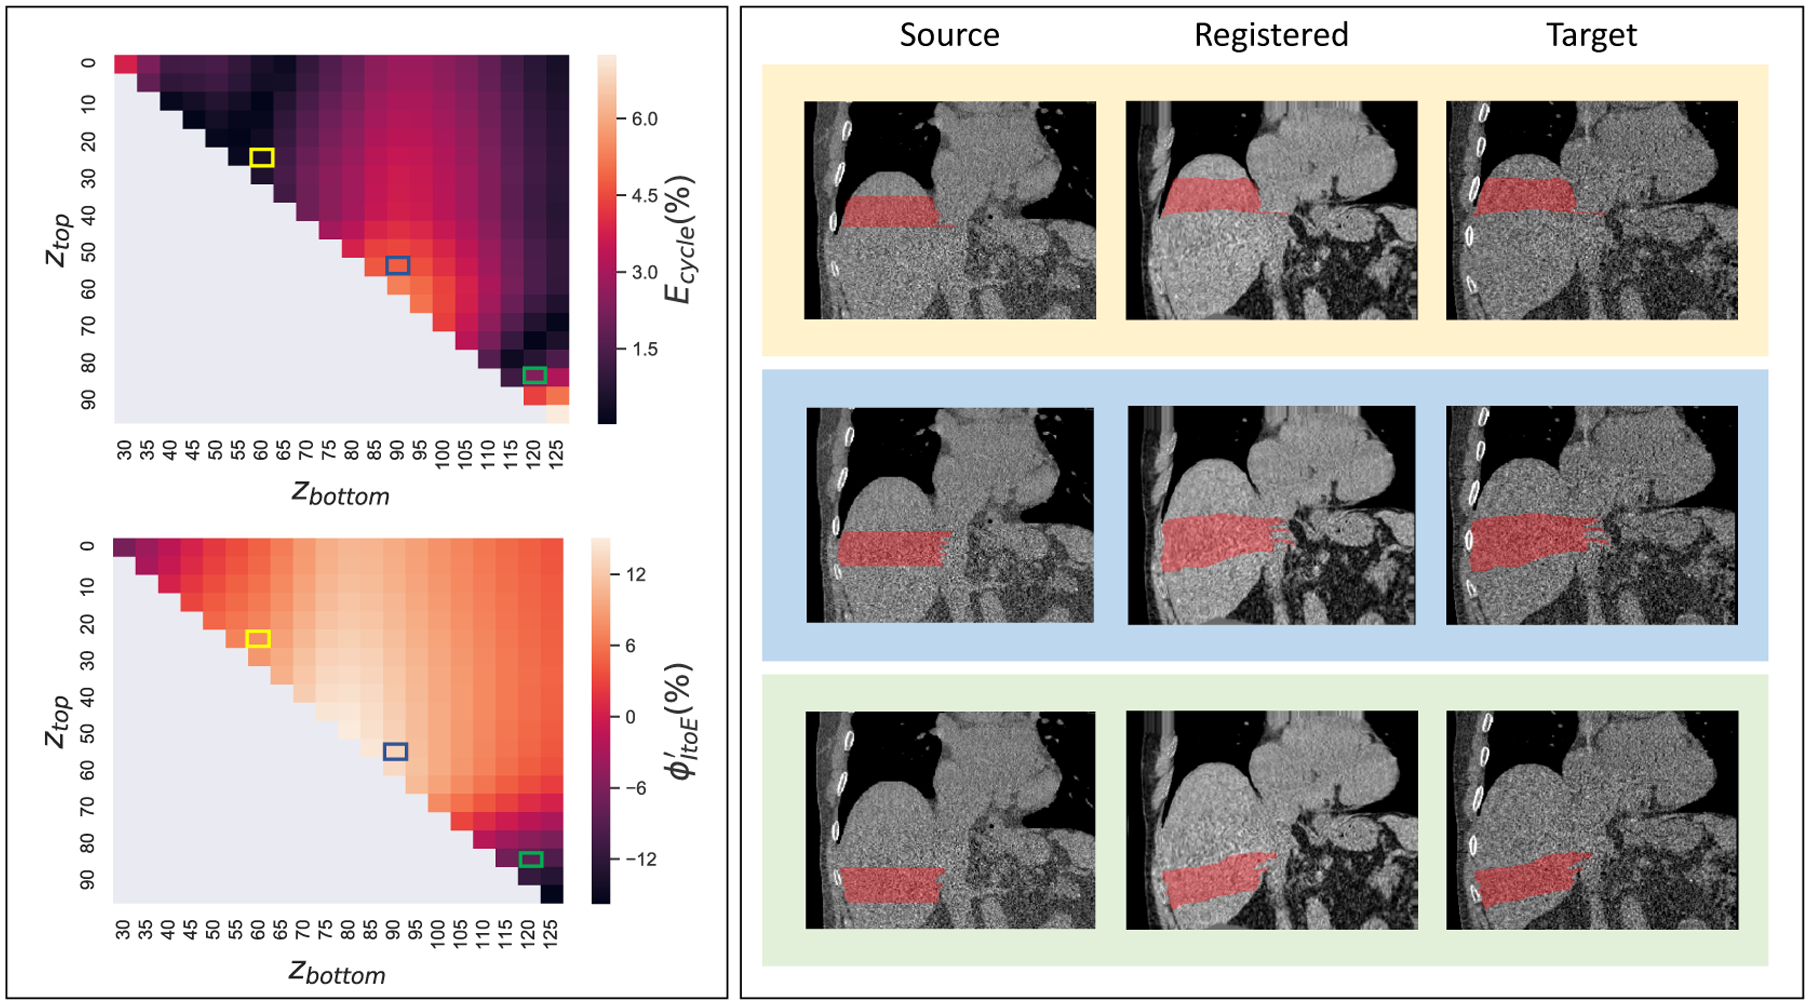
This figure shows the distribution of cycle consistent error Ecycle and volumetric variation by permutating ztop and zbottom for all possible liver sections. The left panels present the Ecycle and by changing ztop and zbottom. In the right panels, three representative liver sections (red) are presented, which are corresponding to the three rectangles in Ecycle and maps.
To alleviate the effects from registration errors, we performed quality assurance (QA) for each patient. From Figure 4, the registration errors are typically less stable at the superior edge and inferior edge of the liver, due to large deformation at the lung-liver boundary, and the fact of having partial liver at the inferior edge. Therefore, the top and bottom 20% of the liver tissues were excluded from calculation. Then, we calculated the average volumetric variations for all liver sections (for each section) which satisfied Ecycle < 3.4%, as our final metrics If no liver section satisfied Ecycle < 3.4% for a subject, that subject would be excluded from our following volumetric variation analysis. For all subjects that satisfied such criteria, another visual QA was performed by the senior annotator to ensure the boundaries of the registered liver sections in EXP phase were legitimate.
4. RESULTS
The proposed HIPO pipeline was performed on all 23 subjects, followed by the automatic and visual QA described in § 3.2. The example QA results are presented in Figure 5, where 13 subjects passed QA. Form those 13 subjects, the mean volumetric variation of liver is 6.0%, with standard deviation 4.8%. The minimum volumetric variation is −0.2%, while the maximum volumetric variation is 14.2%.
Figure 5.
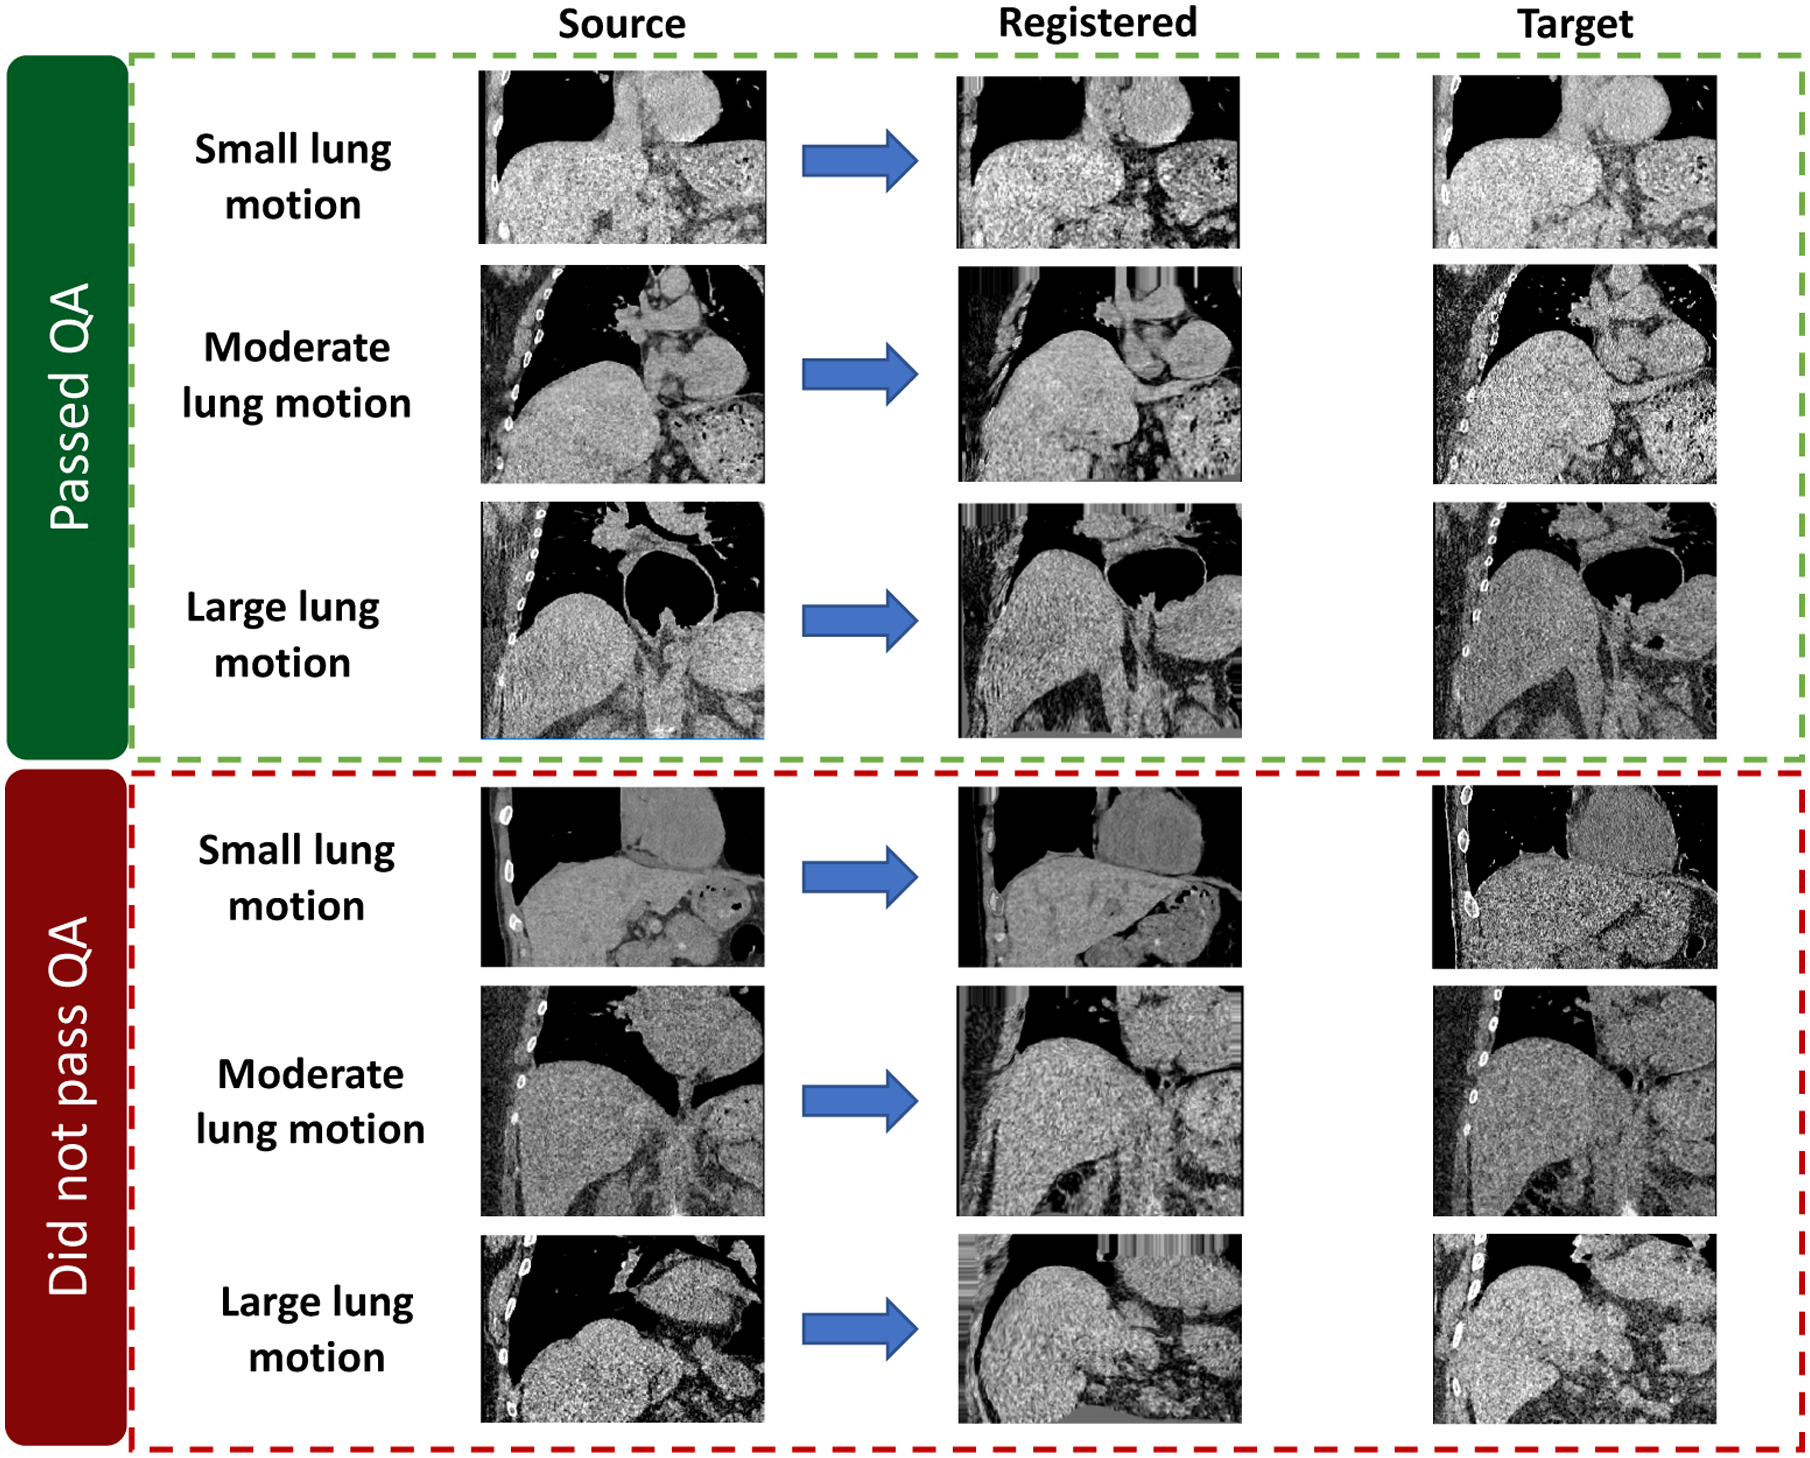
This figure shows the registration results from representative subjects. The upper three subjects passed the QA, while lower three are excluded from our following volumetric variation analysis.
5. CONCLUSIONS AND DISCUSSION
In this study, we evaluated the volumetric variations across PIEC CT scans from 23 patients, by proposing the HIPO registration pipeline. After performing the cycle registration error based QA and the visual QA, 13 patients passed the QA process. For the 13 patients, the average volumetric variations of liver were 6.0%, from inspiratory phase to expiratory phase.
Future Validations:
As a pilot study, the average liver volumetric variations were measured to be 6.0% using our HIPO method. Although an automatic QA (circle consistent error) and another manual QA (visual inspection) were performed, more rigorous future clinical validations will still be necessary to validate this finding. One potential method to validate the algorithm will be to mine the large-scale Image VU cohort at Vanderbilt University to find a subset of patients with the complete liver included in PIEC CT scans. Next, the manual liver annotations will be performed on both paired scans to quantify the liver volumetric variations. Another method, even better, will be to recruit a small cohort of patients (half cirrhosis half normal) to perform contrast-enhanced abdominal CT imaging under inspiratory-expiratory protocol, containing complete livers. Then, the more precise manual liver annotations will be enabled on contrast-enhanced CT scans to validate the liver volumetric variations across the respiratory cycle.
Future Improvements:
The future technical improvements would be: (1) to replace the manual liver annotation and cropping with automatic methods11 or even one-shot learning based methods,12 (2) to investigate and develop more precise registration algorithms to further reduce the registration error, (3) to include more subjects with clinical phenotypes to expand the study cohort, and (4) to associate the volumetric variation with clinical phenotypes, such as hepatic fibrosis and cirrhosis.
6. ACKNOWLEDGMENTS
This work has not been submitted for publication or presentation elsewhere. This research was supported by NSF CAREER 1452485, NIH grants 5R21 EY024036, R01 EB017230 (Landman), R01 AR048797 (Carr) and R01 DK071891 (Freedman).
REFERENCES
- [1].Lee YA, Wallace MC, and Friedman SL, “Pathobiology of liver fibrosis: a translational success story,” Gut 64(5), 830–841 (2015). [DOI] [PMC free article] [PubMed] [Google Scholar]
- [2].Huber A, Ebner L, Heverhagen JT, and Christe A, “State-of-the-art imaging of liver fibrosis and cirrhosis: A comprehensive review of current applications and future perspectives,” European journal of radiology open 2, 90–100 (2015). [DOI] [PMC free article] [PubMed] [Google Scholar]
- [3].Horowitz JM, Venkatesh SK, Ehman RL, Jhaveri K, Kamath P, Ohliger MA, Samir AE, Silva AC, Taouli B, Torbenson MS, et al. , “Evaluation of hepatic fibrosis: a review from the society of abdominal radiology disease focus panel,” Abdominal Radiology 42(8), 2037–2053 (2017). [DOI] [PMC free article] [PubMed] [Google Scholar]
- [4].Kennedy P, Wagner M, Castéra L, Hong CW, Johnson CL, Sirlin CB, and Taouli B, “Quantitative elastography methods in liver disease: current evidence and future directions,” Radiology 286(3), 738–763 (2018). [DOI] [PMC free article] [PubMed] [Google Scholar]
- [5].Wagner M, Corcuera-Solano I, Lo G, Esses S, Liao J, Besa C, Chen N, Abraham G, Fung M, Babb JS, et al. , “Technical failure of mr elastography examinations of the liver: experience from a large single-center study,” Radiology 284(2), 401–412 (2017). [DOI] [PMC free article] [PubMed] [Google Scholar]
- [6].Childs JT, Thoirs KA, and Esterman AJ, “Computed tomography volume measurements of the liver using a liver segmentation and analysis package: an intra-and inter-rater reliability study,” Journal of Biomedical Graphics and Computing 5(2), 17–22 (2015). [Google Scholar]
- [7].Modat M, Cash DM, Daga P, Winston GP, Duncan JS, and Ourselin S, “Global image registration using a symmetric block-matching approach,” Journal of Medical Imaging 1(2), 024003 (2014). [DOI] [PMC free article] [PubMed] [Google Scholar]
- [8].Heinrich MP, Jenkinson M, Brady M, and Schnabel JA, “Mrf-based deformable registration and ventilation estimation of lung ct,” IEEE transactions on medical imaging 32(7), 1239–1248 (2013). [DOI] [PubMed] [Google Scholar]
- [9].Xu Z, Lee CP, Heinrich MP, Modat M, Rueckert D, Ourselin S, Abramson RG, and Landman BA, “Evaluation of six registration methods for the human abdomen on clinically acquired ct,” IEEE Transactions on Biomedical Engineering 63(8), 1563–1572 (2016). [DOI] [PMC free article] [PubMed] [Google Scholar]
- [10].Xu Z, Burke RP, Lee CP, Baucom RB, Poulose BK, Abramson RG, and Landman BA, “Efficient multi-atlas abdominal segmentation on clinically acquired ct with simple context learning,” Medical image analysis 24(1), 18–27 (2015). [DOI] [PMC free article] [PubMed] [Google Scholar]
- [11].Raju A, Cheng C-T, Huo Y, Cai J, Huang J, Xiao J, Lu L, Liao C, and Harrison AP, “Co-heterogeneous and adaptive segmentation from multi-source and multi-phase ct imaging data: A study on pathological liver and lesion segmentation,” arXiv preprint arXiv:2005.13201 (2020). [Google Scholar]
- [12].Lu Y, Zheng K, Li W, Wang Y, Harrison AP, Lin C, Wang S, Xiao J, Lu L, Kuo C-F, et al. , “Learning to segment anatomical structures accurately from one exemplar,” arXiv preprint arXiv:2007.03052 (2020). [Google Scholar]


