Abstract
Accurate segmentation of the optic disc (OD) regions from color fundus images is a critical procedure for computer-aided diagnosis of glaucoma. We present a novel deep learning network to automatically identify the OD regions. On the basis of the classical U-Net framework, we define a unique sub-network and a decoding convolutional block. The sub-network is used to preserve important textures and facilitate their detections, while the decoding block is used to improve the contrast of the regions-of-interest with their background. We integrate these two components into the classical U-Net framework to improve the accuracy and reliability of segmenting the OD regions depicted on color fundus images. We train and evaluate the developed network using three publicly available datasets (i.e., MESSIDOR, ORIGA, and REFUGE). The results on an independent testing set (n=1,970 images) show a segmentation performance with an average Dice similarity coefficient (DSC), intersection over union (IOU), and Matthew's correlation coefficient (MCC) of 0.9377, 0.8854, and 0.9383 when trained on the global field-of-view images, respectively, and 0.9735, 0.9494, and 0.9594 when trained on the local disc region images. When compared with the other three classical networks (i.e., the U-Net, M-Net, and Deeplabv3) on the same testing datasets, the developed network demonstrates a relatively higher performance.
Keywords: segmentation, color fundus images, optic disc, deep learning, U-Net
1. Introduction
As a chronic and progressive optic neuropathy, glaucoma is one of the leading causes of irreversible vision loss in the world [1]. In its early stage, glaucoma can gradually reduce the visual field of patients without obvious symptoms and ultimately leads to a severe deterioration of vision [2]. Hence, timely screening and early detection are very important for preventing vision loss associated with glaucoma [3]. In clinical practice, ophthalmologists typically assess glaucoma by manually measuring the cup-to-disc ratio (CDR) based on color fundus images [4], where identifying the optic disc is one of the most important preprocessing steps. To improve the efficiency and consistency, especially in the screen setting, and avoid potential errors associated with this subjective assessment, it is extremely desirable to develop computerized algorithms [5-7] to extract the OD from retinal fundus images.
OD is the entry point for major blood vessels [8] and typically appears a bright yellowish region with a circular or elliptical shape on color fundus images [9,10]. By leveraging this image characteristic, a variety of unsupervised segmentation methods [11-13] have been developed to automatically identify OD and quantify its morphology. These methods generally attempted to classify each pixel as either background or disc region leveraging various hand-crafted features, such as structural textures and feature entropy [14,15]. A review of the relevant methods in this regard can be found in [16]. For instance, Welfer et al. [17] applied an adaptive mathematical morphology method to segment the OD. Septiarini et al. [18] combined an adaptive thresholding procedure and a morphological operation to locate the OD region. However, these hand-crafted features could be very sensitive to many factors [19,20], such as light exposure and the existence of diseases, which may significantly affect the appearance of the OD regions on color fundus images (Fig. 1), thereby making it challenging to accurately identify the OD regions [6,7].
Fig. 1.
Illustration of color fundus images with different qualities caused by tissue abnormality and light exposure.
In recent years, deep learning technology, especially the convolutional neural networks (CNNs), has been widely used in the area of medical image analysis [21-23] and demonstrated remarkable segmentation performance. There have been investigative efforts dedicated in this regard to segment OD [24-26]. Fu et al. [27] proposed a deep learning architecture called M-Net to jointly segment the optic disc and cup (OC) from fundus images in a one-stage segmentation procedure, where the M-Net consists of multi-scale side-input and side-output layers, and a U-shape convolutional network. Wang et al. [28] described a coarse-to-fine deep learning framework on the basis of the classical U-Net network [25] to identify the OD by combining color fundus images and their vessel density maps. Gu et al. [29] developed a context encoder network (CE-Net) based on the U-Net model by introducing a dense atrous convolution block and a residual multi-kernel pooling block to capture more high-level image features and preserve spatial information. Wang et al. [30] employed a patch-based output space adversarial learning framework (pOSAL) to jointly and robustly extract the OD and OC from multiple fundus image datasets and reduce the influence of the domain shift among different datasets. To further improve the segmentation accuracy in the disc and cup boundary regions, Wang et al. [31] proposed a boundary and entropy-driven adversarial learning (BEAL) framework. In architecture, the available networks were typically formed by an image encoder, a feature decoder, and a skip connection, and thus can be viewed as somewhat variants of the U-Net model. Additional variants can be found in [32-34]. A common limitation of these networks lies in the utilization of the consecutive pooling or strided convolutional operations, which often lead to the loss of some important features associated with object positions and boundaries [35]. Also, the extracted features are used indiscriminately in the feature decoder, making these networks insensitive to some important feature information and the morphological changes of target objects. Although the limitations can be eliminated partially by training the networks on local disc patches with a relatively large image dimension (e.g., 512×512), this strategy needs the manual location of the OD regions and has a high computational cost.
To overcome the above limitations, we propose a novel deep learning network to automatically segment the OD from fundus images. The proposed network uses several multi-scale input features to reduce the influence of the consecutive pooling operations. These multi-scale features are then incorporated into both the encoding and decoding procedures by element-wise subtraction. This motivation is to preserve key image information in the encoding procedure while highlighting the morphological and boundary changes of target objects to enable an accurate segmentation.
2. Proposed Method
2.1. Network overview
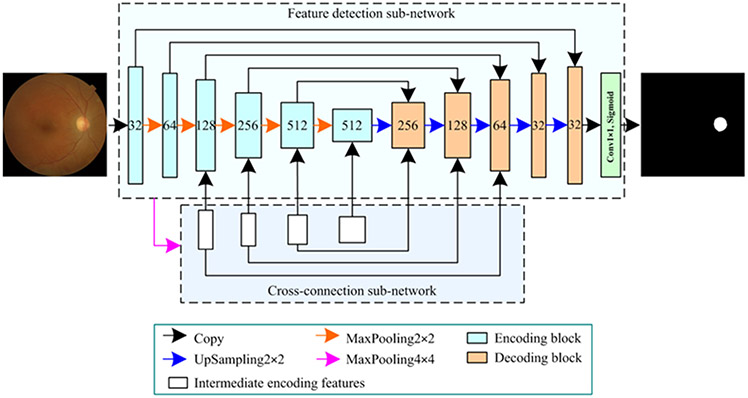
The proposed network architecture is formed by a feature detection sub-network (FDS) and a cross-connection sub-network (CCS) (Fig. 2). FDS is used to detect image features and extract desirable objects, while CCS facilitates object segmentation by providing additional vital features. FDS is derived from the classical U-Net model with different encoding and decoding convolutional blocks. The encoding block is defined by stacking two same convolutional layers, each of which includes a 3×3 convolutional kernel (Conv3×3), a batch normalization (BN), and an element-wise rectified linear unit (ReLU) activation [36]. The number of convolutional kernels or filters is initially set at 32 and gradually increases as the way shown in Fig. 2. The obtained convolutional results are processed using a 2×2 MaxPooling layer with a stride of 2 (MaxPooling2×2) to reduce redundant features and thus improve training efficiency. After the application of these encoding and MaxPooling operations, a number of high-dimensional features are extracted from the input images. These features are processed using a 2×2 UpSampling layer with a stride of 2 (UpSampling2×2), followed by a decoding block.
Fig. 2.
The architecture of the developed network for segmenting the OD regions on color fundus images.
During the processing procedure, different convolutional features from the FDS and CCS sub-networks, as shown in Fig. 2, are combined to guide the extraction of desirable objects. The last decoding features are fed into a 1×1 convolution layer (Conv1×1) with a sigmoid activation to achieve a probability map for the OD on the entire fundus images. Notably, due to the presence of the CCS sub-network, both the encoding and decoding blocks have two different versions for varying input features, and these features are combined in different manners (Section 2.2). The source codes of the developed network can be found at https://github.com/wmuLei/ODsegmentation.
2.2. Cross-connection sub-network (CCS)
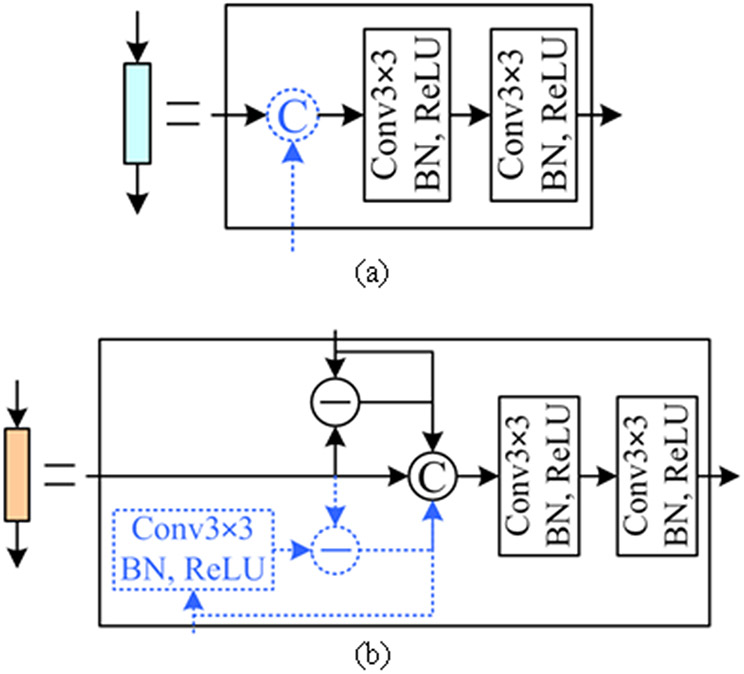
Inspired by the M-Net model [27], we use the CCS sub-network to reduce the impact of multiple pooling operations and improve segmentation accuracy. CCS uses multi-scale input features for image encoding, which is similar to the side-input sub-network in the M-Net model. Specifically, CCS consists of four components by down-sampling the first four encoding features using a 4×4 MaxPooling layer with a stride of 4 (MaxPooling4×4). These components (intermediate encoding features) have relatively low convolutional hierarchies and contain a large number of structural textures associated with target objects. The structural textures are concatenated, along with image depth dimension, with the subsequent encoding features, when they have the same image width and height, as shown in Fig. 3(a). This will lead to the combination of both low- and high-level features and make additional key textures available in segmentation. These texture features are fed into the decoding blocks using the element-wise subtraction and concatenation, as illustrated in Fig. 3(b). The use of the subtraction operation can improve the sensitivity of the developed model to the OD boundaries, as compared with the U-Net and M-Net models.
Fig. 3.
The encoding (a) and decoding (b) blocks in the developed network. The operations specified by the dotted lines are activated in the presence of texture features from the CCS sub-network.
2.3. Decoding block
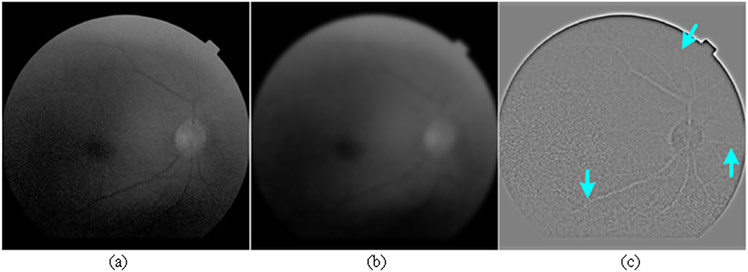
We use the decoding blocks to combine multiple encoding features, as displayed in Fig. 3(b), and highlight the morphological differences of target objects in these feature maps. These blocks can be fed with two input features (both from FDS) or three features (one from CCS and two from FDS). When there are three input features for these blocks, the input features from the CCS sub-network are firstly processed using a sequence of Conv3×3, BN, and ReLU operations to ensure that they have proper image dimensions for subsequent operations. The processed features are then combined with another two input features from the FDS sub-network using the element-wise subtraction and concatenation operations to enhance the objects' boundaries, as illustrated in Fig. 3(b). The utilization of the subtraction operation is motivated by the traditional edge detection method [37], where the element-wise intensity differences between a given image and its Gaussian filtered version can highlight a variety of edge information, as shown by Fig. 4. The subtraction operation allows the decoding block to capture various features associated with object boundaries and thus improve the segmentation accuracy. Also, the subtraction operation will lead to different numbers of filters for the encoding and decoding blocks, which make the developed network asymmetric and lightweight, as compared with the classical U-Net model [28].
Fig. 4.
The difference image (c) between a given image (a) and its Gaussian filtered version (b). As indicated by the arrows, subtle structural features are highlighted in the difference image.
2.4. Training the network
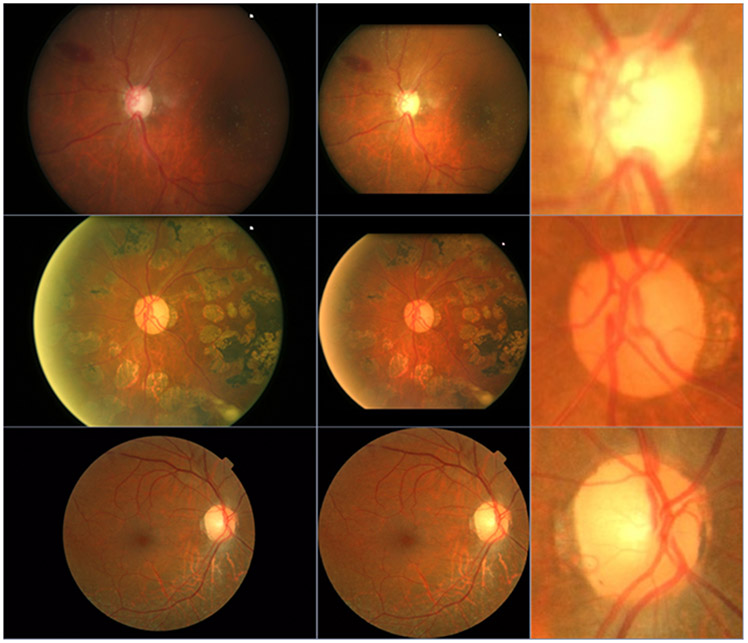
We implemented the proposed network using the Keras library with TensorFlow backend (https://keras.io/) and trained it using the MESSIDOR dataset [28], which is publicly available and widely used to develop algorithms for computer-assisted diagnoses of diabetic retinopathy (DR). In the MESSIDOR dataset, there are 1,200 color fundus images, including 540 normal images and 660 images diagnosed with DR. We preprocessed these images to exclude the background and resize the field-of-view regions to a uniform dimension of 256×256 pixels. Then, these images were normalized to alleviate the effects caused by different illumination conditions (e.g., over- or under-exposure), as shown in Fig. 5. The processed dataset was randomly divided into three sub-groups at a ratio of 0.75:0.15:0.1 for training (n=900), internal validation (n=180), and independent testing (n=120), respectively. The local disc regions in each sub-group were manually cropped and resized at a dimension of 256×256 pixels, resulting in an additional local disc region image dataset, which consisted of training, internal validation, and independent testing sub-groups as well. The dimensions of these local disc regions were approximately three times the radius of the OD. We used the global field-of-view images and the local disc regions to train the proposed network separately.
Fig. 5.
Illustration of three original fundus images (left column), their normalized results (middle column), and local disc regions (right column).
The Dice similarity coefficient (DSC) [38,39] was used as the loss function and given by:
| (1) |
where A and B are the segmentation results obtained by the proposed network and manual annotation, respectively. N(·) denotes the number of the pixels enclosed set. ∩ and ∪ are the intersection and union operators. The DSC was optimized using the exponential moving average variant of the adaptive moment (Adam) estimation (AMSGrad) [40]. In the AMSGrad optimization, the parameters β1 and β2 were set to 0.9 and 0.999, respectively, the initial learning rate was set to 1.0e-3 for the global field-of-view images and to 1.0e-4 for the local disc regions. A total of 150 epochs were used during the training, and the batch size was set at 8. The training process stopped if the DSC did not improve for consecutive 30 epochs. To improve the robustness of the training procedure, we augmented the images to improve their diversity [28,30]. Specifically, the images were randomly flipped along horizontal and vertical axes, and translated by −15 to 15 percent per axis, and rotated from −90 to 90 degrees.
2.5. Performance evaluation
We assessed the performance of the developed network using the independent testing sub-group of the MESSIDOR dataset and the publicly available ORGIA and REFUGE datasets [8]. A detailed description of the three datasets can be found in [28,36]. We also compared the performance of the developed network with three classical networks, namely the U-Net, M-Net, and Deeplabv3 with the backbone network ‘xception’ [30], under the same experiment configurations. The differences of these networks were summarized in Table 1. We used DSC, intersection over union (IOU) (Eq. (2)), Matthew's correlation coefficient (MCC) (Eq. (3)) [41], and balanced accuracy (BAC) (Eq. (4)) [28] as the performance metrics. These metrics range from 0 to 1, and a larger value means a better segmentation performance.
| (2) |
| (3) |
| (4) |
| (5) |
| (6) |
where Tp, Tn, Fp, and Fn denote true positive, true negative, false positive and false negative, respectively. Se and Sp are the sensitivity and specificity for a segmentation method. They indicate the effectiveness in identifying the disc and background pixels, respectively. Since the optic disc only occupies a very small area in color fundus images, this makes the Sp and BAC very large in most cases. Hence, the DSC, IOU and MCC are used to indicate the overall segmentation performance. In addition, we assessed the effect of the CCS sub-network on the segmentation performance by testing the developed models with or without CCS on global field-of-view images. To statistically assess the performance differences of these segmentation methods, the paired t-test was performed. A p-value less than 0.05 was considered statistically significant.
Table 1.
The differences of the U-Net, M-Net, Deeplabv3, and the proposed network. (‘#’ denotes the number of a given variable, ‘M’ is short for Million)
| Method | Layer # | up-sampling # | Parameter # |
|---|---|---|---|
| U-Net | 86 | 5 | 31.4667 M |
| M-Net | 48 | 4 | 8.5472 M |
| Deeplabv3 | 410 | 3 | 41.2530 M |
| The proposed | 111 | 5 | 20.7984 M |
3. Experimental results
3.1. Segmentation based on the global field-of-view images
We comparatively assessed the segmentation performance of the developed network with different optimization algorithms, including Adam, AMSGrad, and the stochastic gradient descent (SGD) [20], and activation functions, including ReLU and Leaky ReLU (LReLU) [42]. In the Adam optimization algorithm, the parameters β1 and β2 were set to 0.9 and 0.999, respectively; in the SGD, the momentum was set to 0.9, and the Nesterov momentum was enabled. The initial learning rates of these two optimizations were set to 1.0e-3. In the LReLU activation function, the scalar parameter was set to 0.00, 0.01, 0.05, 0.10, 0.15, and 0.20, respectively for the independent testing set of the MESSIDOR dataset. The segmentation results (Table 2) demonstrated that the developed CNN model had the highest accuracy in terms of DSC, IOU, and MCC when using the AMSGrad optimization algorithm and the ReLU activation function.
Table 2.
The performance of the developed network with different optimization algorithms (i.e., Adam, AMSGrad, and SGD) and activation functions (i.e., ReLU and LReLU) on the testing sub-group of the MESSIDOR dataset using the average DSC, IOU, and MCC metrics.
| Optimization | Metric | ReLU | LReLU | |||||
|---|---|---|---|---|---|---|---|---|
| 0.00 | 0.01 | 0.05 | 0.10 | 0.15 | 0.20 | |||
| Adam | DSC | 0.9600 | 0.9621 | 0.9611 | 0.9626 | 0.9609 | 0.9604 | 0.9601 |
| IOU | 0.9241 | 0.9279 | 0.9262 | 0.9290 | 0.9259 | 0.9249 | 0.9243 | |
| MCC | 0.9602 | 0.9620 | 0.9613 | 0.9627 | 0.9611 | 0.9606 | 0.9600 | |
| AMSGrad | DSC | 0.9646 | 0.9617 | 0.9618 | 0.9622 | 0.9641 | 0.9605 | 0.9602 |
| IOU | 0.9326 | 0.9274 | 0.9277 | 0.9282 | 0.9315 | 0.9252 | 0.9246 | |
| MCC | 0.9646 | 0.9617 | 0.9619 | 0.9622 | 0.9640 | 0.9606 | 0.9603 | |
| SGD | DSC | 0.9450 | 0.9385 | 0.9419 | 0.9442 | 0.9415 | 0.9408 | 0.9405 |
| IOU | 0.8982 | 0.8876 | 0.8938 | 0.8976 | 0.8919 | 0.8911 | 0.8904 | |
| MCC | 0.9456 | 0.9393 | 0.9427 | 0.9449 | 0.9421 | 0.9414 | 0.9411 | |
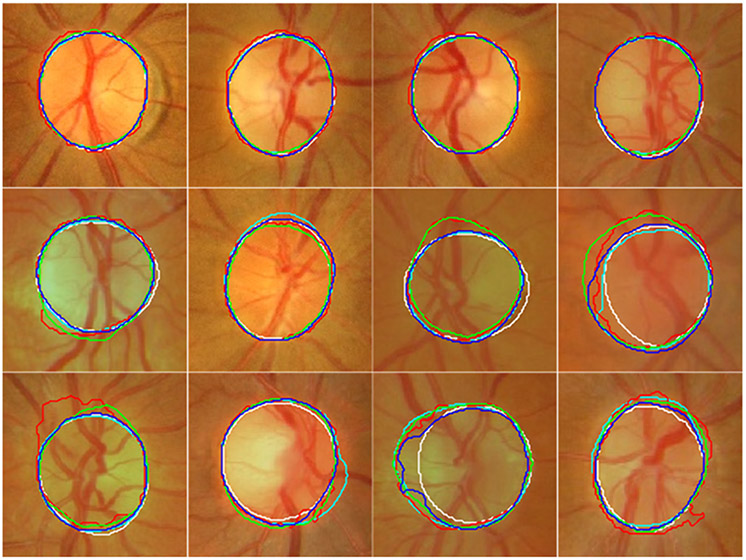
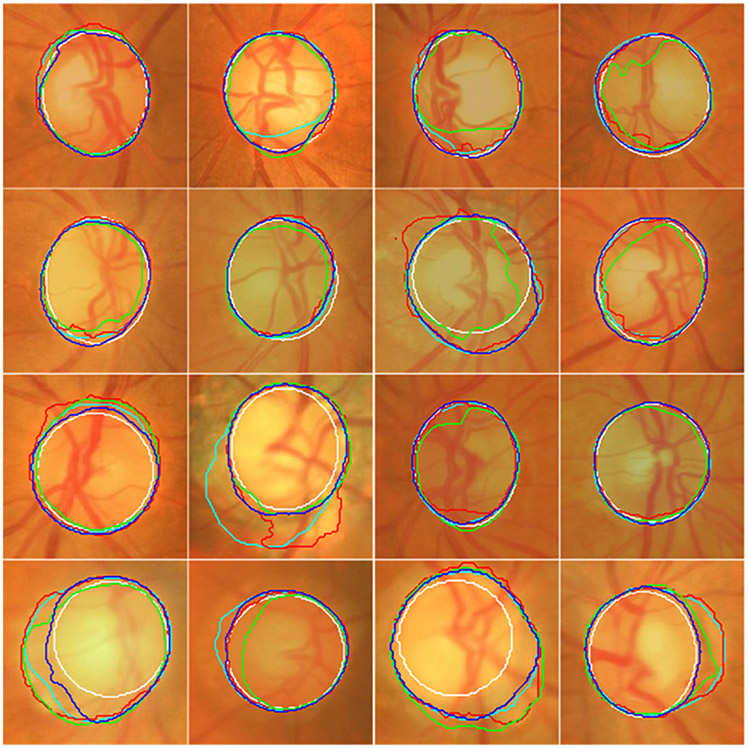
We summarized the performance of the developed network and three classical networks (i.e., the U-Net, M-Net, and Deeplabv3) on the testing sub-group of the MESSIDOR dataset (n=120 images) and the ORIGA (n=650 images) and REFUGE datasets (n=1,200 images) in Tables 3 and 4. The developed model achieved performance with a mean DSC, IOU, and MCC of 0.9377, 0.8854, and 0.9383, respectively for the entire test images. It significantly outperformed the U-Net (0.9316, 0.8753, and 0.9325), M-Net (0.9078, 0.8409, and 0.9105), and Deeplabv3 (0.9289, 0.8733, and 0.9299) on the same test images (Tables 3 and 4). Figs. 6 and 7 showed some segmentation examples to visually demonstrate the performance differences of the developed model and three other models.
Table 3.
The performance of the developed network and three classical networks on the testing sub-group of the MESSIDOR dataset and the whole ORIGA and REFUGE datasets using the mean and standard deviation (SD) of DSC, IOU, BAC, MCC, and Se.
| Dataset | Method | DSC | IOU | BAC | MCC | Se |
|---|---|---|---|---|---|---|
| Mean±SD | Mean±SD | Mean±SD | Mean±SD | Mean±SD | ||
| MESSIDOR | U-Net | 0.9638±0.0271 | 0.9314±0.0470 | 0.9844±0.0137 | 0.9639±0.0259 | 0.9695±0.0278 |
| M-Net | 0.9463±0.0449 | 0.9011±0.0709 | 0.9804±0.0292 | 0.9468±0.0416 | 0.9619±0.0587 | |
| Deeplabv3 | 0.9557±0.0286 | 0.9165±0.0497 | 0.9815±0.0182 | 0.9558±0.0275 | 0.9639±0.0367 | |
| The proposed | 0.9646±0.0234 | 0.9326±0.0416 | 0.9870±0.0123 | 0.9646±0.0227 | 0.9748±0.0249 | |
| Dataset | Method | DSC | IOU | BAC | MCC | Se |
| Mean±SD | Mean±SD | Mean±SD | Mean±SD | Mean±SD | ||
| ORIGA | U-Net | 0.9374±0.0393 | 0.8845±0.0640 | 0.9953±0.0079 | 0.9386±0.0363 | 0.9925±0.0162 |
| M-Net | 0.9271±0.0558 | 0.8680±0.0762 | 0.9906±0.0235 | 0.9286±0.0523 | 0.9833±0.0473 | |
| Deeplabv3 | 0.9220±0.1145 | 0.8680±0.1232 | 0.9764±0.0635 | 0.9234±0.1100 | 0.9543±0.1274 | |
| The proposed | 0.9392±0.0355 | 0.8873±0.0589 | 0.9938±0.0131 | 0.9401±0.0333 | 0.9895±0.0264 | |
| Dataset | Method | DSC | IOU | BAC | MCC | Se |
| Mean±SD | Mean±SD | Mean±SD | Mean±SD | Mean±SD | ||
| REFUGE | U-Net | 0.9252±0.0516 | 0.8647±0.0812 | 0.9555±0.0291 | 0.9261±0.0494 | 0.9119±0.0585 |
| M-Net | 0.8935±0.1052 | 0.8203±0.1375 | 0.9650±0.0449 | 0.8970±0.0982 | 0.9325±0.0905 | |
| Deeplabv3 | 0.9300±0.0431 | 0.8719±0.0685 | 0.9621±0.0272 | 0.9308±0.0406 | 0.9251±0.0550 | |
| The proposed | 0.9342±0.0458 | 0.8796±0.0729 | 0.9627±0.0246 | 0.9347±0.0434 | 0.9262±0.0495 |
Table 4.
The p-values of the paired t-tests among the developed network and three classical networks on 1,970 global field-of-view images in terms of the DSC, IOU, and MCC. (‘−’ indicates invalid statistical analysis)
| Method | U-Net | M-Net | Deeplabv3 | ||||||
|---|---|---|---|---|---|---|---|---|---|
| DSC | IOU | MCC | DSC | IOU | MCC | DSC | IOU | MCC | |
| U-Net | - | - | - | ||||||
| M-Net | <0.0001 | <0.0001 | <0.0001 | - | - | - | |||
| Deeplabv3 | 0.0918 | 0.2852 | 0.0836 | <0.0001 | <0.0001 | <0.0001 | - | - | - |
| The proposed | <0.0001 | <0.0001 | <0.0001 | <0.0001 | <0.0001 | <0.0001 | <0.0001 | <0.0001 | <0.0001 |
Fig. 6.
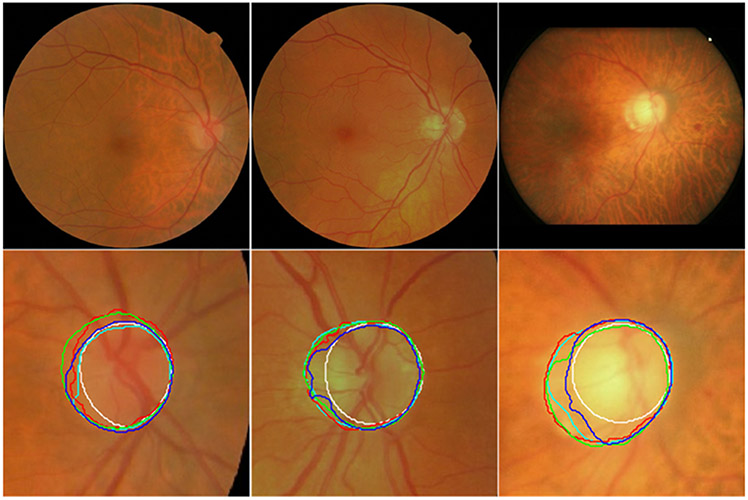
Illustration of the segmentation results of the U-Net (in cyan), M-Net (in red), Deeplabv3 (in green), and the developed model (in blue) on twelve fundus images from the testing sub-group of the MESSIDOR dataset as well as their ground truth (manual delineations) (in white).
Fig. 7.
Illustration of the segmentation results of the U-Net (in cyan), M-Net (in red), Deeplabv3 (in green), and the developed model (in blue) on sixteen images from the ORGIA dataset as well as their ground truth (manual delineations) (in white).
3.2. Segmentation based on the local disc region images
Table 5 presented the segmentation performance of the developed network in different training settings (i.e., three optimization algorithms and two activation functions) on the local disc region images. Among the three optimization algorithms, Adam and AMSGrad had the initial learning rate of 1.0e-4 without changing other configurations compared to those in the global field-of-view segmentation. As demonstrated by the results, the developed model achieved reasonable accuracy when using the AMSGrad optimization algorithm and the ReLU activation function and was superior to the other training settings for the same test images in terms of DSC, IOU, and MCC.
Table 5.
The performance of the developed network with different optimization algorithms (i.e., Adam, AMSGrad, and SGD) and activation functions (i.e., ReLU and LReLU) on the testing sub-group of the MESSIDOR dataset using the average DSC, IOU, and MCC metrics.
| Optimization | Metric | ReLU | LReLU | |||||
|---|---|---|---|---|---|---|---|---|
| 0.00 | 0.01 | 0.05 | 0.10 | 0.15 | 0.20 | |||
| Adam | DSC | 0.9838 | 0.9837 | 0.9844 | 0.9840 | 0.9839 | 0.9840 | 0.9841 |
| IOU | 0.9683 | 0.9682 | 0.9694 | 0.9686 | 0.9685 | 0.9687 | 0.9689 | |
| MCC | 0.9750 | 0.9749 | 0.9759 | 0.9753 | 0.9752 | 0.9753 | 0.9755 | |
| AMSGrad | DSC | 0.9843 | 0.9840 | 0.9838 | 0.9838 | 0.9837 | 0.9840 | 0.9836 |
| IOU | 0.9693 | 0.9687 | 0.9683 | 0.9683 | 0.9681 | 0.9686 | 0.9679 | |
| MCC | 0.9758 | 0.9753 | 0.9750 | 0.9750 | 0.9748 | 0.9753 | 0.9747 | |
| SGD | DSC | 0.9787 | 0.9779 | 0.9785 | 0.9770 | 0.9787 | 0.9777 | 0.9776 |
| IOU | 0.9585 | 0.9569 | 0.9581 | 0.9551 | 0.9584 | 0.9566 | 0.9564 | |
| MCC | 0.9671 | 0.9659 | 0.9669 | 0.9645 | 0.9671 | 0.9657 | 0.9654 | |
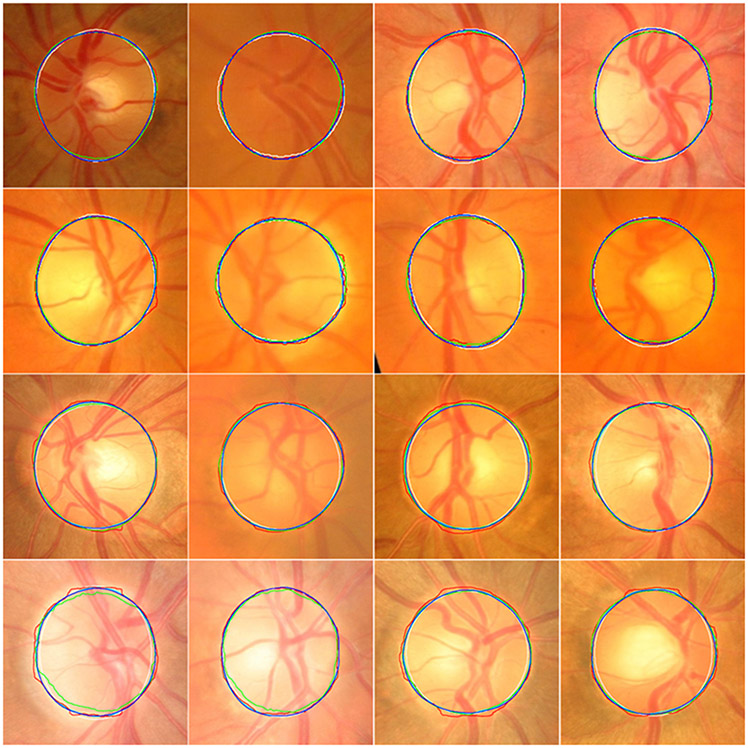
Tables 6 and 7 show the segmentation performance of the developed network and the aforementioned three classical networks on the local disc region images. It can be seen that these networks had high segmentation accuracy comparable to manual annotations; however, their performance differences were limited. Specifically, the developed model achieved the average DSC, IOU, and MCC of 0.9735, 0.9494, and 0.9594, respectively for a total of 1,970 test regions, and was superior to the U-Net (0.9730, 0.9485, and 0.9586), M-Net (0.9594, 0.9230, and 0.9386), and Deeplabv3 (0.9571, 0.9200, and 0.9359) models. Among the four CNN models, the M-Net and Deeplabv3 had relatively low segmentation results for the same testing datasets. Some segmentation examples from the MESSIDOR and ORIGA datasets are shown in Fig. 8 for a straightforward visual comparison.
Table 6.
The performance of the developed network and three classical networks on the testing sub-group of the MESSIDOR dataset and the ORIGA and REFUGE datasets using the mean and standard deviation (SD) of DSC, IOU, BAC, MCC, and Se.
| Dataset | Method | DSC | IOU | BAC | MCC | Se |
|---|---|---|---|---|---|---|
| Mean±SD | Mean±SD | Mean±SD | Mean±SD | Mean±SD | ||
| MESSIDOR | U-Net | 0.9839±0.0094 | 0.9686±0.0177 | 0.9874±0.0075 | 0.9752±0.0144 | 0.9829±0.0109 |
| M-Net | 0.9796±0.0096 | 0.9602±0.0181 | 0.9837±0.0078 | 0.9686±0.0148 | 0.9773±0.0133 | |
| Deeplabv3 | 0.9794±0.0105 | 0.9599±0.0198 | 0.9837±0.0083 | 0.9683±0.0162 | 0.9776±0.0117 | |
| The proposed | 0.9843±0.0095 | 0.9693±0.0179 | 0.9876±0.0076 | 0.9758±0.0147 | 0.9831±0.0109 | |
| Dataset | Method | DSC | IOU | BAC | MCC | Se |
| Mean±SD | Mean±SD | Mean±SD | Mean±SD | Mean±SD | ||
| ORIGA | U-Net | 0.9778±0.0075 | 0.9567±0.0141 | 0.9867±0.0056 | 0.9663±0.0114 | 0.9936±0.0072 |
| M-Net | 0.9663±0.0121 | 0.9351±0.0219 | 0.9808±0.0073 | 0.9491±0.0181 | 0.9953±0.0068 | |
| Deeplabv3 | 0.9733±0.0137 | 0.9483±0.0247 | 0.9830±0.0118 | 0.9595±0.0201 | 0.9876±0.0223 | |
| The proposed | 0.9797±0.0079 | 0.9604±0.0148 | 0.9869±0.0060 | 0.9692±0.0120 | 0.9899±0.0084 | |
| Dataset | Method | DSC | IOU | BAC | MCC | Se |
| Mean±SD | Mean±SD | Mean±SD | Mean±SD | Mean±SD | ||
| REFUGE | U-Net | 0.9693±0.0333 | 0.9421±0.0548 | 0.9759±0.0257 | 0.9527±0.0512 | 0.9673±0.0340 |
| M-Net | 0.9536±0.0295 | 0.9127±0.0488 | 0.9610±0.0224 | 0.9298±0.0449 | 0.9377±0.0324 | |
| Deeplabv3 | 0.9461±0.0438 | 0.9007±0.0721 | 0.9540±0.0350 | 0.9198±0.0649 | 0.9222±0.0560 | |
| The proposed | 0.9692±0.0325 | 0.9418±0.0533 | 0.9753±0.0252 | 0.9526±0.0499 | 0.9651±0.0339 |
Table 7.
The p-values of the paired t-tests among the developed network and three classical networks on 1,970 local disc regions in terms of the DSC, IOU, and MCC. (‘−’ indicates invalid statistical analysis)
| Method | U-Net | M-Net | Deeplabv3 | ||||||
|---|---|---|---|---|---|---|---|---|---|
| DSC | IOU | MCC | DSC | IOU | MCC | DSC | IOU | MCC | |
| U-Net | - | - | - | ||||||
| M-Net | <0.0001 | <0.0001 | <0.0001 | - | - | - | |||
| Deeplabv3 | <0.0001 | <0.0001 | <0.0001 | <0.0001 | 0.0006 | 0.0003 | - | - | - |
| The proposed | <0.0001 | <0.0001 | <0.0001 | <0.0001 | <0.0001 | <0.0001 | <0.0001 | <0.0001 | <0.0001 |
Fig. 8.
Segmentation results of the local disc regions from the MESSIDOR (in the first two rows) and ORGIA (in the last two rows) datasets using four different models. The disc boundaries were obtained by the U-Net (in cyan), M-Net (in red), Deeplabv3 (in green), and the developed model (in blue) as well as manual annotations (in white), respectively.
4. Discussion
We developed and validated a novel deep learning network to accurately segment the OD regions depicted on color fundus images. Due to the introduction of a sub-network and a decoding convolutional block, this network demonstrated more sensitivity to edge information than other available models, which can capture the structural details that may be smeared out by multiple down-sampling operations. We quantitatively evaluated the performance of the developed network and compared it with three typical segmentation networks on a total of 1,970 color fundus images from the MESSIDOR, ORIGA, and REFUGE datasets. The experimental results demonstrated the unique advantage of the developed model in segmenting the OD regions.
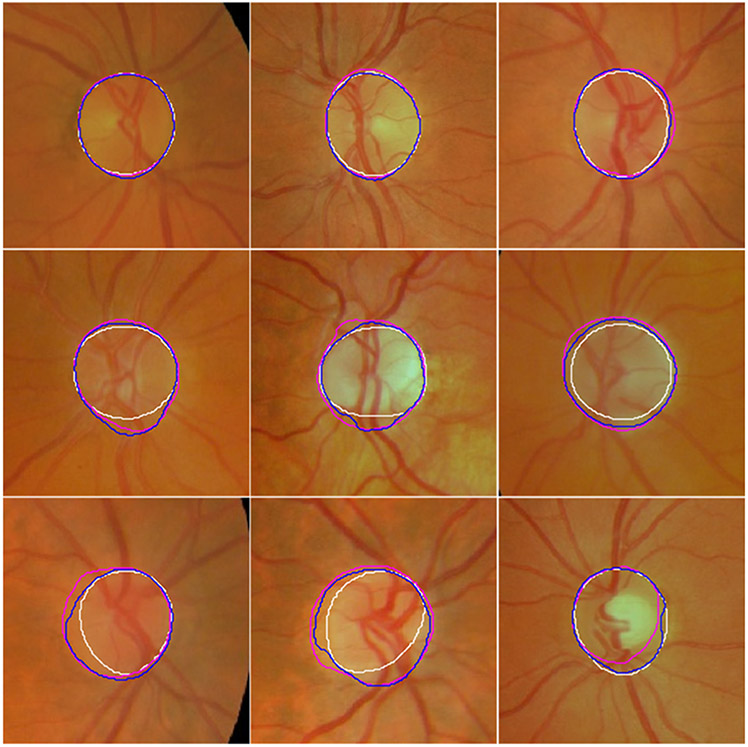
In the developed model, the CCS sub-network and the element-wise subtraction in the decoding blocks played important roles in accurately segmenting the OD regions from fundus images. Table 8 demonstrated that the developed model achieved performance with the average DSC, IOU, and MCC of 0.9377, 0.8854, and 0.9383, respectively, in the presence of the CCS sub-network for a total of 1,970 global field-of-view images, and of 0.9268, 0.8717, and 0.9282 without the CCS sub-network for the same images. The developed model with the CCS had the potential to handle the problems caused by weak contrast or varying illumination, as shown in Fig 9. Table 9 summarized the performance of the developed model with different element-wise operations (i.e., addition, multiply, and subtraction) on both the global field-of-view images and their local disc versions from the MESSIDOR dataset. This suggests that the introduction of the CCS sub-network and the element-wise subtraction improved the performance of the developed model, which has much less convolutional parameters, as compared with the U-Net (Table 1). Their integration made our model computationally efficient and sensitive to the morphological changes of target objects in the feature maps with the same image dimension (similar to the effect described in Fig. 4).
Table 8.
The performance of the developed network with or without the CCS sub-network on a total of 1,970 global field-of-view images from the MESSIDOR, ORIGIA, and REFUGE datasets using the mean and standard deviation (SD) of DSC, IOU, BAC, MCC, and Se.
| Dataset | Method | DSC | IOU | BAC | MCC | Se |
|---|---|---|---|---|---|---|
| Mean±SD | Mean±SD | Mean±SD | Mean±SD | Mean±SD | ||
| MESSIDOR | with | 0.9646±0.0234 | 0.9326±0.0416 | 0.9870±0.0123 | 0.9646±0.0227 | 0.9748±0.0249 |
| Without | 0.9592±0.0320 | 0.9233±0.0548 | 0.9868±0.0143 | 0.9594±0.0304 | 0.9745±0.0289 | |
| Dataset | Method | DSC | IOU | BAC | MCC | Se |
| Mean±SD | Mean±SD | Mean±SD | Mean±SD | Mean±SD | ||
| ORIGA | with | 0.9392±0.0355 | 0.8873±0.0589 | 0.9938±0.0131 | 0.9401±0.0333 | 0.9895±0.0264 |
| Without | 0.9144±0.1044 | 0.8530±0.1140 | 0.9883±0.0583 | 0.9169±0.0980 | 0.9789±0.1169 | |
| Dataset | Method | DSC | IOU | BAC | MCC | Se |
| Mean±SD | Mean±SD | Mean±SD | Mean±SD | Mean±SD | ||
| REFUGE | with | 0.9342±0.0458 | 0.8796±0.0729 | 0.9627±0.0246 | 0.9347±0.0434 | 0.9262±0.0495 |
| Without | 0.9304±0.0777 | 0.8767±0.0981 | 0.9647±0.0419 | 0.9313±0.0748 | 0.9305±0.0842 |
Fig. 9.
Illustration of the segmentation results of the developed model with (in blue) or without (in magenta) the CCS sub-network on nine global field-of-view images from the MESSIDOR dataset as well as their ground truths (manual annotations) (in white). Only the disc regions were displayed for visual comparison purposes.
Table 9.
The performance of the developed network with different element-wise operations on the global field-of-view images and their local disc versions from the MESSIDOR dataset using the mean and standard deviation (SD) of DSC, IOU, BAC, MCC, and Se. (Note that there are different training schemes for global and local datasets.)
| Dataset | Method | DSC | IOU | BAC | MCC | Se |
|---|---|---|---|---|---|---|
| Mean±SD | Mean±SD | Mean±SD | Mean±SD | Mean±SD | ||
| Global | Addition | 0.9626±0.0264 | 0.9290±0.0458 | 0.9871±0.0120 | 0.9626±0.0253 | 0.9749±0.0244 |
| Multiply | 0.9622±0.0232 | 0.9280±0.0408 | 0.9858±0.0123 | 0.9621±0.0225 | 0.9724±0.0248 | |
| Subtraction | 0.9646±0.0234 | 0.9326±0.0416 | 0.9870±0.0123 | 0.9646±0.0227 | 0.9748±0.0249 | |
| Dataset | Method | DSC | IOU | BAC | MCC | Se |
| Mean±SD | Mean±SD | Mean±SD | Mean±SD | Mean±SD | ||
| Local | Addition | 0.9839±0.0092 | 0.9685±0.0173 | 0.9876±0.0073 | 0.9751±0.0142 | 0.9839±0.0103 |
| Multiply | 0.9838±0.0097 | 0.9683±0.0184 | 0.9872±0.0077 | 0.9750±0.0150 | 0.9823±0.0111 | |
| Subtraction | 0.9843±0.0095 | 0.9693±0.0179 | 0.9876±0.0076 | 0.9758±0.0147 | 0.9831±0.0109 |
The developed model demonstrated better performance as compared with three classical segmentation models (i.e., the U-Net, M-Net, and Deeplabv3) based on both the global and local images from the MESSIDOR, ORIGA, and REFUGE datasets (Tables 3 and 6). We also summarized the segmentation performance of our developed method and other available methods in Table 10. As compared with our method, most of these methods in Table 10 were evaluated on a relatively small number of datasets formed by local disc region images. From these results, it can be seen that our developed method demonstrated a consistent and relatively higher performance for segmenting OD regions, given the size and diversity of our testing datasets as well as the small training dimension. Notably, the optic disc only occupies a very small area in a color fundus image. Consequently, the image background has a very high weight in the BAC metric, thus making this metric relatively large for different types of segmentation methods. Additionally, the U-Net had a different performance on local disc regions, in spite of the same training dimension (e.g., 256×256), because these disc regions were cropped from the global field-of-view images using different sizes, relative to the radius of the OD.
Table 10.
Performance comparison of the developed method with some available methods for the disc segmentation based on the DSC, BAC, and Se metrics. ‘Num’ and ‘Size’ indicate the number of images and their training size, respectively, ‘−’ denotes unavailable metrics in related literature.
| Method | DSC | BAC | Se | Num | size | Domain | Datasets |
|---|---|---|---|---|---|---|---|
| Feng [43] | - | 0.9634 | 0.9312 | 55 | 256×256 | - | DRIONS-DB |
| Yin [4] | 0.92 | 0.9184 | 0.8542 | 325 | - | local | ORIGA |
| Lim [44] | 0.9406 | - | 0.8742 | 359 | 157×157 | local | MESSIDOR, SEED-DB DRIVE, DIARETDB1, |
| Abdullah [6] | 0.9273 | 0.9926 | 0.8860 | 1,467 | - | local | CHASE-DB1, MESSIDOR, DRIONS-DB, |
| Morales [13] | 0.8774 | 0.9921 | 0.854 | 110 | - | local | DRIONS |
| DRIU [24] | 0.9361 | 0.9612 | 0.9252 | 110 | 565×584 | local | DRIONS-DB, RIM-ONE-r3 |
| M-Net [27] | 0.9632 | 0.983 | - | 325 | 400×400 | local | ORIGA |
| AG-Net [34] | 0.9685 | - | - | 325 | 640×640 | local | ORIGA |
| U-Net [28] | 0.939 | 0.970 | 0.944 | 2,978 | 256×256 | local | DIARETDB0, DRIE, CFI, DIARETDB1, DRIONS-DB, MESSIDOR, ORIGA |
| U-Net | 0.9316 | 0.9704 | 0.9420 | 1,970 | 256×256 | global | MESSIDOR, ORIGA, REFUGE |
| U-Net | 0.9730 | 0.9802 | 0.9769 | 1,970 | 256×256 | local | MESSIDOR, ORIGA, REFUGE |
| M-Net | 0.9078 | 0.9744 | 0.9511 | 1,970 | 256×256 | global | MESSIDOR, ORIGA, REFUGE |
| M-Net | 0.9594 | 0.9689 | 0.9591 | 1,970 | 256×256 | local | MESSIDOR, ORIGA, REFUGE |
| Deeplabv3 | 0.9289 | 0.9680 | 0.9371 | 1,970 | 256×256 | global | MESSIDOR, ORIGA, REFUGE |
| Deeplabv3 | 0.9571 | 0.9654 | 0.9472 | 1,970 | 256×256 | local | MESSIDOR, ORIGA, REFUGE |
| The proposed | 0.9377 | 0.9744 | 0.9501 | 1,970 | 256×256 | global | MESSIDOR, ORIGA, REFUGE |
| The proposed | 0.9735 | 0.9799 | 0.9744 | 1,970 | 256×256 | local | MESSIDOR, ORIGA, REFUGE |
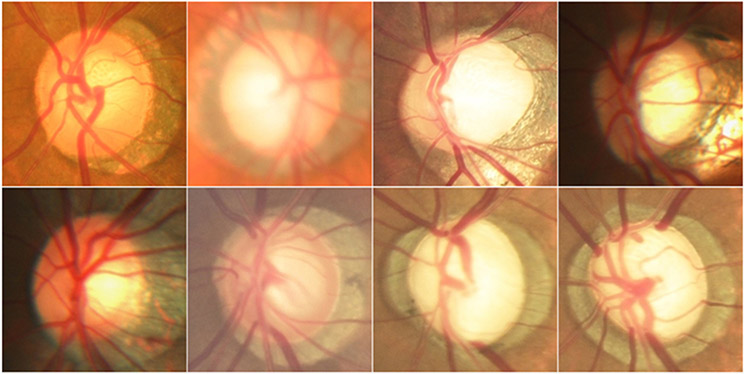
Finally, we are aware of some limitations in this study. First, the developed model tends to include certain background or pathological regions that had a similar appearance as the OD, as illustrated by Fig. 10. This is primarily caused by the sensitivity of the developed method to the object boundaries. Second, we conducted the segmentation experiments on images with a relatively small dimension (i.e., 256×256 pixels) due to the memory limit of the graphics process unit (GPU). This dimension may prevent the detection of certain texture information associated with the OD and its boundary regions and limit the amount of the convolutional features during the training. Third, local disc regions were manually cropped from the global field-of-view images with very small dimensions, relative to the diameter of the OD. In this way, the OD was typically located in the center of the cropped regions, and only a small amount of irrelevant background was retained and significantly magnified (Fig. 11). The background is very close to the OD and generally associated with pathological abnormalities caused by glaucoma, DR, or myopia. It may make the developed model tend to identify incorrect target boundaries. Despite these limitations, our developed method demonstrated an exciting performance in segmenting the OD regions on color fundus images.
Fig. 10.
From left to right columns showed a given fundus image from the MESSIDOR dataset, and its segmentation results obtained by the U-Net (in cyan), M-Net (in red), Deeplabv3 (in green), our developed model (in blue), and manual annotation (in white), respectively. These results were easily affected by pathological regions close to the OD.
Fig. 11.
Illustration of some local disc regions manually cropped from their global field-of-view images. In the disc regions, only a small portion of the background surrounding the OD is retained and generally associated with various pathological abnormalities caused by DR, myopia, or glaucoma.
5. Conclusion
In this study, we introduced an asymmetric segmentation network based on the U-Net model to accurately segment the OD regions from retinal fundus images. Its novelty lies in the integration of a unique cross-connection sub-network and a decoding convolutional block with the classical U-Net architecture. The integration makes the developed network able to reduce the loss of important image information and improve its sensitivity to the morphological changes of the regions-of-interest. Our segmentation experiments on 1,970 color fundus images demonstrated the relatively high performance of the developed network, as compared with other classical CNN models, including the U-Net, M-Net, and Deeplabv3. The developed CNN model has a smaller number of parameters and a better capability to alleviate the problems caused by improper light exposure and tissue abnormality close to the disc regions due to the use of the element-wise subtraction operations. The operations are very useful to locate object boundaries and exclude irrelevant optic disc pallor. We also discussed its limitations. In the future, we will test the generic characteristic of the developed CNN model by applying it to other completely different forms of medical images (e.g., computed tomography (CT) and Magnetic Resonance Imaging (MRI)).
Acknowledgments
This work is supported by National Natural Science Foundation of China (Grant No. 62006175), Key Laboratory of Computer Network and Information Integration (Southeast University), Ministry of Education (Grant No. K93-9-2020-03), and Wenzhou Science and Technology Bureau (Grant No. Y2020035).
References
- [1].Wang L, Liu H, Zhang J, Chen H, Pu J, Computerized assessment of glaucoma severity based on color fundus images, SPIE on Medical Imaging 2019: Biomedical Applications in Molecular, Structural, and Functional Imaging, 2019. [Google Scholar]
- [2].Almazroa A, Burman R, Raahemifar K, Lakshminarayanan V, Optic Disc and Optic Cup Segmentation Methodologies for Glaucoma Image Detection: A Survey, Journal of Ophthalmology, 2015. (2015) 1–28 [DOI] [PMC free article] [PubMed] [Google Scholar]
- [3].Wang L, Liu H, Zhang J, Chen H, Pu J, Automated segmentation of the optic disc using the deep learning, SPIE on Medical Imaging 2019: Image Processing, 2019. [Google Scholar]
- [4].Yin F, Liu J, Wong D, Tan N, Cheung C, Baskaran M, Aung T, Wong T, Automated segmentation of optic disc and optic cup in fundus images for glaucoma diagnosis. 25th International Symposium on Computer-Based Medical Systems (CBMS), 1–6, 2012 [Google Scholar]
- [5].Roychowdhury S, Koozekanani D, Kuchinka S, Parhi K, Optic Disc Boundary and Vessel Origin Segmentation of Fundus Images. IEEE Journal of Biomedical and Health Informatics, 20(6), 1562–1574, 2016. [DOI] [PubMed] [Google Scholar]
- [6].Abdullah M, Fraz M, Barman S, Localization and segmentation of optic disc in retinal images using circular Hough transform and grow-cut algorithm. Peerj, 4(3), e2003, 2016. [DOI] [PMC free article] [PubMed] [Google Scholar]
- [7].Intaramanee T, Rasmequan S, Chinnasarn K, Jantarakongkul B, Rodtook A, Optic disc detection via blood vessels origin using Morphological end point. International Conference on Advanced Informatics: Concepts, 2016 [Google Scholar]
- [8].Wang X, Jiang X, Ren J, Blood vessel segmentation from fundus image by a cascade classification framework, Pattern Recognition, 88, 331–341, 2019. [Google Scholar]
- [9].Zhao H, Li H, Cheng L, Improving retinal vessel segmentation with joint local loss by matting, Pattern Recognition, 98, 107068, 2020. [Google Scholar]
- [10].Chen B, Wang L, Wang X, Sun J, Huang Y, Feng D, Xu Z, Abnormality detection in retinal image by individualized background learning, Pattern Recognition, 102, 107209, 2020. [Google Scholar]
- [11].Zhen Y, Gu S, Meng X, Zhang X, Wang N, Pu J, Automated identification of retinal vessels using a multiscale directional contrast quantification (MDCQ) strategy, Med Phys., 41(9), 092702, 2014 [DOI] [PMC free article] [PubMed] [Google Scholar]
- [12].Sinha N, Babu R, Optic disk localization using L1 minimization, Proceedings of the 19th IEEE International Conference on Image Processing (ICIP), 2829–2832, 2012 [Google Scholar]
- [13].Morales S, Naranjo V, Angulo J, Alcaniz M, Automatic detection of optic disc based on PCA and mathematical morphology, IEEE Transactions on Medical Imaging, 32, 786–796, 2013. [DOI] [PubMed] [Google Scholar]
- [14].Wang L, Chen G, Shi D, Chang Y, Chan S, Pu J, Yang X, Active contours driven by edge entropy fitting energy for image segmentation, Signal Processing, 149, 27–35, 2018. [DOI] [PMC free article] [PubMed] [Google Scholar]
- [15].Wang L, Zhang L, Yang X, Yi P, Chen H, Level set based segmentation using local fitted images and inhomogeneity entropy, Signal Processing 167, 107297, 2020. [Google Scholar]
- [16].Manju K, Sabeenian R, Surendar A, Burman R, Raahemifar K, Lakshminarayanan V, A Review on Optic Disc and Cup Segmentation, Biomedical and Pharmacology Journal 10(1) (2017) 373–379. [Google Scholar]
- [17].Welfer D, Scharcanski J, Kitamura C, Dal Pizzol M, Ludwig L, Marinho D, Segmentation of the optic disk in color eye fundus images using an adaptive morphological approach, Computers in Biology and Medicine, 40(2), 124–137, 2010 [DOI] [PubMed] [Google Scholar]
- [18].Septiarini A, Harjoko A, Pulungan R, Ekantini R, Optic disc and cup segmentation by automatic thresholding with morphological operation for glaucoma evaluation, Signal, Image and Video Processing, 11, 945–952, 2017. [Google Scholar]
- [19].Wang L, Huang Y, Lin B, Wu W, Chen H Pu J, Automatic Classification of Exudates in Color Fundus Images Using an Augmented Deep Learning Procedure, Proceedings of the Third International Symposium on Image Computing and Digital Medicine (ISICDM), 31–35, 2019 [Google Scholar]
- [20].Wang L, Zhang H, He K, Chang Y, Yang X, Active Contours Driven by Multi-Feature Gaussian Distribution Fitting Energy with Application to Vessel Segmentation, PLOS ONE, 10(11), e0143105, 2015. [DOI] [PMC free article] [PubMed] [Google Scholar]
- [21].Bian X, Luo X, Wang C, Liu W, Lin X, Optic disc and optic cup segmentation based on anatomy guided cascade network, Computer Methods and Programs in Biomedicine, 197, 105717, 2020. [DOI] [PubMed] [Google Scholar]
- [22].Kim G, Lee S, Kim S, A Novel Intensity Weighting Approach Using Convolutional Neural Network for Optic Disc Segmentation in Fundus Image, Journal of Imaging Science and Technology, 64(4), 40401-1–40401-9, 2020. [Google Scholar]
- [23].Litjens G, Kooi T, Bejnordi B, Setio A, Ciompi F, Ghafoorian M, Laak J, Ginneken B, Sanchez C, A survey on deep learning in medical image analysis, Medical Image Analysis 42, 60–68, 2017 [DOI] [PubMed] [Google Scholar]
- [24].Maninis K, Tuset J, Arbelaez P, Gool L, Deep retinal image understanding, Conference on Medical Image Computing and Computer Assisted Intervention (MICCAI), 140–148, 2016 [Google Scholar]
- [25].Ronneberger O, Fischer P, Brox T, U-Net: Convolutional Networks for Biomedical Image Segmentation, Conference on Medical Image Computing and Computer Assisted Intervention (MICCAI), 2015. [Google Scholar]
- [26].Mohan D, Kumar J, Seelamantula C, Optic Disc Segmentation Using Cascaded Multiresolution Convolutional Neural Networks, IEEE International Conference on Image Processing (ICIP), 2019. [Google Scholar]
- [27].Fu H, Cheng J, Xu Y, Wong D, Liu J, Cao X, Joint Optic Disc and Cup Segmentation Based on Multi-label Deep Network and Polar Transformation, IEEE Transactions on Medical Imaging, 37(7), 1597–1605, 2018 [DOI] [PubMed] [Google Scholar]
- [28].Wang L, Liu H, Lu Y, Chen H, Zhang J, Pu J, A coarse-to-fine deep learning framework for optic disc segmentation in fundus images, Biomedical Signal Processing and Control 51, 82–89, 2019 [DOI] [PMC free article] [PubMed] [Google Scholar]
- [29].Gu Z, Cheng J, Fu H, Zhou K, Hao H, Zhao Y, Zhang T, Gao S, Liu J, CE-Net: Context Encoder Network for 2D Medical Image Segmentation, IEEE Trans Med Imaging, 38(10), 2281–2292, 2019. [DOI] [PubMed] [Google Scholar]
- [30].Wang S, Yu L, Yang X, Fu C, Heng P, Patch-based Output Space Adversarial Learning for Joint Optic Disc and Cup Segmentation, IEEE Transactions on Medical Imaging, 38(11), 2485–2495, 2019 [DOI] [PubMed] [Google Scholar]
- [31].Wang S, Yu L, Li K, Yang X, Fu C, Heng P, Boundary and Entropy-Driven Adversarial Learning for Fundus Image Segmentation, International Conference on Medical Image Computing and Computer Assisted Intervention (MICCAI), Shenzhen, China, 2019 [Google Scholar]
- [32].Shankaranarayana S, Ram K, Mitra K, Sivaprakasam M, Joint Optic Disc and Cup Segmentation Using Fully Convolutional and Adversarial Networks, Fetal, Infant and Ophthalmic Medical Image Analysis, 168–176, 2017. [Google Scholar]
- [33].Zhou Z, Siddiquee M, Tajbakhsh N, Liang J, UNet++: A Nested U-Net Architecture for Medical Image Segmentation, Deep Learning in Medical Image Analysis and Multimodal Learning for Clinical Decision Support, Springer, 3–11, 2018. [DOI] [PMC free article] [PubMed] [Google Scholar]
- [34].Zhang S, Fu H, Yan Y, Zhang Y, Wu Q, Yang M, Tan M, Xu Y, Attention Guided Network for Retinal Image Segmentation, MICCAI; 2019, 797–805. [Google Scholar]
- [35].Goceri E, Challenges and Recent Solutions for Image Segmentation in the Era of Deep Learning, 2019 Ninth International Conference on Image Processing Theory, Tools and Applications (IPTA), Istanbul, Turkey, 2019. [Google Scholar]
- [36].Orlando J, Fu H, Breda J, Keer K, Bathula D, Pinto A, Fang R, Heng P, Kim J, Lee J, Lee J, Li X, Liu P, Lu S, Murugesan B, Naranjo V, Phaye S, Shankaranarayana S, Sikka A, Son J, Hengel A, Wang S, Wu J, Wu Z, Xu G, Xu Y, Yin P, Li F, Zhang X, Xu Y, Bogunovic H, REFUGE Challenge: A unified framework for evaluating automated methods for glaucoma assessment from fundus photographs, Medical Image Analysis, 59, 101570, 2020. [DOI] [PubMed] [Google Scholar]
- [37].Wang X, Huang D, Xu H, An efficient local Chan-vese model for image segmentation, Pattern Recognition, 43, 603–618, 2010. [Google Scholar]
- [38].Wang L, Zhu J, Sheng M, Cribb A, Zhu S, Pu J, Simultaneous segmentation and bias field estimation using local fitted images, Pattern Recognition, 74, 145–155, 2018. [DOI] [PMC free article] [PubMed] [Google Scholar]
- [39].Wang L, Chang Y, Wang H, Wu Z, Pu J, Yang X, An active contour model based on local fitted images for image segmentation, Information Sciences, 418, 61–73, 2017. [DOI] [PMC free article] [PubMed] [Google Scholar]
- [40].Reddi S, Kale S, Kumar S, On the convergence of adam and beyond, The 6th International Conference on Learning Representations (ICLR), Vancouver, Canada, 1–23, 2018. [Google Scholar]
- [41].Zhu Q, On the performance of Matthews correlation coefficient (MCC) for imbalanced dataset, Pattern Recognition Letters, 136, 71–80, 2020. [Google Scholar]
- [42].Goceri E, Diagnosis of Alzheimer's disease with Sobolev gradient-based optimization and 3D convolutional neural network, International Journal for Numerical Methods in Biomedical Engineering, 35(7), e3225, 2019. [DOI] [PubMed] [Google Scholar]
- [43].Feng Z, Yang J, Yao L, Qiao Y, Yu Q, Xu X, Deep Retinal Image Segmentation: A FCN-Based Architecture with Short and Long Skip Connections for Retinal Image Segmentation, International Conference on Neural Information Processing (ICONIP), 713–722, 2017 [Google Scholar]
- [44].Lim G, Cheng Y, Hsu W, Lee M, Integrated optic disc and cup segmentation with deep learning, 27th International Conference on Tools with Artificial Intelligence (ICTAI), 162–169, 2015. [Google Scholar]


