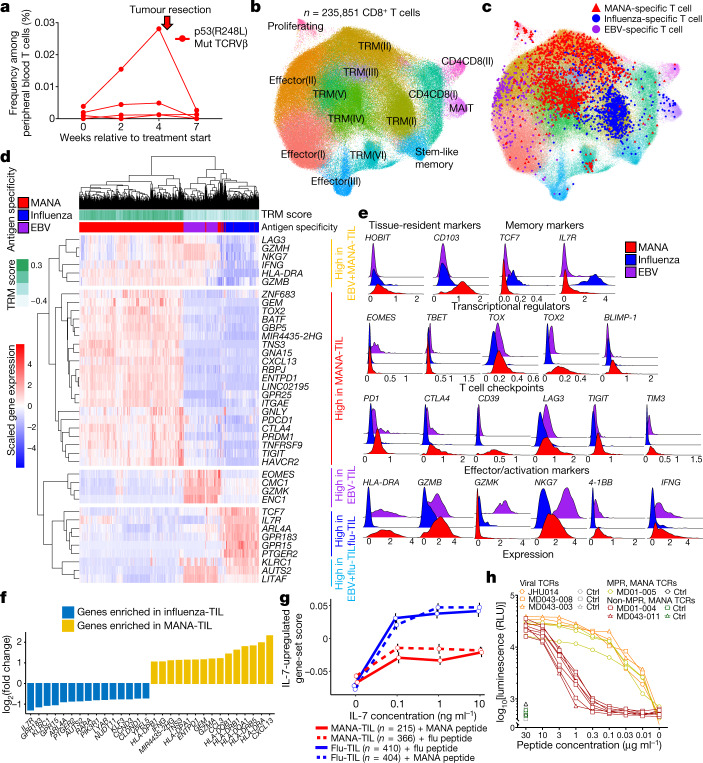
Fig. 2. Characterization of antigen-specific T cells in NSCLC treated with neoadjuvant PD-1 blockade.
The MANAFEST assay was performed on four patients with MPR and five patients without MPR. Results are shown in Extended Data Fig. 2 and Supplementary Data 5. a, Four TCRs recognizing p53(R248L)-derived MD01-004-MANA12 were identified in patient without MPR MD01-004. Their frequency was tracked in serial peripheral blood. Mut, mutant. b, Refined clustering was performed on 235,851 CD8+ T cells from tumour (n = 15), adjacent normal lung (n = 12), TDLN (n = 3) and one resected brain metastasis (MD043-011). Fourteen unique clusters were visualized and were using T cell gene programs described in previous studies16. Cluster-defining genes are shown in Extended Data Fig. 5a. c, MANA-specific (red), influenza-specific (blue) and EBV-specific (purple) clonotypes were visualized on the CD8 UMAP. d, Antigen-specific gene programs in the TIL were visualized as a heat map. Comparisons were performed at the individual cell level using a two-sided Wilcoxon rank-sum test with P-value adjustment using Bonferroni correction. e, Expression levels of key markers are shown. TBET is also known as TBX21; 4-1BB is also known as TNFRSF9. f, Transcriptional programs of influenza-specific and MANA-specific TIL were compared. The top-15 significantly upregulated genes in influenza -specific T cells (blue) and in MANA-specific T cells (yellow) are shown. g, TIL from MD01-004 were cultured with MD01-004-MANA-12 or influenza peptide and titrating concentrations of IL-7, followed by scRNA-seq–TCR-seq. In total, 814 influenza-specific TIL (410 co-cultured with influenza peptide and 404 co-cultured with MANA peptide) and 581 MANA-specific TIL (366 co-cultured with influenza peptide and 215 co-cultured with MANA peptide) were detected from a single experiment and were analysed. Composite expression of an IL-7 gene set by influenza-specific and MANA-specific TIL (as determined by their TCRVβ CDR3) was analysed. Dose–response curve of the IL-7-upregulated gene set-score is shown (mean ± s.e.m.). h, TCRs corresponding to seven MANA-specific clonotypes from two patients without MPR (red lines), three MANA-specific clonotypes from a patient with MPR (yellow lines), two influenza-specific TCRs, and one EBV-specific TCR (orange lines) were tested for ligand-dependent TCR-signalling capacity. Ctrl, control; RLU, relative luminescence units.

