

Summary
Endothelial cells (ECs) exhibit phenotypic and functional tissue specificities, critical for studies in the vascular field and beyond. Thus, tissue-specific methods for isolation of highly purified ECs are necessary. Kidney, spleen, and testis ECs are relevant players in health and diseases such as chronic kidney disease, acute kidney injury, myelofibrosis, and cancer. Here, we provide tailored protocols for rapid and reproducible EC purification established for scRNA sequencing from these adult murine tissues using the combination of magnetic- and fluorescence-activated cell sorting.
For complete details on the use and execution of these protocols, please refer to Kalucka et al. (2020) and Dumas et al. (2020).
Subject areas: Cell isolation, Single Cell, Flow Cytometry/Mass Cytometry
Graphical abstract
Highlights
-
•
Protocols for isolation of murine endothelial cells applicable for scRNA-seq
-
•
Efficient isolation of ECs from the kidney, spleen, and testis
-
•
Combination of magnetic- and fluorescence-activated cell sorting
-
•
High purity and quality of isolated murine endothelial cells evident from scRNA-seq
Endothelial cells (ECs) exhibit phenotypic and functional tissue specificities, critical for studies in the vascular field and beyond. Thus, tissue-specific methods for isolation of highly purified ECs are necessary. Kidney, spleen, and testis ECs are relevant players in health and diseases such as chronic kidney disease, acute kidney injury, myelofibrosis, and cancer. Here, we provide tailored protocols for rapid and reproducible EC purification established for scRNA sequencing from these adult murine tissues using the combination of magnetic- and fluorescence-activated cell sorting.
Before you begin
The protocols were established using 8- to 12-week-old C57BL6/J male mice purchased from Charles River (strain code: 632). All experimental procedures for the establishment and application of the protocols were done under approval by the Institutional Animal Ethics Committee of the KU Leuven (Belgium); protocol number P012/2018.
The protocols described below provide the details on EC isolation from one tissue at a time. However, it is possible to isolate cells from multiple organs of the same mouse. In that case, we recommend to perform transcardial perfusion with ice-cold PBS at a perfusion rate of 2 mL/minute for 5 min, followed by additional perfusion with digestion buffer: Supplemented KnockOutTM DMEM-medium with 0.1% (w/v) collagenase I (Thermo Fisher Scientific, Cat#17018029), 0.1% (w/v) collagenase II (Thermo Fisher Scientific, Cat#17101015) and 7.5 μg/mL DNase I (Sigma-Aldrich, Cat#D4527-10 KU) at a perfusion rate of 2 mL/minute for 5 min. The purpose of this step is to remove blood from the blood vessels and replace it with the digestion buffer to ensure efficient digestion. Additionally, if cells from multiple tissues are isolated simultaneously from the same mouse, we suggest to assign one person per single organ isolation.
The cells have been sorted using the BD FACSAria™ III sorter. Considering EC fragility, the following settings have been used: nozzle size - 100 μm, pressure - 20 psi. To maximize sorted EC purity and efficiency, we have been using the 4-way purity and sorting ECs on flow rate 1, respectively.
The optical paths used per fluorochrome:
-
1.
FITC - Laser: Blue 488; Detector 502 LP; Filter set up: 530/30 BP
-
2.
PE-Cy7 - Laser: Yellow-Green 561; Detector 735 LP; Filter set up: 780/60 BP
-
3.
eFluor450 - Laser: Violet 407; Filter set up: 450/40 BP
-
4.
PerCP-Cy5-5 - Laser: Blue 488; Detector: 655 LP; Filter set up: 695/40 BP
-
5.
APC (Alexa Fluor 647) - Laser: Red 633; Filter set up: 660/20 BP
The settings are designed as for EC sorting with the BD FACSAria™ III sorter and have to be optimized specifically to the sorter of choice.
Of note, the protocols are based on magnetic bead depletion of immune cells (CD45) and/or enrichment by magnetic bead for ECs (CD31) and fluorescent activated cell sorting. The listed dilution of antibodies might vary between lots and manufacturers/vendors. Therefore, we highly recommend optimizing these parameters for each antibody before its usage.
Key resources table
| REAGENT or RESOURCE | SOURCE | IDENTIFIER |
|---|---|---|
| Antibodies | ||
| Rat anti-mouse/human CD11b-PE (clone M1/70) | BioLegend | Cat#101208 RRID: AB_312791 |
| Rat anti-mouse CD31 FITC (clone 390) | Thermo Fisher Scientific | Cat#11-0311-82 RRID: AB_465012 |
| Rat anti-mouse CD45 PE-Cy7 (clone 30-F11) | Thermo Fisher Scientific | Cat#25-0451-82 RRID: AB_2734986 |
| Rat anti-mouse CD73 PerCP/Cyanine5.5 | BioLegend | Cat#127213 RRID: AB_11219608 |
| Rat anti-mouse ICAM-2 Alexa Fluor 647 | Thermo Fisher Scientific | Cat#A15452 RRID: AB_2534465 |
| Chemicals, peptides, and recombinant proteins | ||
| Antibiotic-Antimycotic | Thermo Fisher Scientific | Cat#15240062 |
| Bovine serum albumin (BSA Fraction V) | Sigma-Aldrich | Cat#10735086001 |
| Collagenase type I | Sigma-Aldrich | Cat#C9891 |
| Collagenase type II | Thermo Fisher Scientific | Cat#17101015 |
| Collagenase type IV | Worthington Biochemical | Cat#LS004188 |
| DNase I | Sigma-Aldrich | Cat#D4527-10KU |
| EDTA | Sigma-Aldrich | Cat#ED2P-500G |
| Endothelial cell growth factor supplements (ECGS/Heparin) | PromoCell | Cat#C-30120 |
| Fetal bovine serum (FBS) | Thermo Fisher Scientific | Cat#16000044 |
| Ficoll®-Paque Plus | GE Life Sciences | Cat#GE17-1440-02 |
| Fixable Viability Dye eFluor™ 450 | Thermo Fisher Scientific | Cat#65-0863-18 |
| Hank's balanced salt solution (HBSS) | Thermo Fisher Scientific | Cat#14025092 |
| Heparin Leo (heparin sodium); 25000 IU/5 mL | Leo Pharmaceuticals Ltd. | N/A |
| KnockOutTM DMEM | Thermo Fisher Scientific | Cat#10829018 |
| MEM NEAA | Thermo Fisher Scientific | Cat#11140035 |
| Penicillin/Streptomycin | Thermo Fisher Scientific | Cat#15140122 |
| Phosphate buffered saline (DPBS) | Thermo Fisher Scientific | Cat#14190094 |
| Sodium pyruvate | Thermo Fisher Scientific | Cat#11360070 |
| Trypsin-EDTA (0.25%), phenol red | Thermo Fisher Scientific | Cat#25200056 |
| Critical commercial assays | ||
| CD31 MicroBeads, mouse | Miltenyi Biotec | Cat#130-097-418 |
| CD45 MicroBeads, mouse | Miltenyi Biotec | Cat#130-052-301 |
| Deposited data | ||
| RNA-sequencing raw and analyzed data mouse EC (kidney, spleen, testis) | (Kalucka et al., 2020) | ArrayExpress: E-MTAB-8077 |
| RNA-sequencing raw and analyzed data mouse EC (glomeruli) | This paper | ArrayExpress: E-MTAB-10355 |
| Experimental models: organisms/strains | ||
| C57BL6/J male mice | Charles River | Strain code: 632 |
| Software and algorithms | ||
| BIOMEX | (Taverna et al., 2020) | https://www.vibcancer.be/software-tools/BIOMEX |
| Cell Ranger; version 2.2.0 | 10× Genomics | tenx, RRID:SCR_01695 |
| FindClusters (Seurat package; version 2.3.4) | (Satija et al., 2015) | (Seurat; RRID: SCR_016341) |
| flashpcaR; version 2.0 | (Abraham et al., 2017) | https://github.com/gabraham/flashpca/releases |
| FlowJo (version 8.8.6) | https://www.flowjo.com | (FlowJo, RRID: SCR_008520) |
| NormalizeData (Seurat package; version 2.3.4) | (Satija et al., 2015) | (Seurat; RRID: SCR_016341) |
| Rtsne package; version 0.15 | (van der Maaten and Hinton, 2008) | https://cran.r-project.org/web/packages/Rtsne/index.html |
| Seurat FindVariableGenes | (Satija et al., 2015) | (Seurat; RRID: SCR_016341) |
| Other | ||
| 40 μm Cell strainer | Sigma-Aldrich | Cat#CLS431750-50EA |
| 70 μm Cell strainer | Sigma-Aldrich | Cat#CLS431751-50EA |
| 100 μm Cell strainer | Sigma-Aldrich | Cat#CLS431752-50EA |
| BD FACSAria™ III sorter | BD Biosciences | N/A |
| Centrifuge tube, conical, HDPE CentriStar™, PP, 15 mL | VWR | Cat#734-1867 |
| Centrifuge tube, conical, HDPE CentriStar™, PP, 50 mL | VWR | Cat#734-1869 |
| LD columns | Miltenyi Biotec | Cat#130-042-901 |
| LS columns | Miltenyi Biotec | Cat#130-042-401 |
| MACS MultiStand | Miltenyi Biotec | Cat#130-042-303 |
| Multipurpose centrifuge and microcentrifuge | N/A | N/A |
| Perfusion pump: Perfusor® fm (MFC) | B. Braun Malaysia | N/A |
| Surgical Scalpel Blade No 10 | Swann-Morton | Cat#0201 |
| Syringe 1 mL (without needle) | HSW HENKE-JECT® | Cat#8300014579 |
| Syringe Pump Harvard Apparatus | Harvard Apparatus | Cat#PHD 22/2000 |
| QuadroMACS™ Separator | Miltenyi Biotec | Cat#130-091-051 |
Materials and equipment
Media and buffers
The following media/buffers are required.
CRITICAL: Protocols are tissue-specific, please read the instructions carefully before proceeding with the isolations.
-
•PBS-based Wash Buffer 1 (necessary for all tissues) containing:
-
o0.5% (w/v) BSA (BSA Fraction V, Sigma-Aldrich, Cat#10735086001)
-
o2 mM EDTA (Sigma-Aldrich, Cat#ED2P-500G) in PBS (Thermo Fisher Scientific, Cat#14190-094)
-
o
| Reagent | Final concentration | Amount |
|---|---|---|
| BSA | 0.5% | 2.5 g |
| EDTA | 2 mM | 0.2 mL (from 5 M pre-prepared stock solution, according to manufacturer's instructions) |
| PBS | - | 499.8 mL |
-
•PBS-based Wash Buffer 2 (necessary for all tissues) containing:
-
o0.5% (w/v) BSA (BSA Fraction V, Sigma-Aldrich, Cat#10735096001)
-
o
Note: Wash Buffer 1 and 2 can be prepared 1 day in advance and stored in a sterile manner for up to 3 days at 4°C.
-
•For digestion of spleen prepare Supplemented KnockOutTM DMEM-medium containing:
-
oKnockOutTM DMEM-medium (Thermo Fisher Scientific, Cat#10829018)
-
o1% (v/v) Penicillin/Streptomycin (Thermo Fisher Scientific, Cat#15140122)
-
o2× Antibiotic-Antimycotic (Thermo Fisher Scientific, Cat#15240062)
-
o1 mM Sodium Pyruvate (Thermo Fisher Scientific, Cat#11360070)
-
o1×MEM Non-Essential Amino Acids Solution (MEM-NEAA) (Thermo Fisher Scientific, Cat#11140035)
-
o1× Endothelial Cell Growth Factor supplements (ECGS/ Heparin) (PromoCell, Cat#C-30120)
-
o
| Reagent | Final concentration | Amount |
|---|---|---|
| KnockOutTM DMEM-medium | - | 473 mL |
| Penicillin/Streptomycin | 1% (v/v) | 5 mL |
| Antibiotic-Antimycotic | 2× | 10 mL |
| Sodium Pyruvate | 1 mM | 5 mL |
| MEM Non-Essential Amino Acids Solution | 1× | 5 mL |
| Endothelial Cell Growth Factor supplements (ECGS/ Heparin) | 1× | 2 mL (one vial) |
Please check specific protocols for additional details. Supplemented KnockOutTM DMEM-medium can be stored in a sterile manner at 4°C, up to 3 months. However, the digestion enzymes (Collagenases and DNase) have to be added freshly to the digestion medium shortly before the start of the isolation procedures.
ECGS/Heparin is added to the media to sustain EC viability. If there is any indication that the growth factors included in ECGS might affect isolated cells and alter the results according to the designed experiments, these can be left out.
Equipment
The following equipment was used for different protocols. Please check the protocols for specific instructions. For details about the equipment and alternatives, please check the section “equipment and reagent alternatives”.
-
•
MACS MultiStand (Miltenyi Biotec, Cat#130-042-303)
-
•
QuadroMACS™ Separator (Miltenyi Biotec, Cat#130-091-051)
-
•
Water bath adjusted to 37oC (see specific protocols for details)
-
•
Multipurpose- and Micro-centrifuge (see specific protocols for details)
-
•
BD FACSAria™ III sorter
-
•
Perfusion pump: Perfusor® fm (MFC) - B. Braun Malaysia or Harvard Apparatus PHD 22/2000
Equipment and reagent alternatives
-
•
MACS® Columns contain a matrix composed of superparamagnetic spheres, which are covered with a cell-friendly coating. When the column is placed in a MACS Separator, the spheres amplify the magnetic field by 10.000-fold. MS columns (Miltenyi Biotec, Cat#130-042-201) and LS columns (Miltenyi Biotec, Cat#130-042-401) are designed for positive selection and depletion of strongly magnetically labeled cells. The difference between them is the loading capacity of total and labeled cells (for MS column: labeled cells: up to 1×10⁷ and total cells: up to 2×10⁸. For LS column: labeled cells: up to 1×10⁸ and total cells: up to 2×10⁹). LD columns (Miltenyi Biotec, Cat#130-042-901) are designed for depletion of even weakly labeled cells. LS columns (Miltenyi Biotec, Cat#130-042-401) and LD columns (Miltenyi Biotec, Cat#130-042-901) can be used with the QuadroMACS™ Separator (Miltenyi Biotec, Cat#130-091-051) or the MidiMACS™ Separator (Miltenyi Biotec, Cat#130-042-302). We would like to acknowledge other alternatives of columns by Miltenyi Biotec, like AutoMACS (Miltenyi Biotec, Cat#130-021-101) column designed both for positive and negative selection. However, using other than the ones mentioned columns that mentioned in the protocols may require further optimization. Additionally, non-column based magnetic isolation methods are available (e.g., from STEMCELL Technologies) that could be optimized and used as alternatives for depletion and enrichment purposes.
-
•
The BD FACSAria™ III sorter was used to perform fluorescent activated sorting. However, any other sorter that allows the cells to be sorted at the required optical paths can be used. Please note that the settings of sorting are specific for the brand and model of the sorter and optimization of the procedure needs to be always performed.
-
•In the above protocols we suggest to use the following reagents:
-
oantibodies: CD31 (PECAM-1) Monoclonal Antibody (390), e.g., CD31-FITC (Thermo Fisher Scientific, Cat#11-0311-82; 1:300), CD45 Monoclonal Antibody (30-F11), e.g., CD45-PE-Cyanine7 (Thermo Fisher Scientific, Cat#25-0451-82; 1:700), CD11b Monoclonal Antibody (M1/70), e.g., CD11b-PE (BioLegend, Cat#101208) (1:500), CD73 Monoclonal Antibody (TY/11.8), e.g., CD73-PerCP-Cy5.5 (BioLegend, Cat#127213) (1:100), CD102 (ICAM-2) Monoclonal Antibody (3C4), e.g., CD102/ICAM-2-Alexa647 (Thermo Fisher Scientific, Cat#A15452) (1:300);
-
oViability Dye, e.g., eFluor 450 (Thermo Fisher Scientific, Cat#65-0863-18; 1:1000).
-
o
Different antibodies with similar properties (antigen and clone of the antibody), or with different clonality, conjugated with fluorochrome of choice can be used. Please note that staining efficiency depends on the clonality, fluorochrome, vendor and/or the LOT number of the antibody as well as on the sorter used for FACS. We recommend performing optimization of the staining panel.
-
•
A perfusion pump Perfusor® fm (MFC) - B. Braun Malaysia or Harvard Apparatus PHD 22/2000 was used to perform the transcardial perfusion; however, any other perfusion pump that allows the setting described in the protocols can be used.
-
•
Digestion efficiency may depend on the vendor and/or the LOT number of the enzymes used. We recommend to test all newly purchased reagents before performing final experiment.
-
•
Please note that, depending on the intended further use of the isolated ECs, working in a laminar flow hood and applying sterile lab-practice may be necessary. For example, if the cells will be used for cell culture purposes all the reagents for isolation should be kept and used in a sterile manner and we would recommend to perform the EC isolation under a laminar flow cabinet to avoid any external contamination. However, if sterility of the purified ECs is not necessary after the isolation (e.g., nucleic acid isolation, for sequencing, Western blotting, cell staining) the protocols can be performed outside the laminar flow cabinet.
Step-by-step method details
Kidney endothelial cell isolation
Timing: ∼6 h. For preparation of kidney and glomeruli digestion buffer, 45 min. For digestion of kidney tissue, 1 h 30 min. For gRECs, 1 h. For renal parenchyma ECs: Endothelial cell enrichment using CD31 murine MicroBeads, 45 min. For FACs, 1–2 h.
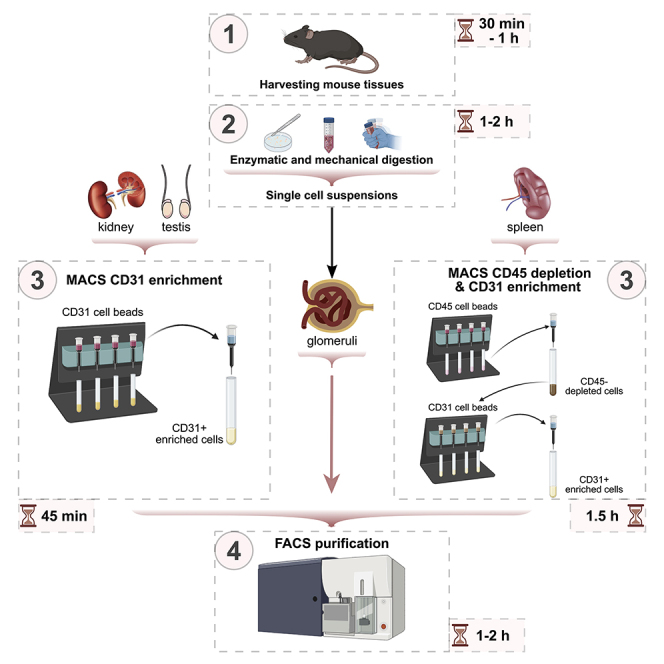
Figure 1A shows a detailed scheme of kidney EC isolation.
Figure 1.

EC isolation from mouse kidney and glomeruli
(A) Detailed scheme illustrating isolation of ECs from kidney.
(B and C) Representative FACS plots for gating strategy to sort ECs from kidney glomeruli (B) based on sorting live/CD45-/CD73-/CD102+ cells and from renal parenchyma (C) based on sorting live/CD45-/CD31+ cells.
The kidney EC isolation protocol is designed for separate isolation of glomerular ECs and renal parenchyma ECs (Dumas et al., 2020). The fraction of renal parenchyma ECs still contains some glomerular ECs (as shown in (Kalucka et al., 2020), Figures 4A and 4B) therefore if no pure population of glomerular EC is needed, steps #1b, #1d, #2i, #3, #5b, #5g are optional.
-
1.Preparation of kidney and glomeruli digestion buffer
-
a.Right before isolation, prepare kidney digestion buffer containing:
-
i.HBSS (Ca2+, Mg2+)
-
ii.0.2% (w/v) collagenase I (Sigma-Aldrich, Cat#C9891)
-
iii.7.5 μg/mL DNase I
Reagent Final concentration Amount HBSS (Ca2+, Mg2+) - 14.888 mL Collagenase I 0.2% (w/v) 30 mg DNase I 7.5 μg/mL 112,5 μL (from 1 mg/mL stock solution prepared according to manufacturer's instructions)
-
i.
-
b.Prepare fresh PBS-based glomeruli digestion buffer:Note: We recommend to prepare and pre-warm (at 37°C) glomeruli digestion buffer after step #3c.
-
i.80% (v/v) of Trypsin-EDTA 0.25% (final concentration of trypsin: 0.2%)
-
ii.20 IU/mL Heparin
-
iii.50 μg/mL DNase I
Reagent Final concentration Amount PBS - 146 μL Trypsin-EDTA 0.25% 0.2% 800 μL Heparin 20 IU/mL 4 μL DNase I 50 μg/mL 50 μL (from 1 mg/mL stock solution prepared according to manufacturer's instructions)
-
i.
-
c.Prepare PBS-based Wash Buffer 2.
-
d.Right before isolation prepare trypsin neutralization solution:
-
i.HBSS (containing Ca2+, Mg2+)
-
ii.10% (v/v) FBS
Reagent Final concentration Amount HBSS (containing Ca2+, Mg2+) - 1980 μL 10% (v/v) 10% (v/v) 20 μL
-
i.
-
e.Store prepared buffers and solutions at 4°C until needed.
-
a.
Figure 4.

Characterization of the renal and glomerular EC sample purity
(A) t-SNE (t-distributed stochastic neighbor embedding) visualization of scRNA-seq analyses on ECs isolated from mouse renal parenchyma showing representative EC gene markers expression. Red arrowheads are pointing at cells highly expressing the marker gene. Color scale: red, high expression; blue, low expression.
(B) Top: t-SNE visualization of renal parenchyma (non-) ECs color coded per cell type. Red arrowheads are pointing at non-ECs. Dotted line circles the fraction of glomerular ECs. Bottom: bar plot illustrating the quantification of EC and non-ECs.
(C) t-SNE visualization scRNA-seq analyses on ECs isolated from mouse glomeruli showing representative EC and non-EC gene markers expression and the number of genes expressed per cells. Red arrowheads are pointing at cells highly expressing the marker gene (or cells with low gene number expression). Color scale: red, high expression; blue, low expression.
(D) Top: t-SNE visualization of glomerular (non-) ECs color coded per cell type. Red arrowheads are pointing at non-ECs. Bottom: bar plot illustrating the quantification of EC and non-ECs.
15 mL of kidney digestion buffer suffices for kidneys from 3 adult mice. 1 mL of glomeruli digestion buffer suffices for glomeruli from 3 adult mice.
-
2.Digestion of kidney tissue
-
a.Before dissecting kidneys, perform transcardial perfusion via the left ventricle with ice-cold PBS at a perfusion rate of 1 mL/minute for 5 min.
-
b.Harvest kidneys. Removing the capsules is optional.
-
c.Store kidneys in ice-cold HBSS.
-
d.Transfer kidneys to a petri dish containing around 5 mL kidney digestion buffer, cut the kidneys into small pieces (approx. 1-2 mm2) using a scalpel blade and transfer everything into a 50 mL conical tube. Fill up the volume with kidney digestion buffer (e.g., 15 mL for 6 kidneys).
-
e.Incubate the sample in digestion buffer for 40 min in a 37°C water bath.CRITICAL: Shake the tube vigorously by hand every 10 min for faster tissue dissociation.CRITICAL: After this step, the digestion should be complete (single cell suspension with glomeruli, no macroscopic pieces left). This is critical for the following steps.
-
f.Add an equal volume (same volume as digestion buffer) of cold HBSS to stop the digestion.
-
g.Filter cell suspension through a 70 μm cell strainer, and wash the conical tube and the strainer once with 5-10 mL of cold HBSS.
-
h.Split the flow-through in two equal fractions and filter each fraction using a 40 μm cell strainer: a part of undigested glomeruli remains stacked in the strainers.
-
i.Wash the glomeruli on the cell strainers extensively (15 times) with 6 mL of cold HBSS to allow the tubules wash through the strainers → continue to step 3 for isolation of the glomerular ECs.
-
j.Centrifuge the filtered cells suspension (flow-through) for 7 min at 300 g, remove the supernatant → continue to step 4 for isolation of renal parenchyma ECs.
-
a.
-
3.Glomerular Renal Endothelial Cells (gRECs)
-
a.Transfer the 40 μm cell strainers to a Petri dish.
-
b.Collect glomeruli in a 15 mL conical tube by washing the interior of the strainers (upper side of the mesh and inner sides) and collecting from the top of the strainers (with 200 μL HBSS each time for a minimum of 10 times).Note: Thoroughly inspect the interior of the strainers when collecting the glomeruli: the glomerular material is visible by eye. Wash until no more glomerular material can be seen.Note: If necessary, in order to collect remaining glomeruli, one could cut out the mesh from cell strainers and immerge filter meshes in 1ml HBSS for additional washing. Additional cell suspension should be transferred to the 15 mL conical tube.
-
c.Centrifuge the glomeruli at 300 g for 5 min, remove the supernatant.Note: After this step, the pellet can be resuspended in 1 mL of HBSS to inspect, under the microscope, the purity of the glomerular suspension. Following by centrifugation at 300 g for 5 min. Typical suspension yields >80% glomerular structures and contaminating remaining tubules, which do not include ECs, therefore their presence doesn’t preclude obtaining a high glomerular EC purity.
-
d.Reconstitute and preheat glomeruli digestion buffer for 5 min in water bath at 37°C.
-
e.Incubate for precisely 23 min in a 37°C water bath.
-
i.Resuspend every 5 min by pipetting up and down with a 1 mL tip.
-
i.
-
f.Neutralize trypsin activity by adding 2 mL of trypsin neutralization solution and dilute up to 10 mL with HBSS.
-
g.Centrifuge cell suspension at 400 g for 5 min, remove the supernatant.
-
h.Resuspend the pellet in 1 mL HBSS.
-
i.Continue with FACS staining.
-
a.
-
4.Renal parenchyma ECs: Endothelial cell enrichment using CD31 murine MicroBeads
-
a.Resuspend the pellet in an appropriate amount of Wash Buffer 1 and add the appropriate volume of CD31 MicroBeads (Miltenyi Biotec, Cat#130-097-418) to the suspension according to the manufacturer's instructions.Note: We suggest to resuspend the cells in 90 μL of Wash Buffer 1, determine the cell number and follow the manufacturer's instructions (https://www.miltenyibiotec.com/US-en/products/cd31-microbeads-mouse.html?countryRedirected=1#gref) i.e., for up to 1×10⁷ total cells, resuspend the cells in 90 μL of Wash Buffer 1 and add 10 μL of CD31 MicroBeads. If fewer than 1×10⁷ cells are available, use the same volumes as indicated above. When working with higher cell numbers than 1×10⁷ cells, scale up all reagent volumes and total volumes accordingly.
-
b.Mix and incubate for 15 min at 4°C.Note: Process samples fast in order to avoid non-specific binding of beads at 20°C–22°C.
-
c.Wash the cells by adding 3 mL of Wash Buffer 2 and centrifuge at 300 g for 5 min at 4°C.
-
i.During the centrifugation prepare collection tubes and LS columns (Miltenyi Biotec, Cat#130-042-401) according to the manufacturer's instructions (https://www.miltenyibiotec.com/US-en/products/ls-columns.html#gref) i.e., place the column in the suitable magnetic separator and prepare the column by rinsing with 3 mL of Wash Buffer.
-
i.
-
d.Remove the supernatant and resuspend the pellet in 3 mL of Wash Buffer 2.
-
e.Apply the cell suspension onto the prepared LS column through a 40 μm cell strainer to remove potential cell aggregates in order to prevent clogging of the column.
-
f.Wash the LS column 3 times with 3 mL Wash Buffer 2, adding buffer each time once the column reservoir is empty.Note: The eluent (CD31-negative fraction) from step #4f can be used to prepare controls for FACS analysis or can be discarded if not further needed.
-
g.Remove the LS column from the separator and place it onto a new 15 mL conical collection tube.
-
h.Pipet 5 mL Wash Buffer 1 onto the LS column. Immediately flush out the fraction containing the magnetically labeled cells (CD31-positive fraction) by firmly applying the plunger supplied with the column.
-
i.Continue with FACS staining.
-
a.
-
5.FACSTiming: 1–2 h
CRITICAL: Prepare all required controls for flow cytometry analysis beforehand i.e., unstained cell (US) control, viability control (VB), Fluorescence Minus One (FMO) control, isotype controls (optional), as well as the compensation controls (one for each fluorophore) for proper set up of the cytometer.Note: We recommend to use the cells from the final step of the isolation as the cell controls (US, VB, FMO, isotype controls). However, if the cell number is limited, one can use other cells (e.g., CD31-negative fraction) to prepare the controls. For compensation controls we would recommend to use compensation beads (e.g., OneComp eBeads™ Compensation Beads, Thermo Fisher Scientific, Cat#01-1111-41) to ensure clear fluorescence signal and sufficient compensation.
-
a.Centrifuge the glomerular and the renal parenchymal cell suspensions at 300 g for 5 min, remove the supernatant.
-
b.Resuspend the glomerular cell pellet in 0.5 mL Wash buffer 1-based staining solution containing:
-
i.CD102 (ICAM-2) Monoclonal Antibody (3C4), e.g.,: CD102/ICAM-2-Alexa647 (Thermo Fisher Scientific, Cat#A15452) (1:300).
-
ii.CD73 Monoclonal Antibody (TY/11.8), e.g., CD73-PerCP-Cy5.5 (BioLegend, Cat#127213) (1:100).
-
iii.CD45 Monoclonal Antibody (30-F11), e.g., CD45-PE-Cyanine7 (Thermo Fisher Scientific, Cat#25-0451-82; 1:700).
-
iv.Viability Dye, e.g. eFluor 450 (Thermo Fisher Scientific, Cat#65-0863-18; 1:1000).
-
i.
-
c.Resuspend the renal parenchyma cell pellet in 0.5 mL Wash Buffer 1-based staining solution containing:
-
i.CD102 (ICAM-2) Monoclonal Antibody (3C4), e.g., CD102/ICAM-2-Alexa647 (Thermo Fisher Scientific, Cat#A15452) (1:300).
-
ii.CD31 (PECAM-1) Monoclonal Antibody (390), e.g., CD31-FITC (Thermo Fisher Scientific, Cat#11-0311-82; 1:300).
-
iii.CD45 Monoclonal Antibody (30-F11), e.g., CD45-PE-Cyanine7 (Thermo Fisher Scientific, Cat#25-0451-82; 1:700).
-
iv.Viability Dye, e.g., eFluor 450 (Thermo Fisher Scientific, Cat#65-0863-18; 1:1000).
-
i.
-
d.Stain the cells for 30 min at 4°C in the dark.
-
e.Add 3 mL of Wash Buffer 1 and centrifuge the stained cells at 300 g for 5 min at 4°C, remove the supernatant.
-
f.Resuspend the pellets in Wash Buffer 1 and proceed with FACS.
-
g.For glomerular cells sort viable, CD45- & CD73-, CD102+ cells to the collection tubes.
-
h.For renal parenchyma cells sort viable, CD45-, CD31+ cells to the collection tubes.
-
a.
Figure 1B shows representative FACS plots and gating strategy of viable, CD45-, CD73-, CD102+ glomerular ECs. Figure 1C shows representative FACS plots and gating strategy of viable, CD45-, CD31+ renal parenchyma ECs.
Note: Renal parenchyma ECs are CD102+ and CD31+. Although it is not mandatory to include both antibodies in the staining panel, we highly recommend to do so. In this way, CD102 staining can serve as a control ensuring that the antibody works.
Note: To ensure high viability of the ECs, sort the renal parenchyma ECs to a collection tube containing collection medium (10% (v/v) FBS in PBS, Thermo Fisher Scientific, Cat#A38401).
Spleen endothelial cell isolation
Figure 2A shows a detailed scheme of spleen EC isolation.
-
6.Preparation of spleen digestion buffer
-
a.Right before isolation prepare spleen digestion buffer containing:
-
i.Supplemented KnockOutTM DMEM-medium (see details in section ‘Materials and Equipment’)
-
ii.0.1% (w/v) collagenase II
-
iii.2.5% (w/v) collagenase IV
-
iv.7.5 μg/mL DNase I
Reagent Final concentration Amount Supplemented KnockOutTM DMEM-medium - 4.9625 mL Collagenase II 0.1% (w/v) 5 mg Collagenase IV 2.5% (w/v) 12.5 mg DNase I 7.5 μg/mL 37.5 μL (from 1 mg/mL stock solution prepared according to the manufacturer's instructions)
-
i.
-
b.Prepare PBS-based Wash Buffer 2.
-
c.Store the freshly prepared spleen digestion buffer and Wash Buffer 2 at 4°C until needed.
-
a.
Figure 2.

EC isolation from mouse spleen
(A) Detailed scheme illustrating isolation of ECs from spleen.
(B) Representative FACS plots for gating strategy to sort ECs from spleen based on sorting live/CD45-/CD11b-/CD31+ cells.
5 mL of spleen digestion buffer suffices for 3 adult murine spleens.
-
7.Digestion of spleen tissue
-
a.Before dissecting the spleen, perform transcardial perfusion via the left ventricle with ice-cold PBS at a perfusion rate of 1 mL/minute for 5 min.
-
b.Grind the harvested spleens in a Petri dish on ice with the rough end of a syringe plunger rod in 5 mL of spleen digestion buffer per 3 spleens.
-
c.Transfer spleens with digestion buffer to a 50 mL conical tube.
-
d.Incubate sample in digestion buffer in a 37°C water bath for 15 min.
-
i.Shake the tube by hand every 5 min for faster tissue dissociation.
-
i.
-
e.Stop the reaction with 12.5 mL of cold Wash Buffer 2.
-
f.Filter the sample first through a 100 μm cell strainer and then through a 40 μm cell strainer.
-
g.Centrifuge the cell suspension at 300 g for 7 min.
-
h.Remove the supernatant and resuspend the pellet in 5 mL of Wash Buffer 2.
-
i.Centrifuge the cell suspension at 300 g for 5 min, remove the supernatant.
-
j.Resuspend the pellet in 1.5 mL of Wash Buffer 1.
-
k.Gently apply the cell suspension in a 15 mL conical tube filled with 10 mL of Ficoll and centrifuge at 700 g for 30 min.CRITICAL: Deceleration of the centrifuge should be performed with low break (SLOW option), or no break in case the slow option is not available on the centrifuge, to not disturb the gradient
-
l.After centrifugation, collect the Ficoll part and dilute it up to 50 mL with Wash Buffer 1.Note: A 5 mL pipette can be used for collecting the Ficoll part.
-
m.Centrifuge at 300 g for 10 min, remove the supernatant.
-
n.Wash the pellet a second time with 20 mL of Wash Buffer 1 and centrifuge at 300 g for 5 min and remove the supernatant.
-
a.
-
8.Immune cell depletion using CD45 murine MicroBeads
-
a.Resuspend the pellet in an appropriate amount of Wash Buffer 1 and add the appropriate volume of CD45 MicroBeads (Miltenyi Biotec, Cat#130-052-301) to the suspension according to the manufacturer's instructions.Note: We suggest to resuspend the cells in 90 μL of Wash Buffer 1, determine the cell number and follow the manufacturer's instructions (https://www.miltenyibiotec.com/US-en/products/cd45-microbeads-mouse.html?countryRedirected=1#gref) i.e., for up to 1×10⁷ total cells, resuspend the cells in 90 μL of Wash Buffer 1 and add 10 μL of CD45 MicroBeads. If fewer than 1×10⁷ cells are available use the same volumes as indicated above. When working with higher cell numbers than 1×10⁷ cells, scale up all reagent volumes and total volumes accordingly.
-
b.Mix well and incubate for 15 min at 4°C.Note: Process samples fast in order to avoid non-specific binding of beads at 20°C–22°C.
-
c.Wash the cells by adding 3 mL of Wash Buffer 2 and centrifuge at 300 g for 5 min at 4°C.
-
i.During the centrifugation prepare collection tubes and LD columns (Miltenyi Biotec, Cat#130-042-901) according to the manufacturer's instructions (https://www.miltenyibiotec.com/US-en/products/ld-columns.html#gref) i.e., place the column in the suitable magnetic separator and prepare the column by rinsing with 3 mL of Wash Buffer.
-
i.
-
d.Remove the supernatant and resuspend the pellet in 2 mL of Wash Buffer 2.
-
e.Apply 2 mL of sample suspension onto one LD column through a 40 μm cell strainerCRITICAL: collect unlabeled cells (the eluent) in a 15 mL conical tube (this fraction contains ECs) and keep the tube on ice during collection.Note: 1 LD column is necessary for up to 3 spleens. Step #8d and #8e should be upscaled according to the number of spleens used.
-
f.Wash the LD column twice with 1 mL Wash Buffer 2, adding buffer each time once the column reservoir is empty.CRITICAL: Collect the eluent to the conical tube from step #8e. This fraction contains ECs.
-
g.Centrifuge the total eluent (CD45-negative fraction) at 300 g for 5 min, remove the supernatant.
-
a.
-
9.Endothelial cell enrichment using CD31 murine MicroBeads
-
a.Resuspend the pellet in an appropriate amount of Wash Buffer 1 and add the appropriate volume of CD31 MicroBeads (Miltenyi Biotec, Cat#130-097-418) to the suspension according to the manufacturer's instructions.Note: We suggest to resuspend the cells in 90 μL of Wash Buffer 1, determine the cell number and follow the manufacturer’s instructions (https://www.miltenyibiotec.com/US-en/products/cd31-microbeads-mouse.html?countryRedirected=1#gref) i.e., for up to 1×10⁷ total cells, resuspend the cells in 90 μL of Wash Buffer 1 and add 10 μL of CD31 MicroBeads. If less than 1×10⁷ cells are available use the same volumes as indicated above. When working with higher cell numbers than 1×10⁷ cells, scale up all reagent volumes and total volumes accordingly.
-
b.Mix and incubate for 15 min at 4°C.Note: Process samples fast in order to avoid non-specific binding of beads at 20°C–22°C.
-
c.Wash the cells by adding 3 mL of Wash Buffer 2 and centrifuge at 300 g for 5 min at 4°C.
-
i.During the centrifugation prepare collection tubes and LS columns (Miltenyi Biotec, Cat#130-042-401) according to the manufacturer's instructions (https://www.miltenyibiotec.com/US-en/products/ls-columns.html#gref) i.e., place the column in the suitable magnetic separator and prepare the column by rinsing with 3 mL of Wash Buffer.
-
i.
-
d.Remove the supernatant and resuspend the pellet in 3 mL of Wash Buffer 2.
-
e.Apply the cell suspension onto the prepared LS column through a 40 μm cell strainer to remove potential cell aggregates in order to prevent clogging of the column.
-
f.Wash the LS column 3 times with 3 mL Wash Buffer 2 adding buffer each time once the column reservoir is empty.Note: The eluent (CD31-negative fraction) from step #9f can be used to prepare controls for FACS analysis or can be discarded if not further needed.
-
g.Remove the LS column from the separator and place it onto a new 15 mL conical collection tube.
-
h.Pipet 5 mL Wash Buffer 1 onto the LS column. Immediately flush out the fraction containing the magnetically labeled cells (CD31-positive fraction) by firmly applying the plunger supplied with the column.
-
a.
-
10.FACSCRITICAL: Prepare all required controls for flow cytometry analysis beforehand i.e., unstained cell (US) control, viability control (VB), Fluorescence Minus One (FMO) control, isotype controls (optional), as well as the compensation controls (one for each fluorophore) for proper set up of the cytometer.Note: We recommend to use the cells from the final step of the isolation as the cell controls (US, VB, FMO, isotype controls). However, if the cell number is limited, one can use other cells (e.g., CD31-negative fraction) to prepare the controls. For compensation controls we would recommend to use compensation beads (e.g., OneComp eBeads™ Compensation Beads, Thermo Fisher Scientific, Cat#01-1111-41) to ensure clear fluorescence signal and sufficient compensation.
-
a.Centrifuge the cell suspension at 300 g for 5 min, remove the supernatant.
-
b.Resuspend the pellet in 0.5 mL Wash Buffer 1-based staining solution containing:
-
i.CD11b Monoclonal Antibody (M1/70), e.g., CD11b-PE (BioLegend, Cat#101208) (1:500).
-
ii.CD31 (PECAM-1) Monoclonal Antibody (390), e.g., CD31-FITC (Thermo Fisher Scientific, Cat#11-0311-82; 1:300).
-
iii.CD45 Monoclonal Antibody (30-F11), e.g., CD45-PE-Cyanine7 (Thermo Fisher Scientific, Cat#25-0451-82; 1:700).
-
iv.Viability Dye, e.g., eFluor 450 (Thermo Fisher Scientific, Cat#65-0863-18; 1:1000).
-
i.
-
c.Stain the cells for 30 min at 4°C in the dark.
-
d.Add 3 mL of Wash Buffer 1 and centrifuge the stained cells at 300 g for 5 min at 4°C, remove the supernatant.
-
e.Resuspend the pellet in Wash Buffer 1 and proceed with FACS.
-
f.Sort viable, CD45- & CD11b-, CD31+ cells to collection tubes.
-
a.
Note: To ensure high viability of the ECs, sort the ECs to an Eppendorf tube containing collection medium (10% (v/v) FBS in PBS, Thermo Fisher Scientific, Cat#A38401).
Figure 2B shows representative FACS plots and gating strategy of viable, CD45-, CD11b-, CD31+ spleen ECs.
Testis endothelial cell isolation
Figure 3A shows a detailed scheme of testis EC isolation.
-
11.Preparation of testis digestion buffer
-
a.Right before isolation prepare testis digestion buffer containing:
-
i.HBSS (Ca2+, Mg2+)
-
ii.0.2% (w/v) collagenase I (Sigma-Aldrich)
-
iii.7.5 μg/mL DNase I
Reagent Final concentration Amount HBSS (Ca2+, Mg2+) - 4.9625 mL Collagenase I 0.2% (w/v) 20 mg DNase I 7.5 μg/mL 37.5 μL (from 1 mg/mL stock solution prepared according to manufacturer's instructions)
-
i.
-
b.Prepare PBS-based Wash Buffer 2.
-
c.Store the freshly prepared testis digestion buffer and the Wash Buffer 2 at 4°C until needed.
-
a.
Figure 3.

EC isolation from mouse testis
(A) Detailed scheme illustrating isolation of ECs from testis.
(B) Representative FACS plots for gating strategy to sort ECs from testis based on sorting live/CD45-/CD31+ cells.
5 mL of testis digestion buffer suffices for testes from 3 adult mice.
-
12.Digestion of testis tissue
-
a.Before dissecting the testis, perform transcardial perfusion via the left ventricle with ice-cold PBS at a perfusion rate of 1 mL/minute for 5 min.
-
b.Collect testis and remove the epididymis.
-
c.Cut testis in small pieces (1 mm3) with two scalpel blades and transfer to a 50 mL conical tube containing the testis digestion buffer.
-
d.Incubate sample in digestion buffer in a 37°C water bath for 20 min.
-
i.Shake the tube vigorously by hand every 5 min for faster tissue dissociation.
-
i.
-
e.Stop reaction by adding 25 mL of Wash Buffer 2.
-
f.Filter the sample first through a 100 μm cell strainer and then a 40 μm cell strainer.
-
g.Centrifuge the cell suspension at 300 g for 7 min.
-
h.Remove the supernatant and resuspend the pellet in 10 mL of Wash Buffer 2.
-
i.Centrifuge cell suspension at 300 g for 5 min, remove the supernatant.
-
a.
-
13.Endothelial cell enrichment using CD31 murine MicroBeads
-
a.Resuspend the pellet in an appropriate amount of Wash Buffer 1 and add the appropriate volume of CD31 MicroBeads (Miltenyi Biotec, Cat#130-097-418) to the suspension according to the manufacturer's instructions.Note: We suggest to resuspend the cells in 90 μL of Wash Buffer 1, determine the cell number and follow the manufacturer's instructions (https://www.miltenyibiotec.com/US-en/products/cd31-microbeads-mouse.html?countryRedirected=1#gref) i.e., for up to 1×10⁷ total cells, resuspend the cells in 90 μL of Wash Buffer 1 and add 10 μL of CD31 MicroBeads. If fewer than 1×10⁷ cells are available use the same volumes as indicated above. When working with higher cell numbers than 1×10⁷ cells, scale up all reagent volumes and total volumes accordingly.
-
b.Mix and incubate for 15 min at 4°C.Note: Process samples fast in order to avoid non-specific binding of beads at 20°C–22°C.
-
c.Wash the cells by adding 3 mL of Wash Buffer 2 and centrifuge at 300 g for 5 min at 4°C.
-
i.During the centrifugation prepare collection tubes and LS columns (Miltenyi Biotec, Cat#130-042-401) according to the manufacturer's instructions (https://www.miltenyibiotec.com/US-en/products/ls-columns.html#gref) i.e., place the column in the suitable magnetic separator and prepare the column by rinsing with 3 mL of Wash Buffer.
-
i.
-
d.Remove the supernatant and resuspend the pellet in 3 mL of Wash Buffer 2.
-
e.Apply the cell suspension onto the prepared LS column through a 40 μm cell strainer to remove potential cell aggregates in order to prevent clogging of the column.
-
f.Wash the LS column 3 times with 3 mL Wash Buffer 2 adding buffer each time once the column reservoir is empty.Note: The eluent (CD31-negative fraction) from step #13f can be used to prepare controls for FACS analysis or can be discarded if not further needed.
-
g.Remove the LS column from the separator and place it onto a new 15 mL conical collection tube.
-
h.Pipet 5 mL Wash Buffer 1 onto the LS column. Immediately flush out the fraction containing the magnetically labeled cells (CD31-positive fraction) by firmly applying the plunger supplied with the column.
-
a.
-
14.FACSCRITICAL: Prepare all required controls for flow cytometry analysis beforehand i.e., unstained cell (US) control, viability control (VB), Fluorescence Minus One (FMO) control, isotype controls (optional), as well as the compensation controls (one for each fluorophore) for proper set up of the cytometer.Note: We recommend to use the cells from the final step of the isolation as the cell controls (US, VB, FMO, isotype controls). However, if the cell number is limited, one can use other cells (e.g., CD31-negative fraction) to prepare the controls. For compensation controls we would recommend to use compensation beads (e.g., OneComp eBeads™ Compensation Beads, Thermo Fisher Scientific, Cat#01-1111-41) to ensure clear fluorescence signal and sufficient compensation.
-
a.Centrifuge the cell suspension at 300 g for 5 min, remove the supernatant.
-
b.Resuspend the pellet in 0.5 mL Wash Buffer 1-based staining solution containing:
-
i.CD31 (PECAM-1) Monoclonal Antibody (390), e.g., CD31-FITC (Thermo Fisher Scientific, Cat#11-0311-82; 1:300).
-
ii.CD45 Monoclonal Antibody (30-F11), e.g., CD45-PE-Cyanine7 (Thermo Fisher Scientific, Cat#25-0451-82; 1:700).
-
iii.Viability Dye, e.g., eFluor 450 (Thermo Fisher Scientific, Cat#65-0863-18; 1:1000).
-
i.
-
c.Stain the cells for 30 min at 4°C in the dark.
-
d.Add 3 mL of Wash Buffer 1 and centrifuge the stained cells at 300 g for 5 min at 4°C, remove the supernatant.
-
e.Resuspend the pellet in Wash Buffer 1 and proceed with FACS.
-
f.Sort viable, CD45-, CD31+ cells to collection tubes.
-
a.
Note: To ensure high viability of the ECs, sort the ECs to an Eppendorf tube containing collection medium (10% (v/v) FBS in PBS, Thermo Fisher Scientific, Cat#A38401).
Figure 3B shows representative FACS plots and gating strategy of viable, CD45-, CD31+ testis ECs.
Expected outcomes
The described protocols provide consistent methods for isolating high purity blood vessel ECs from different tissues: kidney, spleen and testis. The protocols involve mechanical and enzymatic digestion, MicroBeads depletion/enrichment and fluorescence-activated cell sorting. The final content of ECs in the cell suspension, after digestion and depletion/enrichment with MicroBeads, and before FACS sorting (in percentage of the total number of events recorded during FACS sorting) varies from around 19% for testis, 23% for glomeruli up to 35% for spleen and renal parenchyma. The viability of sorted ECs measured immediately after FACS varies from 65% (for spleen) to 84% (for renal parenchyma). For details about the flow cytometry analysis and viability see Table S1. Figures 1, 2, and 3 show representative FACS plots and gating strategy for EC sorting.
To confirm the quality and purity of isolated ECs we have used the scRNA-seq data generated from ECs isolated during construction of the “Single-Cell Transcriptome Atlas of Murine Endothelial Cells” (Kalucka et al., 2020) plus additionally generated scRNA-seq data from glomerular ECs and analyzed the cells per organ. For each organ, the EC clusters and non-EC clusters were annotated based on the expression of known EC and non-EC marker genes, including Pecam1 and Cdh5 (blood vessel ECs), Prox1 and Lyve1 (lymphatic ECs), Col1a1 (fibroblasts), Hba-a1, Hba-a2, Hbb-bs (red blood cells), Pdgfrb (pericytes), and Acta2 (smooth muscle cells). The ECs from renal parenchyma, glomeruli and spleen had almost 100% purity and only few contaminating cells (red blood cells) have been detected (see details in Figures 4, 5A, and 5B and Table S1). The ECs had high and consistent expression of known EC markers CD31 (Pecam1), VE-cadherin (Cdh5), CD102 (Icam2), Endoglin/CD105 (Eng) and VEGFR2 (Kdr) (Figures 4, 5A, and 5B). Testis EC sample contained 89.6% of high quality, pure ECs, as demonstrated by the high expression of key EC markers (Figures 5C and 5D). The 10.4% remaining testis cells was characterized by a low number of genes detected per cell and expression of EC markers, while (non-ECs) stroma specific markers were not detected – suggesting lower quality of sequenced cells. These cells have been therefore annotated as a contaminating (low-quality) cells (Figures 5C and 5D).
Figure 5.

Characterization of the splenic and testicular EC sample purity
(A) t-SNE visualization scRNA-seq analyses on ECs isolated from mouse spleen showing representative EC gene and non-EC markers expression. Red arrowheads are pointing at cells highly expressing the marker gene. Color scale: red, high expression; blue, low expression.
(B) Top: t-SNE visualization of spleen (non-) ECs color coded per cell type. Red arrowheads are pointing at non-ECs. Bottom: bar plot illustrating the quantification of EC and non-ECs.
(C) t-SNE visualization scRNA-seq analyses on ECs isolated from mouse testis showing representative EC markers expression and the number of genes expressed per cells. Red arrowheads are pointing at cells highly expressing the marker gene (or cells with low gene number expression). Color scale: red, high expression; blue, low expression.
(D) Top: t-SNE visualization of testis (non-) ECs color coded per cell type. Red arrowheads are pointing at contaminating cells. Bottom: bar plot illustrating the quantification of EC and contaminating cells.
Quantification and statistical analysis
A brief overview of data processing and in silico EC selection (related to Figures 4 and 5)
-
1.
Generate gene expression matrices using the Cell Ranger software (10× Genomics).
-
2.
Aggregate sample data using Cell Ranger software, and process raw data further in R (version 3.4.4).
-
3.Perform the following quality control steps on the pooled tissue datasets:
-
a.genes expressed by fewer than 10 cells or with a row average of < 0.002 should not be considered and therefore removed;
-
b.cells that expressed fewer than 300 genes (low quality), and cells that expressed over 4,000 genes (potential doublets) should be excluded from further analysis;
-
c.cells in which over 10% of unique molecular identifiers (UMIs) were derived from the mitochondrial genome should be removed.
-
a.
-
4.
Normalize the data using the NormalizeData function as implemented in the Seurat package (Satija et al., 2015).
-
5.
Cluster the cells per organ prior to in silico EC selection for each organ separately.
-
6.
First, for EC selection, identify highly variable genes using the Seurat FindVariableGenes function (mean lower threshold = 0.0125, mean higher threshold = 8, dispersion threshold = 0.5.)
-
7.
Auto-scale the data (using highly variable genes only) and summarize by principal component analysis (PCA) using the flashPCA package (Abraham et al., 2017)
-
8.
Visualize the data using t-Distributed Stochastic Neighbor Embedding (t-SNE, Rtsne package; top 8 principal components (PCs)) (van der Maaten and Hinton, 2008).
-
9.
Perform graph-based clustering to cluster cells according to their gene expression profile using the FindClusters function in Seurat (clustering resolution = 1, k-nearest neighbors = 10).
-
10.
Annotate EC clusters based on the expression of known EC and non-EC marker genes, including Pecam1 and Cdh5 (vascular ECs), Prox1 and Lyve-1 (lymphatic ECs), Col1a1 (fibroblasts), Hba-a1, Hba-a2, Hbb-bs (red blood cells), Pdgfrb (pericytes) and Acta2 (smooth muscle cells).
Of note, the data processing and in silico EC selection (steps #4 - #10) was performed using algorithms implemented in the BIOMEX software (Taverna et al., 2020).
All raw and processed sequencing data referred to in this study are available at ArrayExpress: E-MTAB-8077 for kidney: renal parenchyma, spleen and testis (Kalucka et al., 2020) and at ArrayExpress: E-MTAB-10355 for glomeruli.
Limitations
We acknowledge a number of limitations pertaining to the protocols detailed above. First, the protocols were established using 8- to 12-week-old male C57BL6/J mice, and therefore further adjustments might be needed to isolate ECs from different mouse strains (BALB/c, CD-1 or SCID), gender, or from mice at different developmental stages. Second, the protocols are optimized for blood vessel ECs and not for lymphatic ECs. Thus, further adjustments have to be made to specifically isolate lymphatic ECs. For additional information about isolation of lymphatic ECs from e.g., murine lymph nodes and murine embryos we refer to (Fujimoto et al., 2020; Crosswhite, 2018). Third, ECs isolated using the protocols described above were used for multiple transcriptomics approaches (e.g., bulk or single cell RNA sequencing). Additional optimizations should be performed in order to use isolated cells for other applications, e.g., in vitro cell culture. Additionally, the estimated time for each protocol was determined considering an EC isolation performed by one person and from one type of organ only, pooled from 3 mice. The time (or number of persons required) may vary according to the starting number of animals and/or the need to obtain ECs from different organs collected from the same animals.
Of note, some protocols described above may slightly differ from the isolation protocols published in (Kalucka et al., 2020; Dumas et al., 2020) due to further optimization and adjustments to improve EC isolation efficiency. Additionally, if multiple organs are isolated from the same mouse, we suggest to assign one person for the isolation of each organ.
Troubleshooting
Problem 1
Low number of isolated ECs. A low number of isolated ECs may occur due to i) under- or over- digestion of the dissected tissue (step #2d-h, #3b-g, #7, #12b-g), ii) poor enrichment with CD31 MicroBeads (Miltenyi Biotec, Cat#130-097-418) (step #4, #8, #9, #13) or iii) loss of ECs during cell sorting (e.g., due to decreased cell viability or poor labeling with antibodies) (step #5, #10, #14).
Potential solution
To avoid extensive loss of ECs, we recommend to optimize the mechanical steps of digestion (vigorous shaking by hand, pipetting, cutting with scalpel blade, rotation speed) in order to obtain the maximum possible number of ECs from each tissue. Moreover, we recommend to optimize the volume of CD31 MicroBeads (Miltenyi Biotec, Cat#130-097-418) as well as the antibody concentrations according to the manufacturer's instructions, to avoid loss of ECs during magnetic- and cell sorting, respectively. If the problem persists, we advise to use and pool additional mice for the isolation of ECs of the particular organ. Additionally, other positive and negative selection technologies could be optimized and used, for example non-column based magnetic isolations (STEMCELL Technologies).
Problem 2
Low viability of isolated ECs. Low viability of the ECs could be caused by the extended time of the isolation procedure, extended digestion time and the number of manipulations on the cells (step #2e, #3e, #4, #5, #7d, #7k-m, #8, #9, #10, #12d, #13, #14).
Potential solution
We recommend to process samples fast to reduce the time of isolation and to store cell suspensions at 4°C or on ice during the isolation procedure. Optimal enzymatic digestion time is crucial for cell viability. If low EC viability persists during sorting, we advise to adjust the time of enzymatic digestion. Additionally, the concentration of the cell suspension should be adjusted when starting FACS for optimal flow rate to reduce sorting time.
Resource availability
Lead contact
Further information and requests for resources and reagents should be directed to the lead contact, Peter Carmeliet (peter.carmeliet@kuleuven.be), or technical contact, Joanna Kalucka (joanna.kalucka@aias.au.dk).
Materials availability
This study did not generate new unique reagents.
Data and code availability
Original/source data for datatype in the paper is available in ArrayExpress: E-MTAB-8077 (kidney: renal parenchyma, spleen, testis) and ArrayExpress: E-MTAB-10355 (glomeruli). The published article by Kalucka et al. includes datasets for kidney (renal parenchyma), spleen and testis generated or analyzed during this study.
Acknowledgments
We acknowledge the help of A. Bouché and P. Vanwesemael for technical assistance. J.K., N.V.C., K.V., L.T., M.B., P.d.Z., and K.R. are supported by the Fonds voor Wetenschappelijk Onderzoek (FWO); J.K. by AIAS-CO-FUND II: GA: MSCA: 754513 and The Aarhus University Research Foundation; Lundbeckfonden: R307-2018-3667, Carlsberg Fonden: CF19-0687, Riisfort Fonden, A.P. Møller Fonden and Steno Diabetes Center Aarhus (SDCA). L.-A.T. is supported by University of Antwerp; V.G. is supported by Strategisch Basisonderzoek Fonds voor Wetenschappelijk Onderzoek-Vlaanderen (SB-FWO); S.J.D. and K.D.F. is supported by a Marie Curie-IEF Fellowship; P.C. is supported by a long-term structural Methusalem funding by the Flemish Government, Fonds Wetenschappelijk onderzoek (FWO), Foundation Against Cancer (2016-078), European Research Council (ERC) Advanced Research Grant (EU-ERC743074), ERC Proof of Concept (ERC-713758), VIB TechWatch and by the Novo Nordisk Foundation (NNF19OC0055802). All the figures were created with BioRender.
Author contributions
S.J.D., E.M., N.V.C., L.So., R.C., and J.K. wrote the manuscript. The protocol for EC isolation from the spleen was optimized by E.M., kidney and glomeruli were optimized by S.J.D. and E.M., and testis was optimized by S.J.D.; J.K., N.V.C., L.So., E.M., L.-A.T., K.V., R.C., L.T., M.B., C.D., S.J.D., V.G., M.G.-C., P.d.Z., and K.D.F. participated in EC isolations. J.K., L.P.M.H.d.R., K.R., J.G., and L.So. performed scRNA-seq and bioinformatic analysis and result visualization. J.K. and M.P. performed flow cytometry. L.P.M.H.d.R., L.S., M.D., G.E., J.K., K.R., J.G., X.L., and P.C. provided advice and discussed results. J.K. coordinated optimization of protocols. P.C. conceptualized the study.
Declaration of interests
The authors declare no competing interests.
Footnotes
Supplemental information can be found online at https://doi.org/10.1016/j.xpro.2021.100523.
Contributor Information
Joanna Kalucka, Email: joanna.kalucka@aias.au.dk.
Peter Carmeliet, Email: peter.carmeliet@kuleuven.be.
Supplemental information
References
- Abraham G., Qiu Y., Inouye M. FlashPCA2: principal component analysis of Biobank-scale genotype datasets. Bioinformatics. 2017;33:2776–2778. doi: 10.1093/bioinformatics/btx299. [DOI] [PubMed] [Google Scholar]
- Crosswhite P. Isolation of LYVE-1+ endothelial cells from mouse embryos. Bio-protocol. 2018;8:e2962. doi: 10.21769/BioProtoc.2962. [DOI] [PMC free article] [PubMed] [Google Scholar]
- Dumas S.J., Meta E., Borri M., Goveia J., Rohlenova K., Conchinha N.V., Falkenberg K., Teuwen L.-A., De Rooij L., Kalucka J. Single-cell RNA sequencing reveals renal endothelium heterogeneity and metabolic adaptation to water deprivation. J. Am. Soc. Nephrol. 2020;31:118. doi: 10.1681/ASN.2019080832. [DOI] [PMC free article] [PubMed] [Google Scholar]
- Fujimoto N., He Y., D’addio M., Tacconi C., Detmar M., Dieterich L.C. Single-cell mapping reveals new markers and functions of lymphatic endothelial cells in lymph nodes. bioRxiv. 2020 doi: 10.1371/journal.pbio.3000704. 2020.01.09.900241. [DOI] [PMC free article] [PubMed] [Google Scholar]
- Kalucka J., De Rooij L.P.M.H., Goveia J., Rohlenova K., Dumas S.J., Meta E., Conchinha N.V., Taverna F., Teuwen L.-A., Veys K. Single-cell transcriptome atlas of murine endothelial cells. Cell. 2020;180:764–779.e20. doi: 10.1016/j.cell.2020.01.015. [DOI] [PubMed] [Google Scholar]
- Satija R., Farrell J.A., Gennert D., Schier A.F., Regev A. Spatial reconstruction of single-cell gene expression data. Nat. Biotechnol. 2015;33:495–502. doi: 10.1038/nbt.3192. [DOI] [PMC free article] [PubMed] [Google Scholar]
- Taverna F., Goveia J., Karakach T.K., Khan S., Rohlenova K., Treps L., Subramanian A., Schoonjans L., Dewerchin M., Eelen G. BIOMEX: an interactive workflow for (single cell) omics data interpretation and visualization. Nucleic Acids Res. 2020;48:W385–W394. doi: 10.1093/nar/gkaa332. [DOI] [PMC free article] [PubMed] [Google Scholar]
- van Der Maaten L.J.P., Hinton G.E. Visualizing high-dimensional data using t-SNE. J. Mach. Learn. Res. 2008;9:27. [Google Scholar]
Associated Data
This section collects any data citations, data availability statements, or supplementary materials included in this article.
Supplementary Materials
Data Availability Statement
Original/source data for datatype in the paper is available in ArrayExpress: E-MTAB-8077 (kidney: renal parenchyma, spleen, testis) and ArrayExpress: E-MTAB-10355 (glomeruli). The published article by Kalucka et al. includes datasets for kidney (renal parenchyma), spleen and testis generated or analyzed during this study.