Abstract
In the analysis of biological tissue by imaging mass spectrometry (IMS), the limit of detection and dynamic range are of paramount importance in obtaining experimental results that provide insight into underlying biological processes. Many important biomolecules are present in the tissue milieu in low concentrations and in complex mixtures with other compounds of widely ranging abundances, challenging the limits of analytical technologies. In many IMS experiments, the ion signal can be dominated by a few highly abundant ion species. On trap-based instrument platforms that accumulate ions prior to mass analysis, these high abundance ions can diminish the detection and dynamic range of lower abundance ions. Herein, we describe two strategies for combating these challenges during IMS experiments on a hybrid QhFT-ICR MS. In one iteration, the mass resolving capabilities of a quadrupole mass filter are used to selectively enrich ions of interest via a technique previously termed continuous accumulation of selected ions. Second, we have introduced a supplemental dipolar AC waveform to the quadrupole mass filter of a commercial QhFT-ICR mass spectrometer to perform selected ion ejection prior to the ion accumulation region. This setup allows the selective ejection of the most abundant ion species prior to ion accumulation, thereby greatly improving the molecular depth with which IMS can probe tissue samples. The gain in sensitivity of both of these approaches roughly scales with the number of accumulated laser shots up to the charge capacity of the ion accumulation cell. The efficiencies of these two strategies are described here by performing lipid imaging mass spectrometry analyses of a rat brain.
Graphical Abstract
INTRODUCTION
The limit of detection and dynamic range of a mass spectrometry experiment are of critical importance when analyzing complex biological mixtures. These analytical figures of merit determine the ability of an experiment to comprehensively study complex cellular pathways. Proteins, lipids, and metabolites in biological samples can easily span over six orders of magnitude in concentration, testing the limits of analytical mass spectrometry.1 Many proteomics, lipidomics, and metabolomics studies leverage condensed phase fractionation technologies, such as liquid chromatography (LC-MS) and capillary electrophoresis (CE-MS), prior to mass spectrometric analysis to help separate and simplify these complex mixtures.2–5 Orthogonal compound separation by chromatography prior to mass spectrometry has been used for decades to improve peak capacity.6–10 Unfortunately, the longer analysis times required by these hyphenated techniques preclude their use in molecular imaging workflows.11
Matrix-assisted laser desorption/ionization (MALDI) has emerged as the most common imaging mass spectrometry (IMS) approach for the in situ molecular interrogation of tissue samples. In MALDI IMS, ions generated from the tissue surface by laser irradiation are sampled directly into the mass spectrometer.12–15 Thousands of molecular species can be detected in a single imaging mass spectrometry analysis.16 However, many compounds of interest in the tissue milieu are present in low abundance and are thus undetectable using conventional IMS methods. Advanced sample preparation protocols, including tissue washing and chemical derivatization, have been used to improve sensitivity for a desired analyte or class of analytes.17–23 However, these strategies can be time consuming and may introduce tissue deformation and/or analyte delocalization within the tissue. Instead, gas-phase separation techniques represent rapid and flexible means to fractionate complex mixtures of biomolecules after ion generation from the tissue surface and prior to MS detection.
Gas-phase separation and accumulation approaches have been employed in various configurations to improve analytical performance. For example, ion mobility-mass spectrometry (IM-MS) has been shown to improve sensitivity and selectivity by fractionating mixtures on the basis of ion collisional cross section (CCS).24–26 Other approaches have taken advantage of hybrid mass spectrometry instrumentation to perform ion accumulation in a separate ion trap prior to mass analysis.27 For example, ion accumulation in a linear octopole ion trap positioned external to a Fourier transform ion cyclotron resonance (FTICR) cell enabled dramatic improvements in sensitivity.28,29 These external accumulation setups have demonstrated limits of detection of 20 zmol of cytochrome c and duty cycles of 100% during electrospray ionization (ESI) experiments.
Despite the power of external accumulation methods to maximize sensitivity, there is still a wide dynamic range of molecular concentrations that limit the achievable sensitivity. One or more highly abundant compounds can often preclude the detection of more lowly abundant ions in the mass spectrum. The ability to selectively enrich only the ions of interest while discarding other ion signals would thus maximize the sensitivity for the desired compound, especially on trap-based mass spectrometry platforms. One way to perform this involves the use of a quadrupole mass filter (QMF) to restrict ion transmission to a narrow mass range prior to accumulation in an ion trap.30,31 This mass isolation followed by accumulation can be termed “mass-selective ion accumulation” and has been commonly employed on hybrid mass spectrometers.32,33 Conversely, the quadrupole mass filter can also be used to perform selected ejection of one or more highly abundant ions, allowing for additional broadband accumulation of all of the more lowly abundant compounds, up to the charge capacity of the trap.34 This “selected ion ejection” (SIE) has been achieved via resonant ejection using a supplemental dipolar AC excitation waveform as the ions traverse the QMF.35–37 This has been demonstrated to improve the sensitivity of LC-MS proteomics experiments performed on a hybrid quadrupole-hexapole-FT-ICR (QhFT-ICR) MS.
Several gas-phase fractionation approaches have been adapted to improve sensitivity and the dynamic range in imaging mass spectrometry experiments. Ion mobility has been used following both MALDI and desorption electrospray ionization (DESI) to improve the detection of low abundance ions and to separate isobaric (i.e., same nominal mass) compounds.38–43 For example, trapped ion mobility spectrometry (TIMS) has been increasingly used in imaging mass spectrometry workflows.44–49 We and others have described preliminary uses of selective ion accumulation during MALDI IMS to improve limits of detection in a range of applications.50–57 This has largely been performed using a targeted quadrupole mass filter isolation window on hybrid QhFT-ICR mass spectrometers and has been termed continuous accumulation of selected ions (CASI). A thorough analytical characterization and evaluation of CASI imaging has not been previously reported, and we believe a discussion of sensitivity and dynamic range improvements is timely, necessary, and of broad analytical interest.
Herein, we seek to characterize the sensitivity and dynamic range enhancements afforded by CASI IMS. Additionally, we have implemented selected ion injection on a hybrid QhFT-ICR for IMS. The supplementary AC signal applied to the quadrupole enables a small m/z interval to be ejected as the ions transmit through the quadrupole mass filter, allowing for the broadband enrichment of ions of interest downstream in the hexapole accumulation cell. Although SIE has been used previously with LC-MS experiments, it has not to our knowledge been used in imaging mass spectrometry experiments. We feel that there are several important considerations unique to SIE imaging mass spectrometry, including the acquisition of additional laser shots and the increased size of the tissue raster area (i.e., there may be a trade-off between spatial resolution and sensitivity) that warrant a description of the SIE imaging workflow. Importantly, both the CASI and SIE ion accumulation methods allow for ions to be filtered in the quadrupole prior to their admittance into the hexapole trap and eventual transfer to the ICR cell for mass analysis, thereby improving measurement sensitivity and the dynamic range for user-defined m/z intervals. The efficiencies of these two strategies are described here by performing lipid imaging mass spectrometry analyses of a rat brain. This provides a basis as to the levels of signal enhancement that can be achieved with m/z-based ion accumulation strategies.
EXPERIMENTAL SECTION
Materials.
2,5-Dihydroxyacetphenone (DHA), 1,5-diaminonapthalene (DAN), red phosphorous, hematoxylin stain, glycerol, and aluminum potassium sulfate were purchased from Sigma-Aldrich Chemical Co. (St. Louis, MO, USA). Ethanol and methanol were purchased from Fisher Scientific (Pittsburgh, PA, USA).
Mass Spectrometry.
CASI experiments were performed on a 15 T solariX FT-ICR mass spectrometer, and selected ion ejection experiments were performed on a 9.4 T solariX FT-ICR mass spectrometer, both equipped with an Apollo II dual MALDI/ESI source. The 15 T instrument was equipped with an infinity cell, and the 9.4 T instrument was equipped with a dynamically harmonized ParaCell58 (Bruker Daltonics, Billerica, MA). The MALDI source utilizes a Smartbeam II Nd:Yag laser (2 kHz, 355 nm). A 2416A arbitrary waveform generator (Pragmatic Instruments, San Diego, CA) has been successfully coupled to the quadrupole mass filter using a center-tapped transformer (Figure S1). The transformer was hand wound using a 10 mm ID, 18 mm OD ferrite core. The center tap of the secondary winding is attached to the existing instrument vacuum feedthrough that provides the signal from the drive RF circuit for one of the pairs of rods on the quadrupole array. The secondary winding connections are attached to opposing rods of one rod pair. The primary winding connections are attached to vacuum feedthroughs that have been installed on a flange of the quadrupole housing. These feedthroughs are connected to the arbitrary waveform generator and allow a single, user-defined AC signal to be applied to the quadrupole mass filter. The primary and secondary windings of the transformer each have seven turns, which minimized the inductive load on the instrument RF circuit while still allowing for roughly 100% supplementary waveform coupling efficiency across the transformer. This setup allows for the maximum RF voltage to be applied without overdrawing the current on the power supply. Importantly, no changes in ion transmission efficiency were observed due to the new hardware modifications. Agilent tune mix was used to verify a consistent ion signal across a broad mass range. This was verified in both positive ion and negative ion modes (Figure S2). This ensures that no detrimental effects on ion transmission efficiency have been caused by the modification, allowing for normal instrument operation when selected ion ejection experiments are not being performed. For selected ion ejection experiments, the secular frequency of an ion of interest was calculated based on the dimensionless Mathieu trapping parameters and using the Dehmelt approximation. Briefly, the known operating conditions of the quadrupole (i.e., physical dimensions, operating frequency, and voltages) allow for the ion secular frequency to be calculated. This frequency was then manually programmed into the arbitrary waveform generator.
Lipid Extraction.
Microscope slides with uniform lipid coatings were prepared using a TM Sprayer (HTX Technologies, LLC, Chapel Hill, NC, USA). Briefly, the bulk lipid content was extracted from rat brain tissue sections (~30 mg) using an adapted Folch method.59 A 20 μL aliquot of a chloroform/methanol (2:1 v/v) solution was used for each milligram of tissue. The tissue was pulverized and sonicated for 5 min. A 400 μL aliquot of distilled water was then added, and the mixture was vortexed and centrifuged for 5 min at 3000 rpm. A 200 μL aliquot of the lower phase (organic) that contained the bulk lipid content was removed and added to 5 mL of a DAN MALDI matrix solution (15 mg/mL in 90% acetonitrile). A uniform coating of this lipid/matrix mixture was applied to a glass slide using a TM Sprayer (flow rate: 0.15 mL/min, nitrogen flow: 10 psi, spray temperature: 30 °C, four passes with offsets and rotations, spray velocity: 1300 mm/min) (HTX Technologies, LLC, Chapel Hill, NC, USA).
Imaging Mass Spectrometry.
A control rat brain was purchased from Pel-Freeze Biologicals (Rogers, AR, USA) and stored at −80 °C. Transverse sections of the rat brain were prepared using a Cryostar NX70 Cryostat (Thermo Fisher Scientific, San Jose, CA, USA) and thaw mounted onto indium tin oxide (IT)-coated slides. For CASI lipid analysis, a DAN matrix layer was applied using a home-built sublimation apparatus (110 °C, <70 mtorr, 7 min).60,61 For SIE lipid analyses, a DHA matrix layer was applied using a home-built sublimation apparatus (110 °C, <70 mtorr, 4.5 min).
CASI images were acquired using a raster step of 100 μm in both the x and y dimensions using a 40 μm diameter laser beam. Data were collected from m/z 300 to m/z 2000 in negative ion mode using a 512 k free induction decay (FID) time. SIE images were acquired using a raster step of 100 μm in both the x and y dimensions using a 25 μm-diameter laser beam. Data were collected from m/z 500 to m/z 2000 in negative ion mode using a 256 k FID. The full scan and CASI/SIE image comparisons were collected in a single imaging run in order to eliminate the need for normalization between separate images (i.e., the image analysis was paused in FlexControl midway through the run, and the CASI or SIE functionality was manually enabled before then restarting the image run). The resulting ion images were visualized in FlexImaging 5.0 (Bruker Daltonics, Billerica, MA). One-half of the rat brain sections are imaged with either CASI or selected ion ejection enabled, and one half of the rat brain sections are imaged with CASI or selected ion ejection disabled to allow for direct molecular comparisons within the same image on the same tissue section. Lipids were identified by searching high-resolution accurate mass measurements (HRAMs) against the LIPID MAPS (Lipidomics Gateway, www.lipidmaps.org) online database and are reported using the total carbon—double bond (TC:DB) sum composition nomenclature. Data analysis was performed using DataAnalysis and Compass IsotopePattern (Bruker Daltonics) as well as the mMass software package.62 Minimum intensity, maximum intensity, average intensity, and intensity standard deviation values of ion images were measured using ImageJ (https://imagej.nih.gov/ij/, National Institutes of Health, Bethesda, MD) in order to assess the dynamic range of the images.
RESULTS
Selective Ion Accumulation.
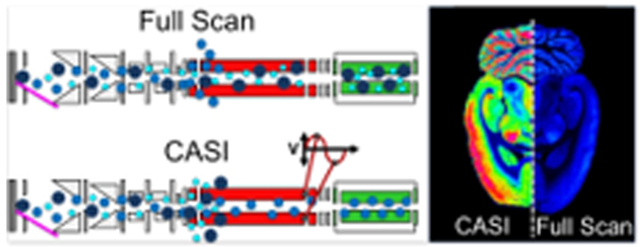
Continuous accumulation of selected ions (CASI) has been used by us and others to improve the limit of detection in a variety of IMS applications.50–57 We seek here to analytically characterize the level of sensitivity and dynamic range improvements that can be achieved by CASI IMS. CASI on the hybrid QhFT-ICR mass spectrometer leverages a pair of multipole devices prior to the ICR cell to perform selective ion accumulation (Figure 1a). Ions generated from the MALDI source pass through a series of transfer ion optics before reaching a quadrupole mass filter (QMF). Operating the QMF in RF/DC mode allows for the transmission of ions within a select m/z window. Ions exiting the QMF are accumulated in a hexapole ion trap. This process continues for a user-defined number of MALDI laser shots, allowing the hexapole ion trap to be filled with the targeted analytes. The accumulated ions are then collectively transferred to the ICR cell where mass analysis is performed.
Figure 1.
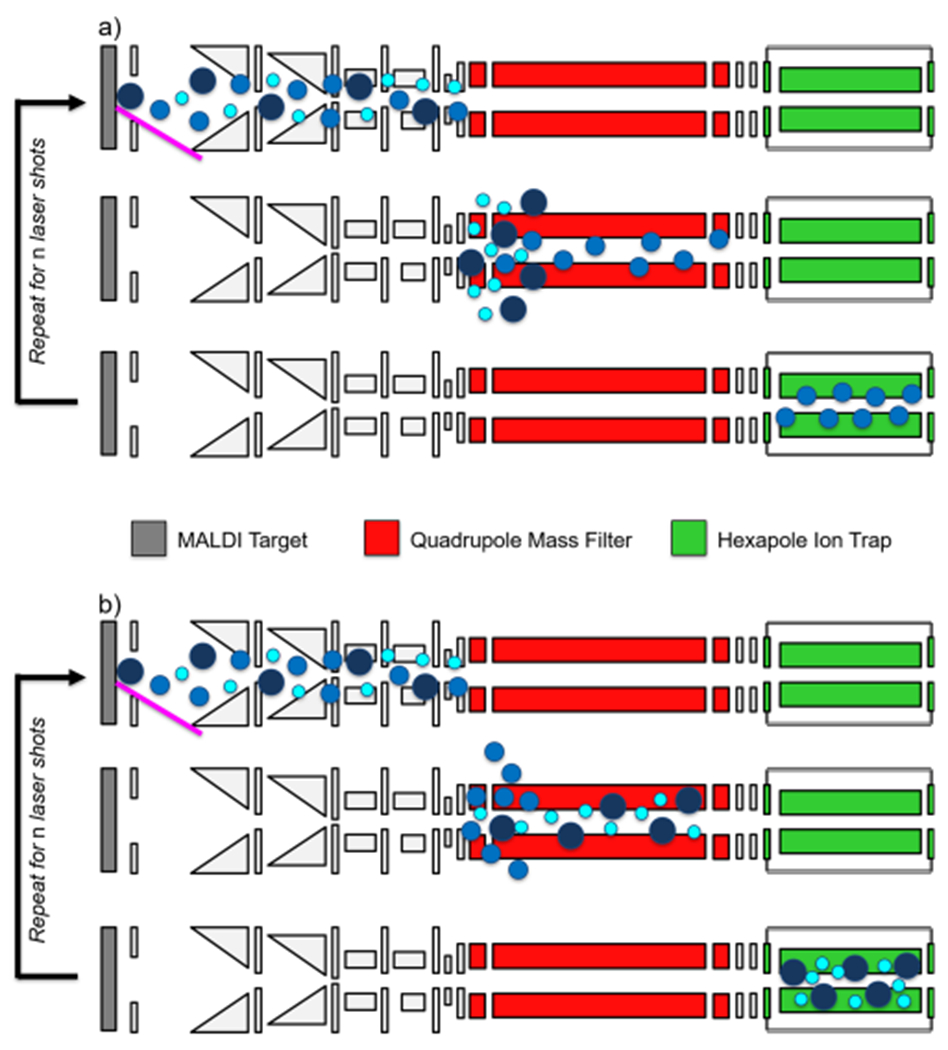
Scheme showing (a) isolation of a small m/z window by CASI and (b) selected ion ejection of a small m/z range. Source ion optics, including ion funnels and transfer multipoles, are shown in light gray. Instrument not drawn to scale, and components have been omitted for simplicity, such as the ESI and APCI sources as well as the ICR cell and related transfer ion optics.
The CASI process is a gas-phase enrichment method that maximizes the signal intensity for selected ions at the expense of ions with m/z values outside of the QMF transmission window. Given the finite charge capacity of the hexapole ion trap, continually injecting ions across a broad mass range quickly fills the trap (it should be noted that the downstream ICR cell also has a space charge limit that if breached will result in peak distortion, which often occurs at smaller number of ions than the storage limit of the hexapole).63–66 This improved performance using the CASI workflow was demonstrated by performing MALDI analysis of a lipid extract from the rat brain tissue. As shown in Figure 2, accumulation across the entire lipid mass range fills the hexapole ion trap in roughly 2000 laser shots (orange circles). Accumulation of ions from successive laser shots quickly surpasses the space charge limit of the trap, as is embodied by the decreasing abundance of m/z 734.56. Conversely, the CASI experiment restricts the QMF transmission window to m/z 734.5 ± 2.5 Da, dramatically decreasing the total ion flux transmitted into the hexapole (blue crosses in Figure 2). This targeted method now primarily fills the hexapole ion trap with the m/z 734.56 ion of interest. The ion accumulation can now persist for additional laser shots before reaching the charge capacity of the trap. A maximum signal-to-noise ratio (S/N, as calculated in Compass DataAnalysis as the signal divided by five times the standard deviation of the noise, S/5σ) of roughly 1600 is reached after 8000 shots, an over fivefold improvement in the S/N compared to the full-scan experiment that roughly correlates with the increased number of laser shots. Improvements in the S/N of over 40-fold can readily be achieved with the CASI method (Figure S3). The dynamic range is also clearly improved by similar relative magnitudes. This process improves the S/N linearly by accumulating additional ion signal (i.e., “S”) and is a more efficient means for improving the S/N than spectral averaging, which only improves the S/N by the square-root of the number of averaged scans (green squares in Figure 2).
Figure 2.
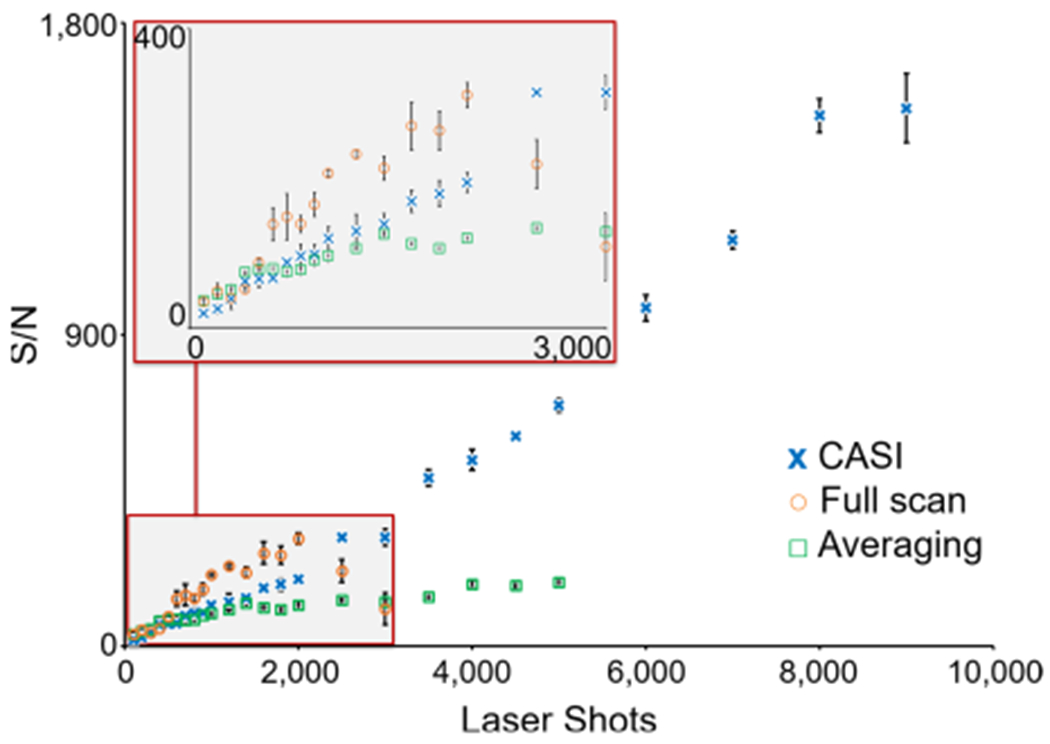
S/N of m/z 734.56 from a rat brain lipid extract is shown as a function of the number of MALDI laser shots for the full scan (orange circles), a 5 Da isolation window CASI (blue crosses), and spectral averaging (green squares) acquisition modes. Each measurement represents four averages.
In an imaging mass spectrometry experiment, CASI can be used to improve the detection limit of lowly abundant endogenous and exogenous compounds in the tissue. This is exemplified using a lipid analysis of the rat brain (Figures 3 and 4). A full-scan mass spectrum necessitated restricting the number of laser shots to 100 shots per pixel in order to stay within the charge capacity. Using a QMF isolation window of ±37.5 Da centered at m/z 845, the CASI experiment allowed for the accumulation of 1000 laser shots without reaching the space charge limit, showing markedly improved ion intensities within the selected mass range (Figure 3b). Several ions below the detection limit in the full-scan measurement are now observed in the CASI experiment (Figure 3b zoom-in). These improvements in ion intensities translate into improvements in image intensity and quality (Figure 4). Many lipids within the selected mass range were of low abundance or not detectable (left hemisphere of the rat brain ion images shown in Figure 4). However, these lipids are readily detected with strong image contrast (i.e., dynamic range, see Figure S4) in the CASI imaging experiment (right hemisphere of the rat brain ion images shown in Figure 4).
Figure 3.
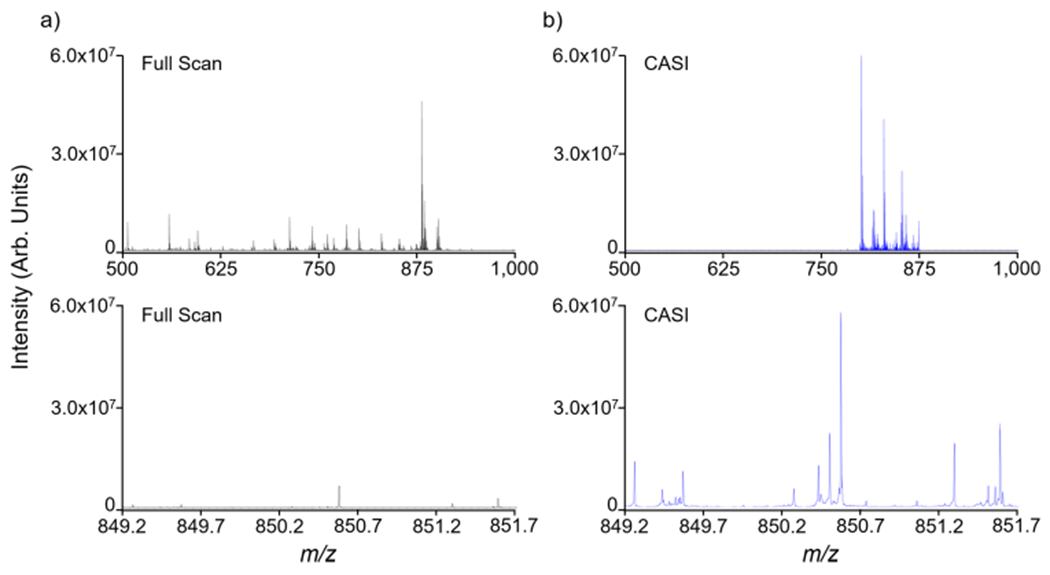
Lipid analysis of a rat brain in (a) full-scan acquisition mode and (b) using a 75 Da CASI window centered at m/z 845. Spectral zoom-ins of a 2.5 Da m/z range are included to demonstrate the improvement in ion detection using CASI. The full-scan experiment employed 100 laser shots/pixel with the smart walk feature disabled, and the CASI experiment employed 1000 laser shots/pixel with the smart walk feature enabled.
Figure 4.
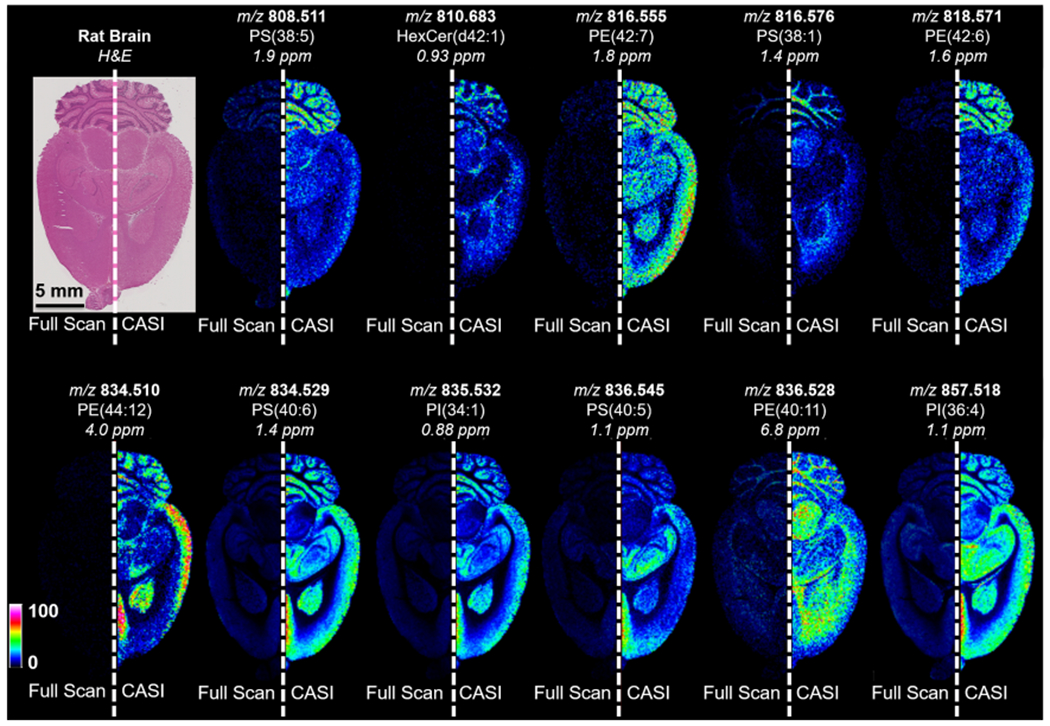
Imaging mass spectrometry analysis of a rat brain using (left hemisphere) full-scan acquisition mode and (right hemisphere) using a 75 Da CASI window centered at m/z 845. Ion images for a range of lipids within the CASI window show improved brightness (i.e., sensitivity) and contrast (i.e., dynamic range). Images are shown without normalization.
In order to enable the accumulation of additional laser shots, the “random smart walk” MALDI functionality was enabled during CASI experiments. For the experiment shown in Figure 4, the smart walk performs a random target raster for 1000 laser shots within a 100 μm × 100 μm square pixel using a 40 μm-diameter laser beam. This more thoroughly ablates all of the material within the pixel compared to the full-scan experiment that did not use the random walk raster setting; instead, all 100 shots per pixel were fired at a single location within the 100 μm × 100 μm pixel using the 40 μm-diameter laser beam, leaving a portion of the pixel unablated. In order to accumulate sufficient ions for an increase in sensitivity during a CASI experiment, a target raster may or may not be required depending on the experimental conditions (e.g., matrix thickness, laser power, width of the CASI isolation window, intensity of ions within the CASI window, etc.). It should be noted that a target raster will sample a larger area of the tissue, which may require sacrificing spatial resolution in some instances (i.e., increasing the raster step size between pixels).
Selected Ion Ejection.
The ability to selectively eject a small m/z interval (Figure 1b) was confirmed by ejecting a single ion (m/z 588.502) from a red phosphorous distribution (Figure 5). The secular frequency of m/z 588.502 in the quadrupole mass filter was calculated based on the dimensionless Mathieu trapping parameters and using the Dehmelt approximation.67–69 Briefly, the known operating conditions of the quadrupole (i.e., physical dimensions, operating frequency, and voltages) allow for the ion secular frequency to be calculated. Using a low-mass cutoff (LMCO) setting of 300 Da in the quadrupole, the secular frequency of m/z 588.5 was calculated to be approximately 124.5 kHz. Almost all of the m/z 588.502 ion signal was removed upon using the SIE arbitrary waveform generator to apply a 1.0 V, 124.5 kHz AC signal to the quadrupole (Figure 5b). The signal intensities of the neighboring ions in the distribution, m/z 526.554 and m/z 650.449, were unaffected, indicating good waveform resolution. The residual m/z 588.502 ion signal is likely due to the fact that the ion transit time through the quadrupole is relatively short, providing only a limited number of secular oscillations for the ion to come in resonance with the applied signal and be ejected before it reaches the exit of the QMF. Slowing the ion transit through the quadrupole mass filter using a higher gas pressure and/or a lower accelerating lens voltage may enable improved ejection efficiency. Nonetheless, the current result of ~95% ejection efficiency will be adequate for most applications.
Figure 5.
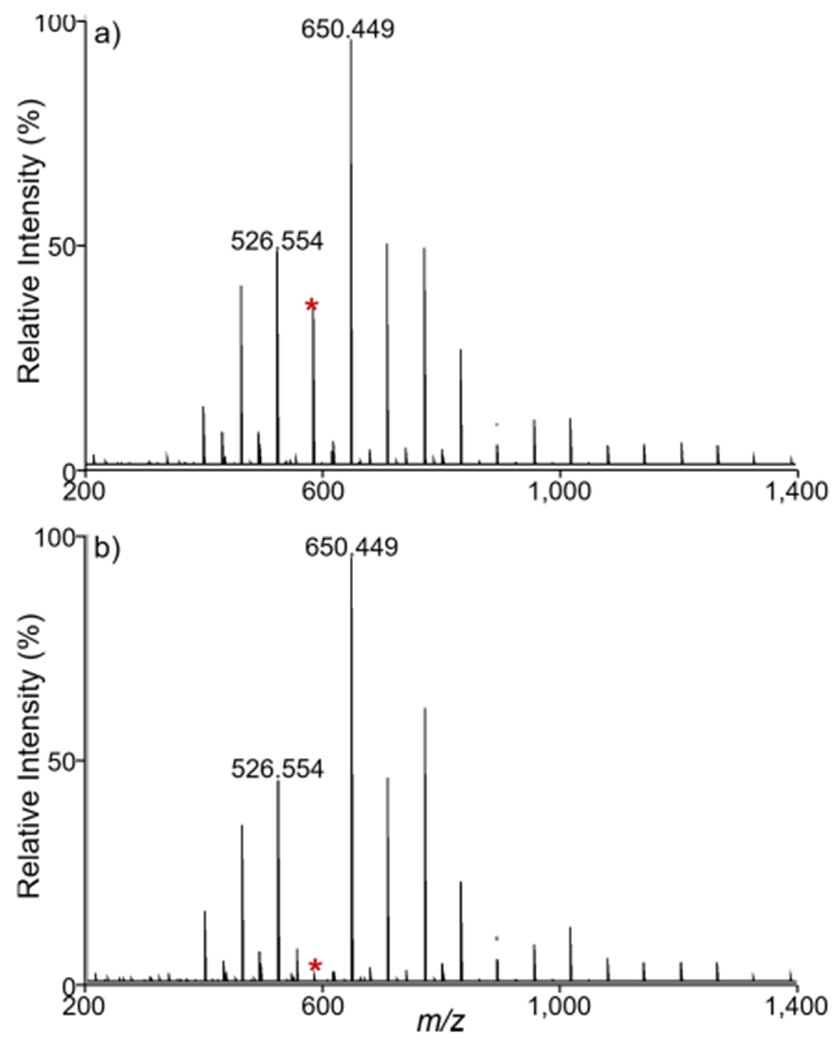
Red phosphorus analysis under (a) off-resonance and (b) selected ion ejection conditions. Selected ion ejection of m/z 588.502 (red asterisk) in panel (b) was performed using an instrument LMCO of 300 Da and a 1.0 V, 124.5 kHz applied waveform, resulting in nearly 100% ejection efficiency without affecting red phosphorous ions of higher or lower m/z values. The ion secular frequency, and thus the frequency of the applied waveform, is calculated using the Mathieu trapping parameters and the Dehmelt approximation. Applying the same voltage waveform off-resonance at 129 kHz in panel (a) does affect the intensity of m/z 588.502. Spectra shown are averages of 10 scans.
The relative m/z width of the ejection window is partially dependent on the frequency of the applied waveforms. The frequency density at larger Mathieu q values is higher than at lower q values, so an AC signal that spans 1 kHz at a low frequency (i.e., higher m/z) will encompass a wider range of m/z values compared to a 1 kHz wide signal at a higher frequency (i.e., lower m/z). The low-mass cutoff setting on the instrument can be varied by the user to alter the secular frequency of an ion of interest. The relative width of the ejection window is also dependent upon the amplitude of the applied signal. A higher voltage signal may more efficiently eject ions from the quadrupole, but this will also result in a wider m/z window. These two parameters, frequency ejection point and ejection amplitude, provide the user with some flexibility in tuning the width of the ejection window. In some applications a wider window may be useful to eject a larger m/z range, while in other applications a higher resolution window may be desired to more selectively eject a smaller mass range. For our purposes, we found that a 1.0 V signal generally resulted in a 10 Da ejection window with nearly 100% efficiency.
The utility of selected ion ejection for improving sensitivity and the dynamic range in an imaging mass spectrometry experiment was evaluated during negative ion mode lipid analysis of a rat brain. The lipid PI(38:4) (m/z 885.550) is frequently observed as the most abundant ion in negative ion mode lipid MALDI IMS experiments.70 There are also several other highly abundant lipid compounds observed in the mass range between m/z 875 and m/z 910, such as the sulfatides SHexCer(40:1) and SHexCer(42:2) (Figure 6a). These ions comprise a significant portion of the charge capacity of the hexapole accumulation cell in this sample, limiting the ability to store other less intense ions. An SIE waveform was applied to the QMF to eject these highly abundant ions during ion transmission (Figure 6b). A 2.5 V, 123.5 kHz waveform using a QMF LMCO of 450 Da enabled the ejection of most ions between m/z 875 and m/z 910, including SHexCer(40:1), PI(38:4), and SHexCer(42:2) with 98, 79, and 98% efficiencies, respectively. The relatively lower ejection efficiency of PI(38:4) is likely due to the higher abundance of this lipid (i.e., approximately fivefold higher than the abundances of the two sulfatides). A higher voltage SIE waveform was used here compared to that employed in Figure 5 in order to eject ions from a wider m/z range. Comparing the ion images of the lipid ions within the SIE window with and without the waveform applied clearly demonstrates the efficiency of ion ejection (Figure 6c).
Figure 6.
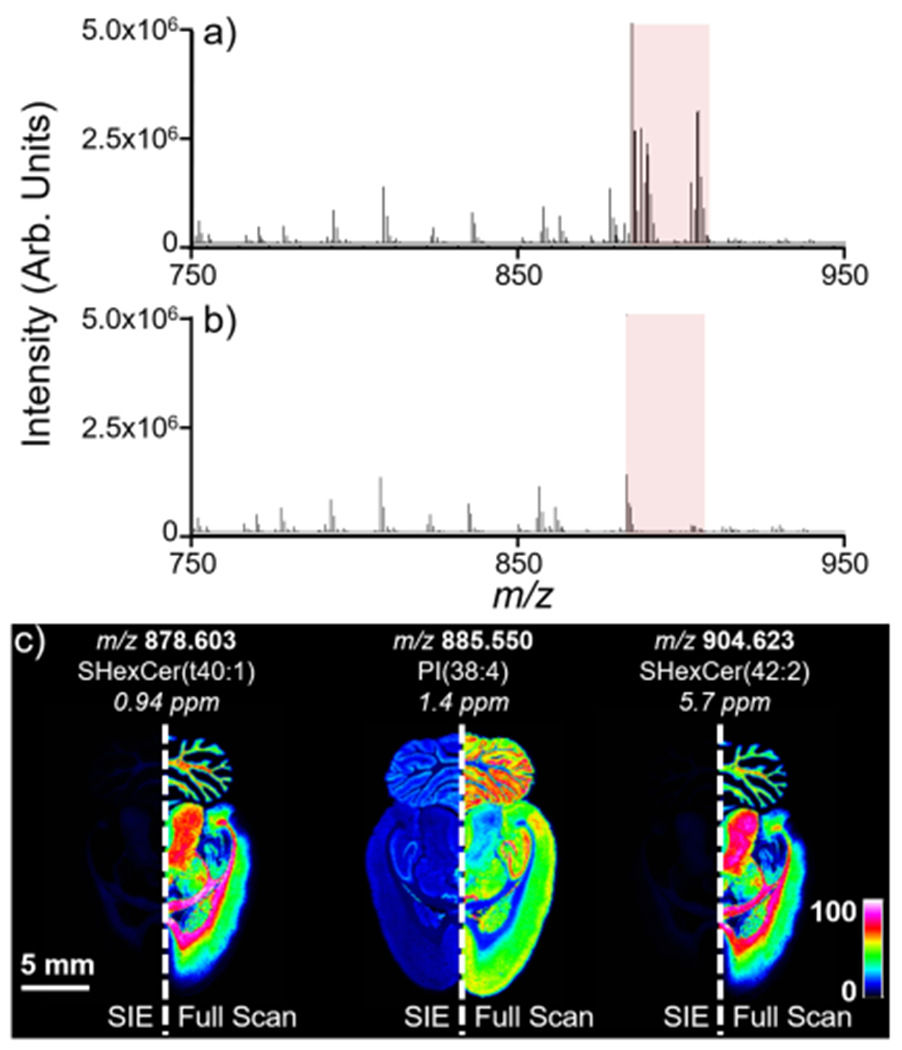
Imaging mass spectrometry analysis of a rat brain using (a) full-scan acquisition mode and (b) using an SIE method. The SIE method used a 2.5 V, 123.5 kHz waveform with an LMCO of 450 Da. The number of laser shots (400) was kept constant between the SIE and full-scan acquisitions to demonstrate the ability of the SIE waveform to remove most of the ions within the isolation window from the spectrum (highlighted by the red box). (c) Applied waveform successfully ejects most lipid ions between m/z 875 and m/z 910.
The number of laser shots in the SIE and full-scan experiments was held constant in Figure 6 to enable a direct comparison of SIE efficiency. However, the removal of the highly abundant ions via SIE indicates that there is now additional unused charge capacity in the hexapole ion trap. This allows for the accumulation of additional laser shots to maximize the intensity of other ions outside of the SIE window without reaching the space charge limit. In Figure 7, a full-scan IMS analysis of the rat brain tissue was performed using 55 laser shots (right hemisphere). The accumulation of additional laser shots would breach the space charge limit of the ICR cell and/or the hexapole ion trap. Upon application of the same SIE waveform as used in Figure 6 (2.5 V, 123.5 kHz SIE waveform with a QMF LMCO of 450 Da), the number of laser shots could be increased to 225 without surpassing the charge capacity of the trap (left hemisphere in Figure 7). Several ions close to the detection limit in the full-scan measurement are now observed in the SIE experiment. As with the CASI experiment, the improvements in ion intensities with the SIE method translate into improvements in image intensity and quality. The lipid ion intensities shown in Figure 7 increased by 3.7-fold on average (Figure S5). This is roughly consistent with a ~4.1-fold increase in the number of laser shots used in the SIE experiment compared to the full-scan experiment. Many lipids are readily detected with good brightness (i.e., sensitivity) and good image contrast (i.e., dynamic range) in the SIE imaging experiment.
Figure 7.
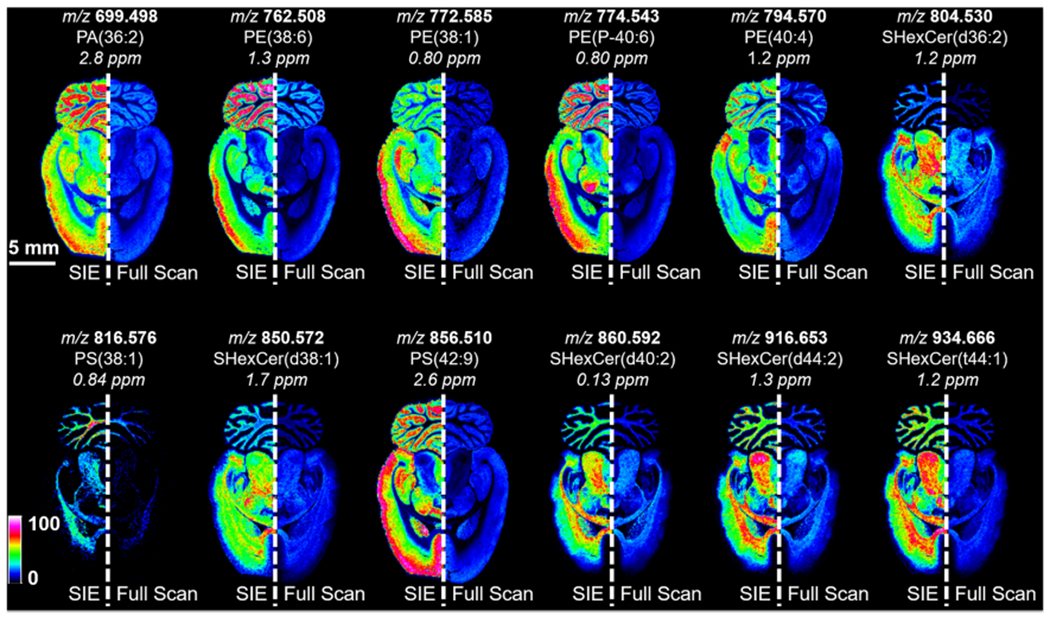
Imaging mass spectrometry analysis of a rat brain using (right hemisphere) full-scan acquisition mode and (left hemisphere) using a 2.5 V, 123.5 kHz SIE waveform with an LMCO of 450 Da. The number of laser shots was varied between the two methods to maximize the intensity of the ion populations without reaching the space charge limit (full scan: 55 laser shots, SIE: 225 laser shots). Both experiments were performed using an 80 μm random walk. Ion images for a range of lipids show improved brightness (i.e., sensitivity) and contrast (i.e., dynamic range) using the SIE acquisition method. Images are shown without normalization.
CONCLUSIONS
We have described two methods of ion enrichment for use during imaging mass spectrometry experiments. Continuous accumulation of selected ions (CASI) and selected ion ejection (SIE) are both rapid gas-phase strategies that fractionate ions based on their m/z ratios. CASI is performed by using the RF/DC isolation feature of the quadrupole mass filter to restrict ion transmission to a small m/z range, allowing for the targeted enrichment of ions trapped downstream in the hexapole ion trap by over 25-fold. SIE is performed by using a supplementary AC waveform applied to the quadrupole mass filter to selectively eject ions within a small m/z range, allowing for the broadband enrichment of ions trapped downstream in the hexapole ion trap by over fourfold. Both of these methods operate by discarding the signal from unwanted ions in order to maximize the ion population for compounds of interest. Both CASI and SIE are enabled with no impact on instrument throughput, allowing for the acquisition of ion images with improved brightness (i.e., sensitivity) and contrast (i.e., dynamic range) without requiring longer analysis times. CASI methods are useful in targeted applications where analytes of interest fall within a small mass range (i.e., a drug and its metabolite), while SIE methods are more beneficial in untargeted or exploratory workflows where it is desirable to increase the sensitivity of lower abundance molecules across a broad mass range. As a variety of gas-phase fractionation strategies are finding increased application in imaging mass spectrometry workflows, we hope that this report will provide a benchmark for comparison with other approaches.
Supplementary Material
ACKNOWLEDGMENTS
This work was supported by the National Institutes of Health (NIH) under award P41 GM103391 (National Institute of General Medical Sciences [NIGMS]). The authors would also like to thank Dr. Ryan Danell of Danell Consulting, Inc. as well as Dr. Christian Berg of Bruker Daltonics for inputs regarding the quadrupole modifications.
Footnotes
The authors declare no competing financial interest.
Supporting Information
The Supporting Information is available free of charge at https://pubs.acs.org/doi/10.1021/acs.analchem.0c02121.
(Figure S1) Coupling transformer for supplemental AC signal, (Figure S2) ion transmission verified before and after hardware modifications, (Figure S3) S/N improvements with CASI, (Figure S4) imaging dynamic range improvements with CASI, and (Figure S5) imaging sensitivity and dynamic range improvements with SIE (PDF)
Complete contact information is available at: https://pubs.acs.org/10.1021/acs.analchem.0c02121
Contributor Information
Boone M. Prentice, Department of Biochemistry and Mass Spectrometry Research Center, Vanderbilt University, Nashville, Tennessee 37232, United States.
Daniel J. Ryan, ExxonMobil Research and Engineering Company, Annandale, New Jersey 08801, United States.
Kerri J. Grove, Mass Spectrometry Research Center and Department of Chemistry, Vanderbilt University, Nashville, Tennessee 37232, United States
D. Shannon Cornett, Bruker Daltonics, Billerica, Massachusetts 01821, United States.
Richard M. Caprioli, Department of Biochemistry, Mass Spectrometry Research Center, and Department of Chemistry, Vanderbilt University, Nashville, Tennessee 37232, United States; Department of Pharmacology and Medicine, Vanderbilt University Medical Center, Nashville, Tennessee 37232, United States.
Jeffrey M. Spraggins, Department of Biochemistry, Mass Spectrometry Research Center, and Department of Chemistry, Vanderbilt University, Nashville, Tennessee 37232, United States.
REFERENCES
- (1).Bennett BD; Kimball EH; Gao M; Osterhout R; Van Dien SJ; Rabinowitz JD Nat. Chem. Biol 2009, 5, 593–599. [DOI] [PMC free article] [PubMed] [Google Scholar]
- (2).Schmitt-Kopplin P; Frommberger M Electrophoresis 2003, 24, 3837–3867. [DOI] [PubMed] [Google Scholar]
- (3).Dettmer K; Aronov PA; Hammock BD Mass Spectrom. Rev. 2007, 26, 51–78. [DOI] [PMC free article] [PubMed] [Google Scholar]
- (4).Yates JR; Ruse CI; Nakorchevsky A Annu. Rev. Biomed. Eng 2009, 11, 49–79. [DOI] [PubMed] [Google Scholar]
- (5).Blanksby SJ; Mitchell TW Annu. Rev. Anal. Chem 2010, 3, 433–465. [DOI] [PubMed] [Google Scholar]
- (6).Holmes JC; Morrell FA Appl. Spectrosc 1957, 11, 86–87. [Google Scholar]
- (7).Gohlke RS Anal. Chem 1959, 31, 535–541. [Google Scholar]
- (8).Tal’roze VL; Karpov GV; Gorodetski IG; Skurat VE Russ. J. Phys. Chem 1968, 42, 1658–1664. [Google Scholar]
- (9).Baldwin MA; McLafferty FW Org. Mass Spectrom. 1973, 7, 1111–1112. [Google Scholar]
- (10).Olivares JA; Nguyen NT; Yonker CR; Smith RD. Anal. Chem 1987, 59, 1230–1232. [Google Scholar]
- (11).Pu F; Chiang S; Zhang W; Ouyang Z Analyst 2019, 144, 1034–1051. [DOI] [PMC free article] [PubMed] [Google Scholar]
- (12).Caprioli RM; Farmer TB; Gile J Anal. Chem 1997, 69, 4751–4760. [DOI] [PubMed] [Google Scholar]
- (13).McDonnell LA; Heeren RMA Mass Spectrom. Rev. 2007, 26, 606–643. [DOI] [PubMed] [Google Scholar]
- (14).Norris JL; Caprioli RM Chem. Rev 2013, 113, 2309–2342. [DOI] [PMC free article] [PubMed] [Google Scholar]
- (15).Wu C; Dill AL; Eberlin LS; Cooks RG; Ifa DR Mass Spectrom. Rev. 2013, 32, 218–243. [DOI] [PMC free article] [PubMed] [Google Scholar]
- (16).Cornett DS; Frappier SL; Caprioli RM Anal. Chem 2008, 80, 5648–5653. [DOI] [PMC free article] [PubMed] [Google Scholar]
- (17).Lemaire R; Desmons A; Tabet JC; Day R; Salzet M; Fournier IJ Proteome Res. 2007, 6, 1295–1305. [DOI] [PubMed] [Google Scholar]
- (18).Manier ML; Reyzer ML; Goh A; Dartois V; Via LE; Barry CE III; Caprioli RM J. Am. Soc. Mass Spectrom. 2011, 22, 1409–1419. [DOI] [PMC free article] [PubMed] [Google Scholar]
- (19).Yang J; Caprioli RM Anal. Chem 2011, 83, 5728–5734. [DOI] [PMC free article] [PubMed] [Google Scholar]
- (20).Angel PM; Spraggins JM; Baldwin HS; Caprioli R Anal. Chem 2012, 84, 1557–1564. [DOI] [PMC free article] [PubMed] [Google Scholar]
- (21).Shariatgorji M; Nilsson A; Goodwin RJA; Källback P; Schintu N; Zhang X; Crossman AR; Bezard E; Svenningsson P; Andren PE Neuron 2014, 84, 697–707. [DOI] [PubMed] [Google Scholar]
- (22).Toue S; Sugiura Y; Kubo A; Ohmura M; Karakawa S; Mizukoshi T; Yoneda J; Miyano H; Noguchi Y; Kobayashi T; Kabe Y; Suematsu M Proteomics 2014, 14, 810–819. [DOI] [PubMed] [Google Scholar]
- (23).Shariatgorji M; Nilsson A; Källback P; Karlsson O; Zhang X; Svenningsson P; Andren PE J. Am. Soc. Mass Spectrom. 2015, 26, 934–939. [DOI] [PubMed] [Google Scholar]
- (24).Kanu AB; Dwivedi P; Tam M; Matz L; Hill HH Jr. J. Mass Spectrom. 2008, 43, 1–22. [DOI] [PubMed] [Google Scholar]
- (25).Ruotolo BT; Gillig KJ; Stone EG; Russell DH J. Chromatogr., B 2002, 782, 385–392. [DOI] [PubMed] [Google Scholar]
- (26).Lapthorn C; Pullen F; Chowdhry BZ Mass Spectrom. Rev. 2013, 32, 43–71. [DOI] [PubMed] [Google Scholar]
- (27).Wang Y; Zhang X; Zhai Y; Jiang Y; Fang X; Zhou M; Deng Y; Xu W Anal. Chem 2014, 86, 10164–10170. [DOI] [PubMed] [Google Scholar]
- (28).Quenzer TL; Emmett MR; Hendrickson CL; Kelly PH; Marshall AG Anal. Chem 2001, 73, 1721–1725. [DOI] [PubMed] [Google Scholar]
- (29).Senko MW; Hendrickson CL; Emmett MR; Shi SDH; Marshall AG J. Am. Soc. Mass Spectrom. 1997, 8, 970–976. [Google Scholar]
- (30).Hager JW Rapid Commun. Mass Spectrom. 2002, 16, 512–526. [Google Scholar]
- (31).Pekar Second T; Blethrow JD; Schwartz JC; Merrihew GE; MacCoss MJ; Swaney DL; Russell JD; Coon JJ; Zabrouskov V Anal. Chem 2009, 81, 7757–7765. [DOI] [PMC free article] [PubMed] [Google Scholar]
- (32).Wang Y; Shi SD-H; Hendrickson CL; Marshall AG Int. J. Mass Spectrom. 2000, 198, 113–120. [Google Scholar]
- (33).Belov ME; Nikolaev EN; Anderson GA; Auberry KJ; Harkewicz R; Smith RD J. Am. Soc. Mass Spectrom. 2001, 12, 38–48. [DOI] [PubMed] [Google Scholar]
- (34).Belov ME; Anderson GA; Angell NH; Shen Y; Tolic N; Udseth HR; Smith RD Anal. Chem 2001, 73, 5052–5060. [DOI] [PubMed] [Google Scholar]
- (35).Campbell JM; Collings BA; Douglas DJ Rapid Commun. Mass Spectrom. 1998, 12, 1463–1474. [DOI] [PubMed] [Google Scholar]
- (36).Cha B; Blades M; Douglas DJ Anal. Chem 2000, 72, 5647–5654. [DOI] [PubMed] [Google Scholar]
- (37).Collings BA; Douglas DJ J. Am. Soc. Mass Spectrom. 2000, 11, 1016–1022. [DOI] [PubMed] [Google Scholar]
- (38).Jackson SN; Ugarov M; Egan T; Post JD; Langlais D; Schultz JA; Woods AS J. Mass Spectrom. 2007, 42, 1093–1098. [DOI] [PMC free article] [PubMed] [Google Scholar]
- (39).McLean JA; Ridenour WB; Caprioli RM J. Mass Spectrom. 2007, 42, 1099–1105. [DOI] [PubMed] [Google Scholar]
- (40).Trim PJ; Henson CM; Avery JL; McEwen A; Snel MF; Claude E; Marshall PS; West A; Princivalle AP; Clench MR Anal. Chem 2008, 80, 8628–8634. [DOI] [PubMed] [Google Scholar]
- (41).Stauber J; MacAleese L; Franck J; Claude E; Snel M; Kaletas BK; Wiel IMVD; Wisztorski M; Fournier I; Heeren RMA J. Am. Soc. Mass Spectrom. 2010, 21, 338–347. [DOI] [PubMed] [Google Scholar]
- (42).Jackson SN; Barbacci D; Egan T; Lewis EK; Schultz JA; Woods AS Anal. Methods 2014, 6, 5001–5007. [DOI] [PMC free article] [PubMed] [Google Scholar]
- (43).Sans M; Feider CL; Eberlin LS Curr. Opin. Chem. Biol 2018, 42, 138–146. [DOI] [PMC free article] [PubMed] [Google Scholar]
- (44).Hernandez DR; DeBord JD; Ridgeway ME; Kaplan DA; Park MA; Fernandez-Lima F Analyst 2014, 139, 1913–1921. [DOI] [PMC free article] [PubMed] [Google Scholar]
- (45).Ridgeway ME; Lubeck M; Jordens J; Mann M; Park MA Int. J. Mass Spectrom. 2018, 425, 22–35. [Google Scholar]
- (46).Spraggins JM; Djambazova KV; Rivera ES; Migas LG; Neumann EK; Fuetterer A; Suetering J; Goedecke N; Ly A; Van de Plas R; Caprioli RM Anal. Chem 2019, 91, 14552–14560. [DOI] [PMC free article] [PubMed] [Google Scholar]
- (47).Neumann EK; Migas LG; Allen JL; Caprioli RM; Van de Plas R; Spraggins JM Anal. Chem 2020, DOI: 10.1021/acs.analchem.0c02051. [DOI] [PubMed] [Google Scholar]
- (48).Soltwisch J; Heijs B; Koch A; Vens-Cappell S; Höhndorf J; Dreisewerd K Anal. Chem 2020, 92, 8697–8703. [DOI] [PubMed] [Google Scholar]
- (49).Fu T; Oetjen J; Chapelle M; Verdu A; Szesny M; Chaumot A; Degli-Esposti D; Geffard O; Clément Y; Salvador A; Ayciriex SJ Mass Spectrom. 2020, 55, No. e4531. [DOI] [PubMed] [Google Scholar]
- (50).Anderson DMG; Mills D; Spraggins J; Lambert WS; Calkins DJ; Schey KL Mol. Vision 2013, 19, 581–592. [PMC free article] [PubMed] [Google Scholar]
- (51).Groseclose MR; Castellino S Anal. Chem 2013, 85, 10099–10106. [DOI] [PubMed] [Google Scholar]
- (52).Sun N; Walch A Histochem. Cell Biol. 2013, 140, 93–104. [DOI] [PubMed] [Google Scholar]
- (53).Cobice DF; Goodwin RJA; Andren PE; Nilsson A; Mackay CL; Andrew R Br. J. Pharmacol 2015, 172, 3266–3283. [DOI] [PMC free article] [PubMed] [Google Scholar]
- (54).Wenke JL; Rose KL; Spraggins JM; Schey KL Invest. Ophthalmol. Visual Sci. 2015, 56, 7398–7405. [DOI] [PMC free article] [PubMed] [Google Scholar]
- (55).Hulme HE; Meikle LM; Wessel H; Strittmatter N; Swales J; Thomson C; Nilsson A; Nibbs RJB; Milling S; Andren PE; Mackay CL; Dexter A; Bunch J; Goodwin RJA; Burchmore R; Wall DM Sci. Rep 2017, 7, 2786. [DOI] [PMC free article] [PubMed] [Google Scholar]
- (56).Yang B; Patterson NH; Tsui T; Caprioli RM; Norris JL J. Am. Soc. Mass Spectrom. 2018, 29, 1012–1020. [DOI] [PMC free article] [PubMed] [Google Scholar]
- (57).Prentice BM; Hart NJ; Phillips N; Haliyur R; Judd A; Armandala R; Spraggins JM; Lowe CL; Boyd KL; Stein RW; Wright CV; Norris JL; Powers AC; Brissova M; Caprioli RM Diabetologia 2019, 62, 1036–1047. [DOI] [PMC free article] [PubMed] [Google Scholar]
- (58).Kostyukevich YI; Vladimirov GN; Nikolaev EN J. Am. Soc. Mass Spectrom. 2012, 23, 2198–2207. [DOI] [PubMed] [Google Scholar]
- (59).Folch J; Lees M; Stanley GHS J. Biol. Chem 1957, 226, 497–509. [PubMed] [Google Scholar]
- (60).Hankin JA; Barkley RM; Murphy RC J. Am. Soc. Mass Spectrom. 2007, 18, 1646–1652. [DOI] [PMC free article] [PubMed] [Google Scholar]
- (61).Thomas A; Charbonneau JL; Fournaise E; Chaurand P Anal. Chem 2012, 84, 2048–2054. [DOI] [PubMed] [Google Scholar]
- (62).Strohalm M; Hassman M; Košata B; Kodiček M Rapid Commun. Mass Spectrom. 2008, 22, 905–908. [DOI] [PubMed] [Google Scholar]
- (63).Paša-Tolić L; Huang Y; Guan S; Kim HS; Marshall AG J. Mass Spectrom. 1995, 30, 825–833. [Google Scholar]
- (64).Mitchell DW; Smith RD J. Mass Spectrom. 1996, 31, 771–790. [Google Scholar]
- (65).Marshall AG; Hendrickson CL; Jackson GS Mass Spectrom. Rev. 1998, 17, 1–35. [DOI] [PubMed] [Google Scholar]
- (66).Nikolaev EN; Kostyukevich YI; Vladimirov GN Mass Spectrom. Rev. 2016, 35, 219–258. [DOI] [PubMed] [Google Scholar]
- (67).Mathieu É J. Math. Pures Appl. 1868, 13, 137–203. [Google Scholar]
- (68).McLachlan NW Theory and Application of Mathieu Functions; Clarendon Press: Oxford, 1947. [Google Scholar]
- (69).March RE; Todd JFJ Quadrupole ion trap mass spectrometry; 2nd ed.; J. Wiley: Hoboken, N.J., 2005; 165, 346. [Google Scholar]
- (70).Zemski Berry KA; Hankin JA; Barkley RM; Spraggins JM; Caprioli RM; Murphy RC Chem. Rev 2011, 111, 6491–6512. [DOI] [PMC free article] [PubMed] [Google Scholar]
Associated Data
This section collects any data citations, data availability statements, or supplementary materials included in this article.


