Abstract
We have recently discussed how organic nanocrystal dissolution appears in different morphologies and the role of the solution pH in the crystal detriment process. We also highlighted the role of the local molecular chemistry in porphyrin nanocrystals having comparable structures: in water‐based acid solutions, protonation of free‐base porphyrin molecules is the driving force for crystal dissolution, whereas metal (ZnII) porphyrin nanocrystals remain unperturbed. However, all porphyrin types, having an electron rich π‐structure, can be electrochemically oxidized. In this scenario, a key question is: does electrochemistry represent a viable strategy to drive the dissolution of both free‐base and metal porphyrin nanocrystals?
In this work, by exploiting electrochemical atomic force microscopy (EC‐AFM), we monitor in situ and in real time the dissolution of both free‐base and metal porphyrin nanocrystals, as soon as molecules reach the oxidation potential, showing different regimes according to the applied EC potential.
Keywords: porphyrin, porphyrin protonation, etch-pit formation, crystal dissolution, organic nanocrystals, liquid-phase atomic force microscopy, electrochemistry, ToF-SIMS, optical spectroscopy
Free‐base porphyrin (P) nanocrystals can be dissolved in acid electrolytes only when the second porphyrin oxidation is reached. Indeed, molecules only show a surface‐pit enhancement after the first oxidation. In addition, metal‐Ps, which are stable when immersed in acids, can be dissolved if their oxidation electrochemical potential is applied. These occurrences prove that molecule oxidation is the driving mechanism of crystal dissolution.
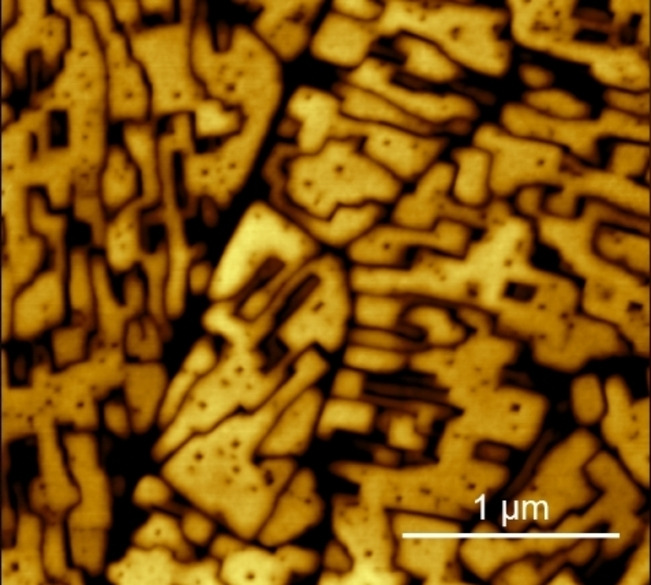
1. Introduction
Organic molecular aggregates represent the main dross in agricultural waste [1] and an important percentage of rubbish in industrial production.[ 2 , 3 ] Their treatment and disposal strategies can have a significant impact in the environment. On the other hand, organic nanocrystals dissolution plays a key role in the current pharmaceutical and drug delivery investigations.[ 4 , 5 , 6 ] The importance of these researches in so different technological fields of our society explains the wide interest in (organic) crystal dissolution, whose study can be dated back to the late 50’s when F. C. Frank started the first fruitful studies.[ 7 , 8 ] Crystal dissolution has been mainly studied in terms of reverse process respect to the growth. This approach has focused many studies on the crystal evolution in vacuum and/or solid/liquid and liquid/liquid environments. However, from a practical point of view, crystal dissolution generally occurs in not‐equilibrium conditions and this should require a specific investigation. The possibilities offered by atomic force microscopy (AFM) in giving a direct view of the dissolution process helped in the development of models, such as the one proposed by Lasaga and Lüttge, where the crystal dissolution is triggered by the evolution of dominant morphological motives called pits. [9] The latter are crystallographically oriented deep holes resulting from the detachment of growth units accomplished at a critical undersaturation of the solution. [10] Recently, some of the authors exploited a model system (porphyrin nanocrystals deposited onto a highly oriented pyrolytic graphite (HOPG) substrate) immersed in a diluted sulfuric acid solution to prove that the dissolution process shows a multifaceted and complex scenario. [11] The protonation reaction and the resulting crystals dissolution are only possible with free‐base porphyrins (H2TPP), while metal porphyrins (ZnTPP, in the present case) are shown to be stable inside the acid solution if simply immersed. However, both H2TPP and ZnTPP molecules can be further oxidized through electrochemical procedures, such as cyclic voltammetry (CV), and therefore converted in their radical cation species, which constitutes an alternative step towards nanocrystals dissolution.[ 12 , 13 ]
In this work, by exploiting electrochemical‐AFM (EC‐AFM), we investigate the porphyrin nanocrystal dissolution as a function of the applied EC potential. This analysis can confirm the role of porphyrin molecule oxidation as the driving force in organic crystal dissolution and, on the other hand, is helpful in defining differences between free‐base and metal porphyrin species during the dissolution process.
2. Results and Discussion
2.1. EC‐AFM Analysis of the H2TPP Sample
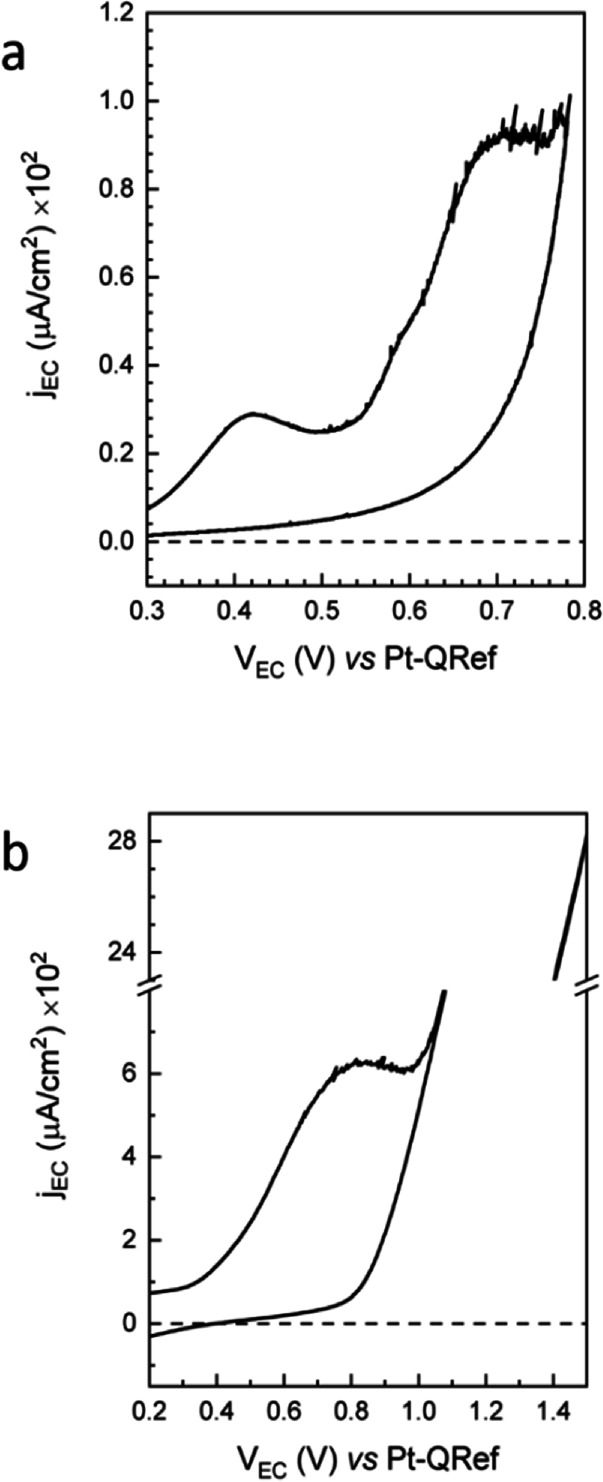
The CV is acquired in the traditional EC potential range where the oxidation of graphite is usually studied (between 0.3 V and 1.3 or 1.6 V vs Pt‐QRef, accordingly to the electrolyte pH).[ 17 , 19 ] During HOPG oxidation, the HOPG basal plane undergoes a significant anion intercalation process and a consequent swelling of the surface (blistering) due to gas evolution.[ 20 , 21 ] The HOPG intercalation process has clear features in the CV (not shown here): some shoulders appears above 1.0 V (vs Pt‐QRef) during the anodic swept and a broader peak (placed at around 0.95 V) characterizes the cathodic one.[ 17 , 18 , 19 , 20 ] Conversely, in Figure 1, where we report two subsequent CVs of the H2TPP/HOPG electrode, the anodic faradaic current enhancement is completely featureless, and no cathodic (negative) currents are detected during the CVs. This suggests that the HOPG basal plane is well protected by the organic film when the electrode is immersed in the 1 mm H2SO4 electrolyte. [22]
Figure 1.
Voltammograms of the H2TPP/HOPG electrode acquired at a scan speed of 1.5 mV/s during the AFM image scan (see below). In panel a, we report the first scan, where two peaks at 0.42 and 0.70 V are clearly visible. During the second scan (b), only one broader feature at 0.80 V is detected.
During the first scan (see panel a), the CV is inverted before reaching the main faradaic current enhancement at around 0.9 V. Two peaks clearly appear at 0.42 and 0.70 V, which are related to two subsequent oxidations. The exchanged Q1 and Q2 charges, related to the two EC processes can be evaluated after a proper background subtraction. Their values are almost comparable [Q1=(0.20±0.05) mC and Q2=(0.30±0.05) mC] and correspond to about 1015 elementary charges. This fact, considering the molecular arrangement discussed in Ref. 11 and references therein, suggests that the uppermost molecules are those mainly affected by the EC processes. Starting from the second CV (see panel b), the two peaks are hardly recognizable while an apparent single wide feature at 0.80 V characterizes the EC potential range explored in panel a. Here, the exchanged charge is about Q3=8.5 mC that is more than one order of magnitude higher than the (Q1+Q2) value measured in the previous scan. Probably, more porphyrin molecules are now involved in the EC process, as a consequence of the crystal detriment [higher surface‐to‐volume ratio (see also AFM images below)], thus justifying the faradaic current enhancement and a peak broadening, which results in the presence of an apparent single peak. Moreover, we observe that the H2TPP film is able to protect the buried HOPG electrode from any anion intercalation: in fact, no characteristic intercalation or de‐intercalation peaks [17] are measured during the CV swept.
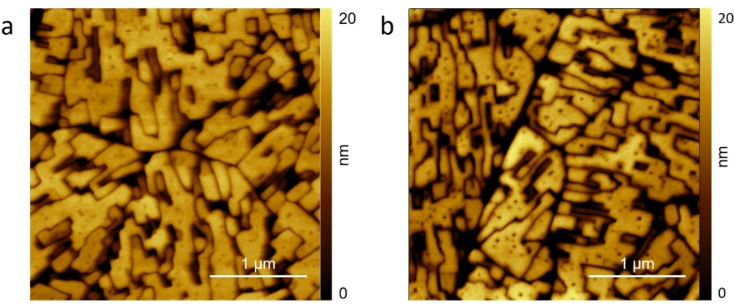
Figure 2 a shows the morphology of the H2TPP/HOPG electrode surface when immersed in the 1 mm H2SO4 electrolyte at an EC potential of 0.3 V. The porphyrin crystals show some pits on the terraces, in close agreement with previous results. [11] The pits are seen as soon as the AFM tip starts the scanning (about 5 minutes after the sample immersion) but their number and shape does not evolve as a function of time.
Figure 2.
AFM images of the H2TPP/HOPG electrode when immersed inside the electrolyte (H2SO4, 1 mm) at 0.3 V (vs. Pt‐QRef) before the CV (a) and after an EC potential swept up to the first protonation reaction (b).
If the sample undergoes a CV extended only to the first oxidation potential (at about 0.40–0.50 V), the surface morphology is almost unperturbed (porphyrin crystals still have sharp edges and angles). However, the pits density increases, and pits appear wider and deeper (see panel b). The electrochemical treatment in the diluted acid electrolyte thus results in the sample etching, i. e. a strategy that does not dissolve crystals or alter their quality but only produce sharp pits. The porphyrin gains a net charge by oxidation and thus it becomes soluble in water‐based electrolytes. However, only molecules weakly bounded in the crystals (edges, pit borders, strain regions, defect areas) can be removed with the consequent enhancement in the number, dimension and depth of pits.
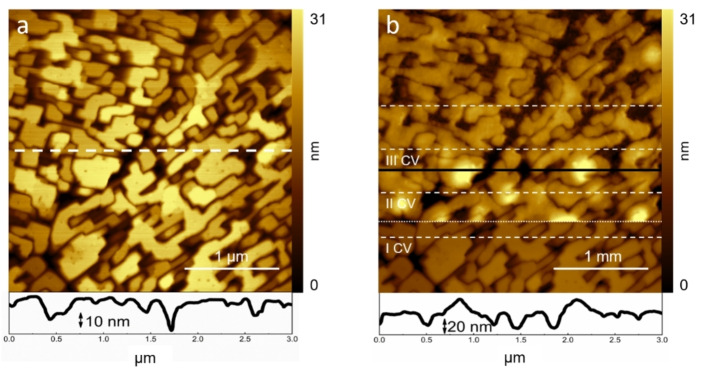
This scenario is significantly changed when the second oxidation potential (at 0.65–0.80 V) is reached. In Figure 3, we report a real‐time morphology evolution of a freshly prepared electrode surface during three subsequent CVs extended beyond the second EC process.
Figure 3.
AFM image scan of the H2TPP/HOPG electrode (a) at 0.3 V and (b) during three subsequent CVs, marked by dashed white lines. In the image, the dotted line locates where the second EC reaction is reached. Surface cross‐sections are also reported at the bottom of the panels, dashed white line in (a) and the full black one in (b).
For a better comparison, panel a shows the sample surface at an EC potential of 0.3 V with respect to the Pt‐QRef. The dashed white line refers to the surface cross‐section reported at the bottom. The computed surface roughness of the full image [defined as the arithmetic mean value (Ra) between the peaks and the minima of different image cross‐sections] is Ra=11.7 nm. The porphyrin crystals show the usual morphology, with terraces affected by some pits naturally produced immediately after the electrode immersion inside the electrolyte. In panel b, the AFM scan proceeds from the bottom to the top while the EC potential is continuously changed for the simultaneous voltammogram acquisition. In particular, the EC potential is kept at 0.3 V before the start of the first CV and after the end of the third and last one. The topographic intervals where the EC potential is changed for the CV acquisition (0.3 V÷1.6 V) are highlighted by dashed white lines. Before the start of the I CV, the porphyrin crystals are those already observed in Figure 3a. During the I CV, a sudden morphological change occurs at the potential (0.80 V) marked by the dotted white line. Here, the second oxidation is reached. The morphology is now characterized by gnarly terraces caused by small bulges formed on the surface. The mean surface roughness increases to Ra=26.7 nm. The detriment and dissolution of crystals continue during the following two CVs (see also the surface cross‐section reported at the bottom of the image, which refers to the black line in panel b) and the electrochemical processes progressively round the crystal edges (Ra=35 nm and 21 nm, respectively). Such a significant difference in the dissolution process between the first and second oxidation requires an explanation. Clearly, the second oxidation doubles the exchanged charge and reasonably increases the porphyrin reactivity. However, we believe that counterions also play a key role. Porphyrins, in fact, by exposing the main inner cavity to the electrolyte, [11] offer an easy place to accommodate the counterion after the first oxidation reaction. Conversely, the second process requires that a second counterion is placed close to the molecule inner cavity. This is not possible at the crystal‐electrolyte interface because almost all the molecules of the uppermost layer must host the corresponding counterion related to the first oxidation. Consequently, we speculate that the second counterion, trying to reach the opposite side of the inner cavity, undermines the porphyrin molecule from the crystal structure thus promoting the dissolution process and the evolution of bulges.
2.2. EC‐AFM Analysis of the Complete H2TPP Crystal Dissolution
In the previous section, we focused on differences between the first and second oxidation with respect to the dissolution process. We started to observe a progressive detriment of the porphyrin crystals due to the oxidation process, which represents the driving force of the crystal dissolution. Nonetheless, 3D structures are still visible in Figure 3. On the other hand, we have already proved that crystals are completely dissolved in pH=0 solutions. [11] It is thus important to demonstrate that a complete crystal dissolution is also possible in 1 mm H2SO4 electrolytes (pH=3) as a consequence of subsequent EC oxidations. For this reason, tens of CVs are acquired in an extended EC potential range (namely, −0.8 V÷1.6 V). With these parameters, (i) porphyrin molecules periodically undergo both oxidations and reductions (an important requirement to avoid reaction quenching due to charge accumulation), and (ii) the H2TPP/HOPG electrode works at relative high potential values (above 1.0 V) where an unprotected graphite electrode suffers intense anion intercalation. [17] All the acquired voltammograms are essentially superimposed to the representative CV reported in Figure 4.
Figure 4.
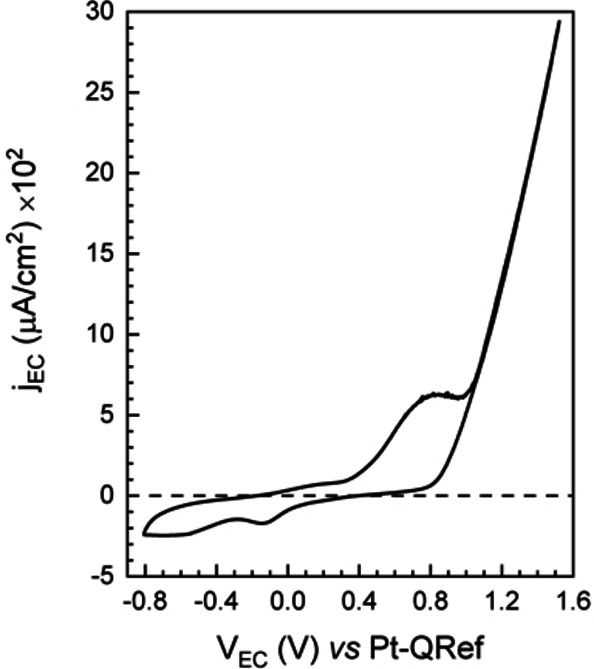
Representative voltammogram of the H2TPP/HOPG electrode during tens of subsequent CVs (CV scan rate=25 mV/s).
The CV reproducibility proves that, on the one hand, the EC process is reversible and repeatable but, on the other hand, the CVs are not sensible to possible further changes on the electrode surface. In particular, we note that only an apparent single wide anodic (positive) peak is detected in the voltammogram, as the one reported in Figure 3b. In the cathodic regime, before the hydrogen evolution potential, two features are visible at −0.1 V and −0.55 V that contribute for an overall exchanged charge of about 8 mC. The presence of two peaks suggests that the main anodic structure is the superposition of two oxidation reactions. [23]
During the CVs, no shoulders appear in the voltammograms above the oxygen evolution potential. In addition, the characteristic cathodic de‐intercalation feature, placed between 0.4 V÷1.1 V, is not observed, confirming that the buried HOPG electrode is protected by any detriment caused by the basal plane swelling.[ 17 , 20 ] However, despite the presence of the organic film, the H2TPP/HOPG system properly works as an electrode, being the faradaic current enhancement due to the water electrolysis clearly visible.
Figure 5 shows the final morphology evolution of the porphyrin organic film.
Figure 5.
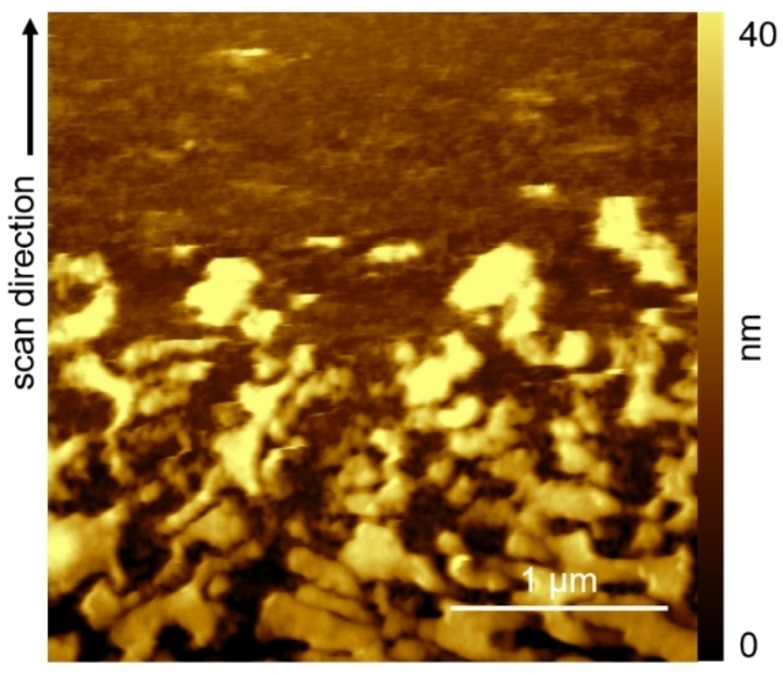
AFM image scan of the H2TPP/HOPG electrode during subsequent CVs. The crystal residuals progressively disappear confirming the complete dissolution of the sample.
The image is acquired from the bottom to the top while CVs continuously run. In the first half of the image, some porphyrin crystal residuals evolve to the final dissolution, proving that the 3D phase can be completely removed from the sample, i. e., porphyrin molecules are removed from the islands and the latter disaggregate. However, the surface morphology reported in the upper part of the image is qualitatively different from the pristine graphite surface,[ 11 , 17 ] due to the presence of some curds and the absence of any graphite step and terrace.
In view of proving the persistence of an organic film on the HOPG surface, we exploited reflectance measurements on the H2TPP/HOPG electrode in real time during the EC processes. Figure 6a compares the reflectance spectra acquired on the bare HOPG surface, the pristine H2TPP/HOPG electrode and the sample after about ten CVs. The pristine porphyrin film (a picture is shown in panel b) spectrum shows optical transitions typical of porphyrin‐based molecules, characterized by clear peaks related to the main Soret band transition (at about 430 nm) and the less intense Q‐bands at higher wavelength (above 500 nm, marked by dashed vertical lines). [24] This spectrum reduces its intensity during subsequent CVs.
Figure 6.
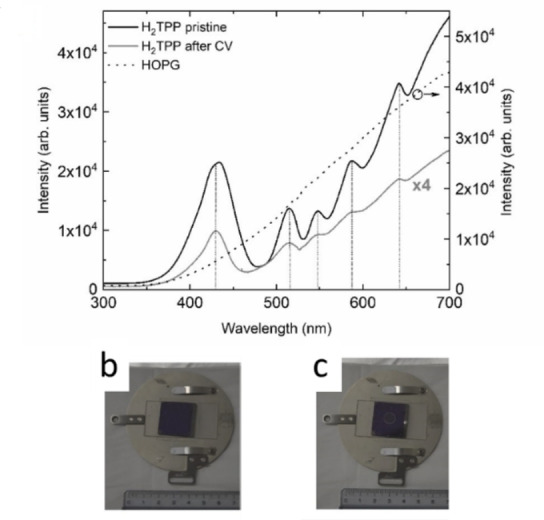
(a) Comparison among reflectance spectra acquired on bare HOPG (dotted line), pristine H2TPP/HOPG electrode (solid black line), and H2TPP/HOPG electrode after ten CVs (solid grey line). (b) Picture off H2TPP/HOPG sample before and (c) after the electrochemical treatments.
However, even after ten CVs, the reflectance spectrum shows the characteristic porphyrin pattern, proving that the electrode surface is still covered by an organic film (see panel c).
The reflectance spectrum characterization is also able to monitor the electrode evolution during the very first CVs, when the first oxidation peak is reached and when the second oxidation starts and a significant dissolution of the porphyrin film is observed. The acquired results are reported as a contour plot in Figure 7.
Figure 7.
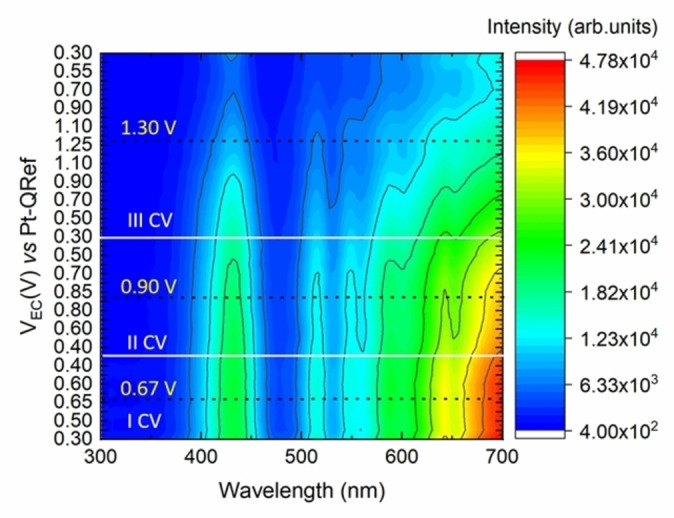
Contour plot of the first three CVs acquired on the H2TPP/HOPG electrode. The white horizontal lines enclose the EC potential region explored during each CV, while the dashed black lines pinpoint the maximum EC potential value reached during each scan.
Here, white horizontal lines delimit the EC potential region of a single CV, while the dashed black lines pinpoint the maximum EC potential value reached during the scan. Starting from the bottom, the three dashed black lines thus refer to the first and second oxidation and to the nominal graphite intercalation stage. We can clearly observe that the first oxidation (when EC‐AFM highlights only pits, Figure 3b) does not affect the spectra while a progressive signal intensity reduction occurs starting from the second oxidation (crystal dissolution and bulges evolution in Figure 5).
Finally, after the above EC treatment, the sample was extracted from the cell and gently dried by fluxing pure nitrogen. A ToF‐SIMS analysis was finally acquired in view of comparing similarities and differences in the surface chemistry with respect to samples only immersed inside a diluted acid solution. [11] We monitored the intensity evolution of the molecular ion peak of the porphyrin macrocycle at 614.25 m/z (Figure S1 in the Supporting Information) and a related characteristic fragment ion at m/z 141.05 (Figure S2) for the as grown sample, the sample immersed in 1 mm H2SO4 solution, where etch pits have been observed, and the sample immersed in solution (H2SO4, 100 mm), characterized by the presence of bulges. The signal intensity drops together with the increase of the acid concentration, suggesting the degradation of the H2TPP macrocycle. In particular, the molecular ion peak intensity in the electrochemically treated sample is very low compared to the pristine and immersed samples.
A detailed description of the results is reported and commented in the Supporting Information, where we prove that even if a 1 mm H2SO4 electrolyte is employed, its effect when aided by electrochemistry is comparable to what observed on the H2TPP/HOPG electrode when simply immersed in solution (H2SO4, 1 m). [11]
2.3. EC‐AFM Analysis of the ZnTPP Sample
In Figure 8, we show the CV acquired on the ZnTPP/HOPG electrode sample immersed inside the electrolyte (H2SO4,1 mm).
Figure 8.
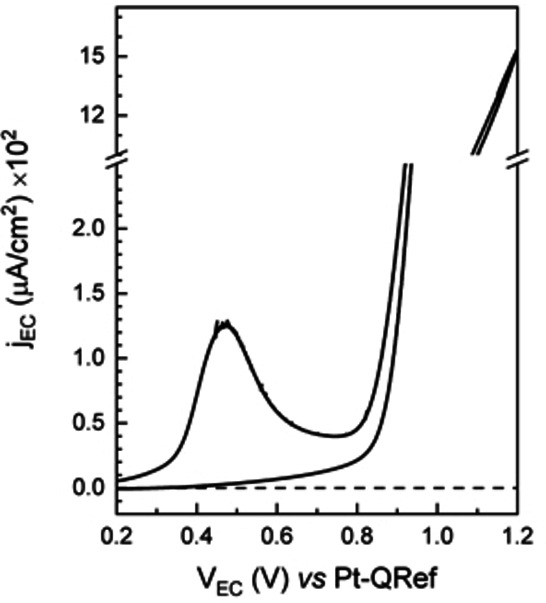
Voltammogram of the ZnTPP/HOPG electrode acquired at a scan speed of 1.5 mV/s in view of following changes on the AFM image, the latter being acquired simultaneously.
A peak is detected at 0.47 V, which has to be related to the ZnTPP oxidation. The exchanged charge is about Q=3 mC. If we consider a single porphyrin oxidation, about 2×10¹⁶ molecules are involved in this charge transfer, i. e. a large enough number of molecules to cover the whole surface considering the molecular packing assumed in Ref. 11 and 25.
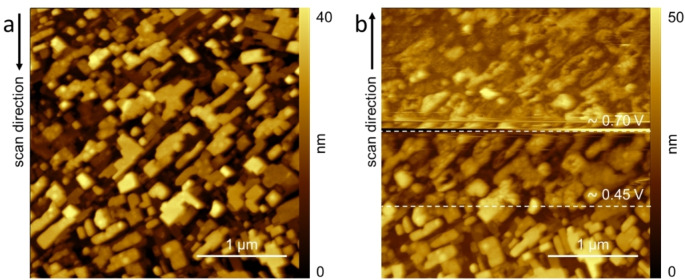
Figure 9a shows the electrode morphology when immersed inside a 1 mm H2SO4 electrolyte at an EC potential of 0.3 V (vs. Pt‐QRef). The surface is characterized by many crystals having sharp edges and angles. The morphology is in close agreement with that one observed on samples only immersed in the acid solution as reported in our previous investigation. [11] This means that crystals are not affected by the acid electrolyte before the oxidation.
Figure 9.
AFM images of the ZnTPP/HOPG electrode when immersed inside the 1 mm H2SO4 electrolyte at (a) 0.3 V (vs Pt‐QRef) and (b) during the CV. In the latter panel, the dashed lines highlight the EC potentials where significant changes in the surface morphology are observed.
In panel b, we report the electrode morphology during the CV (refer to Figure 8). The image is scanned from the bottom to the top. The ZnTPP crystals are stable till around 0.45 V, beyond which the oxidation process starts, causing the surface quality to undergo a clear detriment as a consequence of the evolution of bulges, and an increase of the surface roughness. [11] Interestingly, we observe that no pits are visible on the crystals surface. When the EC potential reaches 0.7 V, that is, when the oxidation process is almost completed, crystals almost disappear: now, the residual 3D structures have not sharp edges, both bulges and pits affect the electrode surface.
From this analysis, we can conclude that ZnTPP crystals, that we demonstrated to be stable even when the sample is immersed in pH=0 solutions, [11] are dissolved in a pH=3 electrolyte as soon as the molecule oxidation is completed. The latter is definitively the driving force of the dissolution process even when metal porphyrins are employed.
3. Conclusions
Nowadays, dissolution process of organic nanocrystals plays a key role in waste treatment and drug delivery, research fields where there is still a lack of experimental data useful for simulations and possible applications. In this context, we studied a prototypical system, namely porphyrin/graphite electrode, and the evolution of the surface morphology during EC processes. Some interesting results were presented and discussed. i) If free‐base porphyrin molecules are involved in the EC investigation, the molecule oxidation is the main mechanism for the nanocrystal dissolution. However, being possible a double oxidation, we exploited an EC‐AFM system to monitor in situ and in real time the crystal evolution matched with both the EC processes. We found that only the second process causes the crystal dissolution. ii) Porphyrin 3D nanocrystals can be completely removed from the electrode surface. iii) Metal (ZnII) porphyrin nanocrystals, stable when immersed in acid solutions even at pH=0, can be dissolved in diluted acid electrolytes if the molecules are oxidized. Oxidation represents the driving force for the nanocrystals detriment. iv) At the end of the crystal dissolution process, the graphite electrode is still protected by a porphyrin film of few layers. This film is able to avoid anion intercalation inside the electrode and an overall detriment of the buried graphite. Finally, in all our experiments, CV analysis seems to be not suitable to highlight the different stages of the dissolution process.
EC techniques must be thus coupled with microscopy‐based ones to analyze the surface morphology.
Experimental Section
Z‐grade HOPG was provided by Optigraph and used as substrate for porphyrin (both H2TPP and ZnTPP) deposition. The substrate surface (about 0.2 cm2) was manually exfoliated before each experiment by using an adhesive tape. A 1 mm sulfuric acid (H2SO4) electrolyte was prepared starting from a concentrated H2SO4 solution (95–97 % w/w, Merck) and de‐aerated by bubbling pure Ar in a Squibb separator funnel for some hours.
Meso‐tetra‐phenyl porphyrin (H2TPP, C44H30N4) and zinc(II) tetra‐phenyl porphyrin (ZnTPP, C44H28N4Zn), provided by Merck (purity >97 %), were outgassed in high vacuum before their use (base pressure in the low 10−6 Torr range) by ramping the temperature up to the sublimation value (about 300 °C).
H2TPP and ZnTPP films were grown by physical vapor deposition (PVD) at a pressure of low 10−5 Torr inside a Kenosistec KE‐500 deposition chamber equipped with four effusive (Knudsen) sources. The sample is placed at 30 cm distance from the Knudsen (K‐) cells and kept at room temperature during the organic film growth. The K‐cells are thermally controlled by a thermocouple inserted inside the crucible. 30–40 mg of the porphyrin powder are loaded into the K‐cell crucible and used for many depositions. A quartz‐crystal microbalance, placed close to the sample, monitors the material flux. The sample thickness (d=20 nominal layers) is the time‐integrated molecular flux. The d value represents a good compromise between a great number of crystals (for statistical analysis) and a thin molecular film. The growth rate was set at 0.4–0.5 Å/s and the source temperature at approximately 350 °C and 370 °C for H2TPP and ZnTPP, respectively, while the substrate was kept at room temperature.
The experimental set‐up is described in detail elsewhere. [14] Briefly, a home‐made Teflon cell is positioned on the prepared sample and filled with the solvent (about 1 ml in volume). [15] A Viton O‐ring avoids leaks in the cell. Three electrodes were mounted in the cell. One of these was the sample itself that represents the working electrode (WE). Two platinum wires were employed as counter (CE) and reference electrode (RE), respectively. More precisely, the latter is a quasi‐reference, because it does not exploit a redox couple. [16] Nonetheless, the platinum quasi‐reference (Pt‐QRef) ensures a good stability (within few mV) when immersed in acid electrolytes and a stable EC potential shift (+740 mV) with respect to the standard hydrogen electrode. [17]
AFM images were collected by a Keysight 5500 model in non‐contact mode, with specific tips (NanoSensors) for tapping measurements. Resonance frequency in liquid was around 130 kHz and images were collected in attractive regime. Images with a scan area of (3×3) μm2 were collected at a frequency of about 1 mHz. The very low scan rate was required to avoid damages of the crystals during the tip scan.
ToF‐SIMS experiments (see Supporting Information) were performed using a customized ToF‐SIMS V instrument (ION‐TOF GmbH, Munster, Germany). A 30 keV bismuth liquid metal ion gun (LMIG) was used as primary ion beam providing Bi, Bi3, Bi3 2+, Bi5 2+. Positive and negative ion mass spectra were acquired with the high‐current bunched mode using Bi3 2+ (target current 0.3 pA). Ion beam dose rates were maintained below the static limit (<5×10¹² ions/cm2) per analysis. The sample was held at room temperature during the ion bombardment. Secondary ions were collected into a two‐stage reflectron ToF analyzer by applying an extraction pulse of 2 kV, and then post‐accelerated to 10 keV. The cycle time of the ToF analyzer was set to 100 μs, allowing the acquisition of the spectra in the mass range 1≤m/z≤850. Negative mass spectra were calibrated using C−, CH−, C2 −, C2H−, C4 −, C6 − peaks, respectively. The resolution achieved (Δm/m) was equal to 12000 at mass 72 (C6). ToF‐SIMS spectra were normalized to the sum of selected peaks characteristic of the porphyrin fragmentation.
An optical set‐up, [18] consisting of (i) a 20 W tungsten halogen lamp enclosed inside a thermal radiator, (ii) an optical fibers bundle to illuminate and collect the reflected light (via a central optical fiber), and (iii) a multi‐channel UV‐vis spectrometer (Hamamatsu), was employed to analyze the electrode surface during and after the CVs.
Conflict of interest
The authors declare no conflict of interest.
Supporting information
As a service to our authors and readers, this journal provides supporting information supplied by the authors. Such materials are peer reviewed and may be re‐organized for online delivery, but are not copy‐edited or typeset. Technical support issues arising from supporting information (other than missing files) should be addressed to the authors.
Supporting Information
Acknowledgements
The EC‐AFM data were collected at the Solid‐Liquid Interface and Nanomicroscopy (SoLINano) lab, which is an inter‐Departmental facility of the Politecnico di Milano.
G. Bussetti, C. Filoni, A. Li Bassi, A. Bossi, M. Campione, A. Orbelli Biroli, C. Castiglioni, S. Trabattoni, S. De Rosa, L. Tortora, F. Ciccacci, L. Duò, ChemistryOpen 2021, 10, 748.
References
- 1. Polprasert C., Organic Waste Recycling. Technology and Management. IWA Publishing, Bangkok, 2007. [Google Scholar]
- 2. Mo J., Yang Q., Zhang N., Zhang W., Zheng Y., Zhang Z., J. Environ. Manage. 2018, 227, 395. [DOI] [PubMed] [Google Scholar]
- 3. Perathoner S., Centi G., Top. Catal. 2005, 33, 1. [Google Scholar]
- 4. Xu J., Huang S., Cai T., Cryst. Growth Des. 2020, 20, 2527. [Google Scholar]
- 5. Fischer C., Lüttge A., PNAS 2018, 115, 897. [DOI] [PMC free article] [PubMed] [Google Scholar]
- 6. Blagden N., de Matas M., Gavan P. T., York P., Adv. Drug Delivery Rev. 2007, 59, 617. [DOI] [PubMed] [Google Scholar]
- 7. Frank F. C., “Growth and Perfection of Crystals”, J. Wiley and Sons, New York, 1958. [Google Scholar]
- 8. Frank F. C., Ives M. B., J. Appl. Phys. 1960, 31, 1996. [Google Scholar]
- 9. Lasaga A. C., Lüttge A., Science 2001, 291, 2400. [DOI] [PubMed] [Google Scholar]
- 10. Lasaga A. C., Blum A. E., Geochim. Cosmochim. Acta 1986, 50, 2363. [Google Scholar]
- 11. Filoni C., Duò L., Ciccacci F., Li Bassi A., Bossi A., Campione M., Capitani G., Denti I., Tommasini M., Castiglioni C., De Rosa S., Tortora L., Bussetti G., ChemNanoMat 2020, 6, 567. [Google Scholar]
- 12. Inisan C., Saillard J.-Y., Guilard R., Tabard A., Le Mest Y., New J. Chem. 1998, 22, 823. [Google Scholar]
- 13. Giraudeau A., Callot H. J., Gross M., Inorg. Chem. 1979, 18, 201. [Google Scholar]
- 14. Jagadeesh M. S., Calloni A., Denti I., Goletti C., Ciccacci F., Duò L., Bussetti G., Surf. Sci. 2019, 681, 111. [Google Scholar]
- 15.We observe that under these experimental conditions, the number of available protons in solution is at least 3 order of magnitude greater than that of the porphyrin molecules deposited on the substrate.
- 16. Ghilane J., Hapiot P., Bard A. J., Anal. Chem. 2006, 78, 6868. [DOI] [PubMed] [Google Scholar]
- 17. Bussetti G., Yivlialin R., Alliata D., Li Bassi A., Castiglioni C., Tommasini M., Casari C. S., Passoni M., Biagioni P., Ciccacci F., Duò L., J. Phys. Chem. C 2016, 120, 6088. [Google Scholar]
- 18. Trabattoni S., Tavazzi S., Yivlialin R., Duò L., Ciccacci F., Bussetti G., Appl. Opt. 2020, 59, 8175. [DOI] [PubMed] [Google Scholar]
- 19. Yivlialin R., Magagnin L., Duò L., Bussetti G., Electrochim. Acta 2018, 276, 352. [Google Scholar]
- 20. Yivlialin R., Brambilla L., Accogli A., Gibertini E., Tommasini M., Goletti C., Leone M., Duò L., Magagnin L., Castiglioni C., Bussetti G., Appl. Surf. Sci. 2020, 504, 144440. [Google Scholar]
- 21. De Rosa S., Bianchini P., Yivlialin R., Duò L., Bussetti G., Tortora L., ACS Appl. NanoMater. 2020, 3, 691. [Google Scholar]
- 22. Yivlialin R., Penconi M., Bussetti G., Orbelli Biroli A., Finazzi M., Duò L., Bossi A., Appl. Surf. Sci. 2018, 442, 501. [Google Scholar]
- 23. Palitiero C., Sobral A., Electrochim. Acta 2005, 50, 2445. [Google Scholar]
- 24. Gouterman M., J. Mol. Spectrosc. 1961, 6, 138. [Google Scholar]
- 25. Bussetti G., Campione M., Riva M., Picone A., Raimondo L., Ferraro L., Hogan C., Palummo M., Brambilla A., Finazzi M., Duò L., Sassella A., Ciccacci F., Adv. Funct. Mater. 2014, 24, 958. [Google Scholar]
Associated Data
This section collects any data citations, data availability statements, or supplementary materials included in this article.
Supplementary Materials
As a service to our authors and readers, this journal provides supporting information supplied by the authors. Such materials are peer reviewed and may be re‐organized for online delivery, but are not copy‐edited or typeset. Technical support issues arising from supporting information (other than missing files) should be addressed to the authors.
Supporting Information


