

Abstract
Objective: To evaluate the efficacy of combined epigenetic drugs of decitabine (DAC), valproic acid (VPA) and trichostatin A (TSA) on immunotherapy with a murine model of hepatocellular carcinoma (HCC). Methods: Dendritic cells (DCs) transduced with recombinant lentivirus expressing a cancer-testis antigen, acrosin binding protein (ACRBP), are referred to as DC/ACRBP. CD8+ T cells were harvested from spleens of C57BL/6 mice and activated by DC/ACRBP. Cytotoxicity of DC/ACRBP-activated T cells was analyzed by cytotoxicity and murine xenograft assays. Results: Cytotoxicity assay results revealed that DC/ACRBP-activated T cells exhibited the highest cytotoxicity against HCC cells pre-treated with triple drugs (DAC+VPA+TSA) compared with dual drugs (DAC+VPA and DAC+TSA) and single drug (DAC, VPA and TSA) respectively. Analyses of RT-PCR and immunoblotting demonstrated that the highest ACRBP expression of HCC cells was induced by the triple drugs compared with the single and dual drugs. These results indicated that DC/ACRBP-activated T cells might be ACRBP-specific lymphocytes, and the augmented cytotoxicity may be dependent on the upregulation of ACRBP expression. These assumptions were further confirmed by xenograft tumor assay. Tumor cells of mice administrated with the triple drugs exhibited increased ACRBP expression compared with those of mice without administration. As expected, DC/ACRBP-activated T cells adopted by mice injected with the triple drugs, compared with those adopted by mice without injection, remarkably impeded growth and facilitated apoptosis of tumor cells. Conclusion: These data suggested that combined treatment with DAC, VPA and TSA may enhance the anti-tumor efficacy of ACRBP-specific T cells by upregulating ACRBP expression in HCC.
Keywords: Decitabine, valproic acid, trichostatin A, acrosin binding protein, cytotoxic T lymphocyte, hepatocellular carcinoma
Introduction
Surgical resection is a traditional treatment of hepatocellular carcinoma (HCC). However, only less than half of patients survived within 5 years after resection [1]. In light of this, adjuvant therapy, such as cellular immunotherapy, is urgently in need and provides a new option for patients with a high risk of recurrence. Cancer-testis antigens (CTAs), encoded by cancer-testis genes, are a subgroup of tumor-associated antigens. They have restricted expression in normal except gametogenic tissues, and re-expression in various tumor types. Such characteristics of CTAs potentiate them as promising immunotherapeutic targets [2].
Although CTA-based immunotherapy has promising clinical efficacy [3,4], it still faces challenges. One of the challenges is inter-tumor heterogeneity of the CTAs expression, which occurs in a variety of cancers including HCC [5-7]. Some HCC patients display high expression of a certain antigen, while others may lack the CTA expression. Particularly, a large number of CTAs are not activated in around 50% of HCC patients [5]. And this may limit CTA-targeted therapeutic response in HCC. Additionally, even for a CTA-positive tumor, CTA expression exhibits a characteristic in common-intra-tumor heterogeneity, leading to attenuated tumor recognition by T cells and decreased efficacy of immunotherapy [4,8]. Since promoter hypomethylation is one of the fundamental mechanisms behind the transcriptional activation of cancer-testis genes [9], DNA methyltransferase inhibitors (DNMTis) are used as a countermeasure to improve the CTAs expression and to reduce the heterogenicity in tumor. One of DNMTis, decitabine (5-aza-2’-deoxycytidine, DAC), has been found to improve the expression of CTAs in various tumor cell lines [10,11], and patients with unresectable liver-predominant metastases [12]. In addition, an increase of CTA expression induced by DAC enhances tumor recognition by T cells in digestive system tumor and myelodysplastic syndrome [10,13]. In comparison with the administration with DAC alone, the combination treatments with DAC and histone deacetylase inhibitors (HDACis), such as valproic acid (VPA) and trichostatin A (TSA), synergistically increase CTAs expression in tumor cell lines [9,14]. Although the synergies of DAC+VPA and DAC+TSA have been demonstrated, to the best of our knowledge, there is a lack of published reports analyzing combined efficacy of DAC+VPA+TSA on CTAs expression in tumor cells. Moreover, evidences provided by Gu et al indicated that VPA and TSA used different mechanisms to demethylate DNA [15], triple combination of DAC, VPA and TSA were therefore used in this assay to analyze the potential overlay performance of VPA and TSA on demethylation.
For CTA-based immunotherapy of HCC, selecting a CTA with a high expression rate in HCC is the crucial first step. ACRBP, also known as OY-TES-1 or CT23, is originally characterized as the human homologue of pro-acrosin binding protein (ACRBP) in mouse, and one of the identified CTAs in human [16]. Its mRNA expression was found in 73% of the HCC specimens in our previous work, indicating a relatively low inter-tumor heterogeneity of ACRBP [17]. Like other CTAs, we also demonstrated that ACRBP was extensively expressed in various cancer types [17-20]. Besides, antibody to ACRBP is detected in sera of patients with a wide array of cancers, including HCC [16-19]. These results revealed an immunogenic nature of ACRBP. Recent work also proved that immunodominant epitopes of ACRBP and synaptonemal complex protein 1 antigens have high efficacy to activate the immune system and anti-tumor prophylactic effects in a murine melanoma model [21]. Furthermore, ACRBP peptide can elicit ACRBP-specific cytotoxic T lymphocyte (CTL) response against ACRBP-expressing cancer cells [22,23]. These findings indicate that ACRBP emerges as a promising target for immunotherapy of cancers. Although DAC treatment can improve CTA-specific CTL response in cancers [10,13], the effect might be limited.
In this study, we evaluated the efficacies of combined epigenetic drugs (DAC+VPA+TSA) on tumor recognition by T cells with an HCC murine model. The epigenetic modifiers were analyzed in groups: single drug of DAC, VPA and TSA respectively; dual drugs of DAC+VPA and DAC+TSA respectively; and triple drugs of DAC+VPA+TSA. We demonstrated that administration of HCC cells with the triple drugs compared with the single drug and the dual drugs, enhances ACRBP-specific cytotoxicity of CTLs by upregulating ACRBP expression in HCC. These results may provide insight for combining epigenetic agents and ACRBP-specific immunotherapy in the HCC treatment.
Material and methods
Tissue samples and cell lines
Eighty-seven HCC samples and corresponding adjacent para-tumor specimens (defined as 5.0 cm distance from tumor edge) [24], were collected with written informed consent from each participating patient according to procedures approved by the Ethics Committee of Taizhou hospital (Zhejiang province, China). Among the samples, 15 cases were removed due to the incomplete follow-up data, leaving 72 cases included. The HCC tissues were classified according to the World Health Organization (WHO) classification criteria [25], and the 8th American Joint Committee on Cancer (AJCC) TNM staging system [26,27], followed by analyses of immunohistochemistry (IHC) and immunoblotting according to the purposes of the study.
Three mouse and two human cell lines were utilized in this investigation. Mouse (C57BL/6) cell lines included HCC cell line Hepa1-6, melanoma cell line B16F10 and dendritic cell line DC2.4 (immature dendritic cell [28]). These cells were generously provided by professor Xiao-ling Lu (National Center for International Research of Biological Targeting Diagnosis and Therapy, Guangxi Medical University, Nanning, Guangxi, P.R. China). Human HCC cell line BEL-7404 and HepG2 were purchased from the Type Culture Collection of Chinese Academy of Science (Shanghai, China). To construct dendritic cells (DCs) that stably expressed ACRBP, LV5-CMV-GFP-EF1a-Puro lentiviral vector (GenePharma, Shanghai, China) carrying a coding sequence of ACRBP (LV-ACRBP) was transduced into DCs (DC/ACRBP) on the presence of polybrene (GenePharma) according to the manufacturer’s instructions. DCs transduced with empty lentiviral vectors (DC/LV) were served as a negative control. All cells were grown in RPMI 1640 (Invitrogen, Shanghai, China) supplemented with 10% fetal bovine serum (FBS; Gibco, Grand Island, NY, USA) and 1% penicillin-streptomycin at 37°C in a humidified atmosphere of 5% CO2 in air.
Transfection
Small interfering RNA (siRNA) against human ACRBP (si-ACRBP, sense: 5’-CGUGGAAGA GCUCCUACAATT-3’; antisense: 5’-UUGUAGGAGCUCUUCCACGTT-3’), and scrambled siRNA (si-NC, sense: 5’-UUCUCCGAACGUGUCACGUTT-3’; antisense: 5’-ACGUGACACGUUCGGAGAATT-3’) were transfected into HCC cells respectively using Lipofectamine 2000 (Invitrogen) following the manufacturer’s manual. Cells supplemented with only Lipofectamine 2000 (WT) were used as control.
Chemicals and drug treatments of cells
Decitabine (DAC, CAS number A3656), valproic acid (VPA, CAS number 99-66-1) and trichostatin A (TSA, CAS number 58880-19-6) were purchased from Sigma-Aldrich Corporation (St Louis, MO, USA). DAC and TSA were dissolved in DMSO to a concentration of 10 mM. Aliquots were stored at -80°C and diluted with medium before used. Drug treatments were divided into seven groups: (1) DAC group: cells were cultured in medium on the presence of 5 μM DAC for 120 h; (2) VPA group: cells were grown in medium containing 0.5 mM or 1 mM VPA for 120 h; (3) TSA group: cells were cultured in medium supplemented with 1 μM or 2 μM TSA for 24 h; (4) DAC+VPA group: cells were cultured with 5 μM DAC and 0.5 mM or 1 mM VPA for 120 h; (5) DAC+TSA group: cells were cultured with 5 μM DAC for 120 h, followed by 1 μM or 2 μM TSA for 24 h; (6) DAC+VPA+TSA group: cells were cultured with 5 μM DAC and 1 mM VPA for 120 h, followed by 2 μM TSA for 24 h; (7) Control group: cells were cultured with 0.09% DMSO, which is the highest concentration of DMSO used in this study in consideration of the potential toxicity of DMSO to living cells.
Immunohistochemistry (IHC) and TUNEL analysis
Immunochemistry was conducted to detect expressions of ACRBP and Ki67 on tissue microarrays or tissue sections as previously described [18]. Anti-ACRBP antibodies (1:50, Santa Cruz Biotechnology, Santa Cruz, CA, USA, sc-390594), anti-Ki67 antibodies (1:200, Abcam, Cambridge, MA, USA, ab15580), anti-CD34 antibodies (1:100, Abcam, ab81289), and anti-AFP antibodies (1:100, Abcam, ab46799) were used as primary antibodies. Isotype-matched antibodies were used as controls. After incubation with the primary antibodies overnight at 4°C, the slides were subsequentially rinsed with PBS, followed by incubation with horseradish peroxidase-conjugated IgG (1:500; Thermo Fisher Scientific, Rockford, IL, USA). The sections were developed by 3,3’-diaminobenzidine according to the supplier’s instructions (Boster, Wuhan, China), and further counterstained by hematoxylin. The slides were next photographed by Olympus BX53 microscope. For integrated optical density (IOD), images of 5 random areas from a section were analyzed by Image-Pro Plus software (version 6.0, Media Cybernetics, MD, USA). The results were expressed as average optical density (AOD = IOD/area). Expressions of ACRBP, Ki67, CD34, and AFP were recorded as follows: AOD ≤ 0.05, “-”; 0.05 < AOD ≤ 0.2, “+”; 0.2 < AOD ≤ 0.5, “++”; AOD > 0.5, “+++”. To analyze correlation of ACRBP expression and clinicopathological features of 72 HCC patients, patients were classified into low ACRBP expression group (AOD ≤ 0.2) and high ACRBP expression group (AOD > 0.2).
In the TUNEL assay, the slides were subjected to the DeadEndTM Fluorometric TUNEL System (Promega, Madison, WI, USA) according to the manufacturer’s protocol. Cells with green fluorescence were considered as apoptotic cells. The numbers of apoptotic cells and total cells were calculated from 5 random microscopic fields per slide at 200 × magnification.
Reverse Transcription PCR (RT-PCR)
Total RNA was purified from cultured cells by E.Z.N.A.® Total RNA Kit I (Omega Bio-Tek, USA) according to the supplier’s protocol. The RNA was quantified, and about 3 μg aliquot was subjected to reverse transcription with the PrimeScript RT-PCR kit (TakaraBio, Incorporation, Japan). The obtained cDNA was subsequently amplified for genes of interest with primers given in supplemental data (Table S1).
Immunoblotting analysis
Cells were lysed in ProteoJET Mammalian Cell Lysis Reagent (Thermo Fisher Scientific) supplemented with complete protease inhibitor mix (Roche, Vienna, Austria). About 25 μg of protein was extracted from each sample, separated by 10% SDS-PAGE and transferred to PVDF membrane. The primary antibodies were as followings: anti-ACRBP antibodies (1:100, Santa Cruz Biotechnology, sc-390594), anti-Ki67 antibodies (1:1000, Abcam, ab16667), anti-caspase-3 antibodies (1:5000, Abcam, ab32351), anti-cyclin E antibodies (1:100, Santa, sc-247), and anti-β-actin antibodies (1:1000, Abcam, ab8226). Blots were developed by 3,3’-diaminobenzidine according to the manufacturer’s protocols (Boster, Wuhan, China). Relative intensities of the bands were analyzed using ImageJ (NIH, Maryland, USA).
CCK-8 assay
Cell proliferation was evaluated using Cell Counting Kit-8 (CCK-8, Sigma-Aldrich) assays under the manufacturer’s instructions. In brief, 4000 cells per well were seeded in 96-well plates in triplicate and cultured in 90 μL DMEM containing 10% FBS. Each well was added 10 μL of CCK-8 solution at indicated time and cells were incubated for another 4 hours. Absorbance at 450 nm were measured via a microplate reader (Bio-Rad Laboratories).
Wound healing assay
Cell migration was assessed by wound healing assay. In short, 2 × 10⁵ cells per well were inoculated into a 24-well plate. After the cells were cultured to 80% confluency, a single-line wound was scratched by on the wells using a 10 μL pipette tip. Cells were then washed with phosphate buffer solution (PBS) to remove the detached cells and incubated with fresh serum-free DMEM medium. Wound width was determined 0 h, 12 h and 24 h after the scratch was made. Wound closure was determined as: [wound width (0 h) - wound width (12 h/24 h)]/wound width (0 h) × 100%.
Transwell invasion and migration assays
Transwell assay was used to measure cell invasion. For invasion analysis, briefly, 1 × 10⁵ cells per well were seeded into the upper chamber pre-coated with Matrigel (BD Biosciences, Bedford, MA, USA), and were cultured in DMEM containing 1% FBS. The lower chamber was filled with DMEM supplemented with 10% FBS. After incubation for 24 h, the cells in the upper chamber were removed using a cotton swab. And cells in the down chamber were fixed with 90% and stained with 1% crystal violet (Sigma-Aldrich) for 15 min. Cell number was counted by a light microscope. For migration assay, similar protocol with invasion analysis was followed excluding the coating of chamber with Matrigel.
Pyrosequencing
Genomic DNA was extracted from cells and subjected to bisulfite conversion thermal cycles. The PCR product was purified and eluted in 15 μL of elution buffer, followed by biotinylation and immobilization to streptavidin-coated agarose beads (MAg25K/Streptavidin, Enriching Beads®, Shanghai, China). The beads were then gently released to annealing buffer containing 0.4 µM sequencing primers at 80°C for 2 min. After cooling down to room temperature, pyrosequencing was conducted using a PyroMark Q96 MD instrument (Qiagen) under the supplier’s instructions. The output data were analyzed by the accompanying software (Qiagen). For the ACRBP gene in Hepa1-6 cells, five CpGs and three CpGs in promoter were examined, respectively. For the ACRBP gene in cell line HepG2, four CpGs were tested. Primers used in pyrosequencing were provided in supplemental data (Table S1).
Flow cytometry
To evaluate expressions of surface markers, cells were harvested, washed by phosphate-buffered saline and resuspended in saturating concentrations of monoclonal antibodies or isotype-matched control antibodies (Table S2) overnight at 4°C. The cells were then harvested, washed by PBS buffer for 3 times, and analyzed by FACScan flow cytometer (BD Biosciences, Franklin Lakes, NJ, USA) using BD Accuri™ C6 Software (BD Biosciences). For cell apoptosis assay, an Annexin V-FITC apoptosis kit (Cambridge, MA) was employed according to the manufacturer’ s instructions. The stained samples were then analyzed with the FACScan flow cytometer within 20 min. To determine the cell cycle phase, cell cycle analysis Kit (Biyuntian, Jiangsu, China) and flow cytometer were used according to the supplier’s manuals. To characterize DC/ACRBP, immunophenotypes of DCs incubated with IFN-γ (R&D Systems, Minneapolis, MN) and lipopolysaccharide (Sigma, Saint Louis, MO) were used as a positive control.
Stimulation of CD8+ T cells with DCs
To obtain CD8+ T cells from spleen of mouse C57BL/6, purification was performed with a CD8+ T cell isolation kit (Miltenyi Biotec, Bergisch Gladbach, Germany) according to the manufacturer’s instructions. The purified cells were subjected to flow cytometry to analyze the percentage of CD8+ T cells with an anti-mouse CD8α antibody (Table S2). A total of 106 T cells were next incubated with DCs (107 cells) for 7 days supplemented with 0.5 ng/ml rat interleukin-2 (IL-2, BD Biosciences, San Jose, CA). The T cells were re-stimulated with fresh DCs every 7 days for 2 more times. On day 7, during the last stimulation, the cells were harvested for further studies.
Enzyme-linked immunosorbent assay (ELISA)
To test expressions of secreted cytokines, DCs (1 × 10⁷) were cultured in 25 cm2 flasks with 3 mL medium for 48 hours before the supernatants were collected. For CD8+ T cells, supernatants were harvested after the last round of stimulation. Productions of IFN-γ, IL-2, IL-6, IL-12, TNF-α, Granzyme B and Perforin were determined using commercially available ELISA kits (Cloud-Clone Corporation, Wuhan, China) according to the manufacturer’s protocol. The expression level of IL-2 was calculated as “expression level = level measured by ELISA - level supplemented in the medium”.
Cytotoxicity assay
Cytotoxic activity of each T cell population was determined using a DELFIA EuTDA cytotoxicity kit (Perkin-Elmer Life Sciences, Norwalk, CT, USA) according to the manufacturers’ instruction. In brief, target cells (5 × 10³) were first co-cultured with BATDA Reagent to allow penetrations of fluorescence ligands into the cells. The cells were then incubated with CD8+ T cells at different E:T ratios for 2 h. The supernatant of mixture was next transferred and incubated with Europium Solution for 15 min. Fluorescent signals of EuTDA were collected using the Time-resolved fluorometer (model of synergyH1, Biotek Instruments, Incorporation). And the percentage of specific lysis was calculated with the following formula: [(experimental release - spontaneous release)/(maximum release - spontaneous release)] × 100. To analyze whether the cytotoxicity of CD8+ T cells was a major histocompatibility complex class I (MHC-I)-restricted, monoclonal anti-MHC class I antibody (ab25590, Abcam) was applied in the system to block the recognition of antigen.
In vivo xenograft tumor model
Four-week-old BALB/c nude female mice were provided by the Guangxi Laboratory Animal Center (Guangxi, China). Mice were housed at 24 ± 1°C in a light-controlled room (light: 7:00-19:00 h, dark: 19:00-7:00 h) and maintained under specific pathogen-free conditions. All protocols followed the National Research Council guide for the care and use of laboratory animals, and were approved by the Animal Ethics Committee of Guangxi Medical University.
To develop a xenograft model, mice were inoculated as previously described [29]. In brief, a total of 1 × 10⁵ Hepa1-6 cells were pretreated with drugs (5 μM DAC, 1 mM VPA and 2 μM TSA) and were inoculated into flanks of the mice subcutaneously (5 mice per group). The mice were then simultaneously received intraperitoneal injections of 1 × 10⁸ CD8+ T cells and PBS, respectively [29]. Two days post-inoculation, the combined drugs (0.4 mg/kg DAC, 100 mg/kg VPA and 0.5 mg/kg TSA) were applied peritumorally. And tumor volumes were measured simultaneously with a caliper every other day. Mice were sacrificed by euthanasia when visibly ill. To avoid potential tumor suppression of the drugs, mice receiving no drug were included as a control. The tumor volumes were calculated using the formula: tumor volume = [(width2 × length)/2].
Statistical analysis
Statistical analyses were performed using SPSS software (version 25.0, IBM, Armonk, NY), R software (version 3.5.0, R Core Team, 2018) and GraphPad Prism 6 software (La Jolla, CA, USA). The statistical analysis of expression frequencies of ACRBP and contingency tables were performed by Chi-square test or Mann-Whitney U test. For Kaplan-Meier survival analysis, log-rank test was conducted to compare the difference. Differences in cell malignant behaviors, and expressions of capspase-3 and cyclin E were analyzed by either one-way or two-way ANOVA. Differences in methylation levels were compared using either repeated measures ANOVA or paired samples t-test. To compare secreted cytokines of cells, either Friedman test or repeated measures ANOVA was employed. ACRBP expression of cells that were pretreated by drugs, cytotoxicity of CD8+ T cells and growth of tumors in mice were statistically studied by Kruskal-wails H test. Exact p-values for pairwise comparisons of Friedman rank sums were implemented as previously described [30]. Data were collected from at least three independent experiments. Unless otherwise indicated, data are presented as mean ± SE (standard error). Results were considered significant at *, P < 0.05; **, P < 0.01, ***, P < 0.001. ****, P < 0.0001.
Results
High ACRBP expression correlated with advanced HCC and poor overall survival of HCC patients
To understand the expression profile of ACRBP in HCC, immunohistochemistry (IHC) was used to evaluate the protein level of ACRBP in 72 pairs of HCC specimens and their corresponding para-tumor tissues. The results showed that ACRBP was expressed in 67/72 (93.0%) cases of HCC tissues and 58/72 (80.5%) cases of para-tumor tissues, respectively (Figure 1A). Besides, the result revealed a prominently increased expression level of ACRBP in cancerous tissues compared with that of the para-tumor tissues (P < 0.0001) (Figure 1B). A color scheme exhibited expression patterns of ACRBP in tumor and para-tumor tissues, suggesting inter-tumor heterogeneity of ACRBP expression in HCC (Figure 1B). Comparatively, intra-tumor heterogeneity of ACRBP expression was illustrated in Figure 1C, as cells in one section showed different levels of IHC signal intensities. Furthermore, ACRBP expression was higher in high-grade HCC tissues than in low-grade HCC tissues (Figure 1C and Table 1). Kaplan-Meier’s analysis revealed that high ACRBP expression was correlated with poor overall survival of HCC patients (Figure 1D). By analyzing the potential correlation between ACRBP expression and clinicopathologic characteristics of patients, significant associations were found between ACRBP expression and tumor diameter, WHO grade, T-stage and AJCC stage (Table 1). However, ACRBP was not an independent risk factor for the overall survival of patients by the Cox proportional hazards regression model (Figure 1E).
Figure 1.

Expression and prognostic values of ACRBP in HCC. A. Percentages of ACRBP-positive tissue specimens. B. IHC analysis of ACRBP expression in 72 pairs of HCCs and their neighboring para-tumor tissues. AOD, average optical density (as described above in “Materials and methods”). C. Representative IHC images of ACRBP expression in HCC tissues and paired para-tumor tissues. D. Kaplan-Meier survival analysis of 72 HCC patients according to ACRBP expression. E. Univariable and multivariable analyses of overall survival of HCC patients by the Cox proportional hazards regression model. *, P < 0.05.
Table 1.
Correlation between ACRBP protein expression and clinicopathologic characteristics of HCC patients
| Characteristic | Cases (72) | Low expression | High expression | P-value | ||
|---|---|---|---|---|---|---|
|
|
|
|||||
| No | % | No | % | |||
| Age (years) | 0.876 | |||||
| ≤ 53 | 33 | 9 | 47.4 | 24 | 45.3 | |
| > 53 | 39 | 10 | 52.6 | 29 | 54.7 | |
| Gender | 0.890 | |||||
| Male | 65 | 17 | 89.5 | 48 | 90.6 | |
| Female | 7 | 2 | 10.5 | 5 | 9.4 | |
| Cirrhosis | 0.821 | |||||
| Positive | 25 | 7 | 36.8 | 18 | 34.0 | |
| Negative | 47 | 12 | 63.2 | 35 | 66.0 | |
| Tumor diameter (cm) | 0.000 | |||||
| < 4 | 17 | 7 | 36.8 | 10 | 18.9 | |
| 4-10 | 34 | 7 | 36.8 | 27 | 50.9 | |
| > 10 | 21 | 5 | 26.3 | 16 | 30.2 | |
| Tumor number | 1.000 | |||||
| Single | 66 | 17 | 89.5 | 49 | 92.5 | |
| Multiple | 6 | 2 | 10.5 | 4 | 7.5 | |
| WHO grade | 0.009 | |||||
| l | 10 | 6 | 31.6 | 4 | 7.5 | |
| ll/lll | 62 | 13 | 68.4 | 49 | 92.5 | |
| CD34 expression | 0.379 | |||||
| -/+ | 10 | 1 | 5.3 | 9 | 17.0 | |
| ++/+++ | 62 | 18 | 94.7 | 44 | 83.0 | |
| Ki67 expression | 0.850 | |||||
| -/+ | 24 | 6 | 31.6 | 18 | 34.0 | |
| ++/+++ | 48 | 13 | 68.4 | 35 | 66.0 | |
| AFP expression | 0.488 | |||||
| -/+ | 39 | 9 | 47.4 | 30 | 56.6 | |
| ++/+++ | 33 | 10 | 52.6 | 23 | 43.4 | |
| T-stage | 0.000 | |||||
| T1 | 8 | 2 | 10.5 | 6 | 11.3 | |
| T2 | 24 | 8 | 42.1 | 16 | 30.3 | |
| T3 | 37 | 8 | 42.1 | 29 | 54.7 | |
| T4 | 3 | 1 | 5.2 | 2 | 3.7 | |
| N-stage | 0.736 | |||||
| N0 | 71 | 19 | 100.0 | 52 | 98.1 | |
| N1 | 1 | 0 | 0.0 | 1 | 1.9 | |
| M-stage | 0.736 | |||||
| M0 | 71 | 19 | 100.0 | 52 | 98.1 | |
| M1 | 1 | 0 | 0.0 | 1 | 1.9 | |
| AJCC stage | 0.000 | |||||
| I | 8 | 2 | 10.5 | 6 | 11.3 | |
| II | 26 | 8 | 42.1 | 18 | 34.0 | |
| III | 36 | 9 | 47.4 | 27 | 50.9 | |
| IV | 2 | 0 | 0.0 | 2 | 3.8 | |
Downregulation of ACRBP expression attenuated the malignant behaviors of HCC cells in vitro
High expression of ACRBP related to poor prognosis in patients with HCC. To understand the potential role of ACRBP in HCC, HCC cells (BEL-7404 and HepG2) were transfected with ACRBP-specific siRNA and were subjected to CCK-8 assay. The results showed that the reduced expression of ACRBP repressed the proliferation of HCC cells (Figure 2). Flow cytometry analysis and transwell assay of BEL-7404 cells demonstrated that knockdown of ACRBP expression significantly induced cell apoptosis and G0/G1 arrest, and impeded cell migration and invasion (Figure S1). Immunoblotting analysis further showed that the suppression of ACRBP expression remarkably increased expression of caspase-3, an effector of apoptosis, and decreased expression of cyclin E, a regulator of cell cycle (Figure S1). And these data confirmed our previous findings that downregulation of ACRBP expression in HCC cells (BEL-7404 and HepG2) facilitated apoptosis and cycle arrest, and suppressed cell proliferation, migration and invasion [31]. In short, high ACRBP expression might promote malignant behaviors of HCC cells and thereby indicate poor prognosis in HCC patients.
Figure 2.
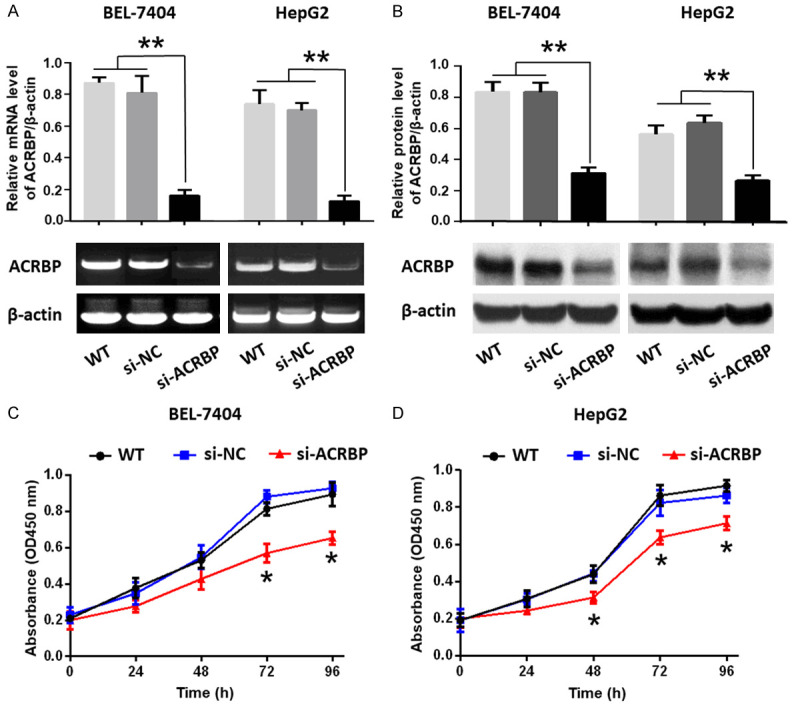
Downregulation of ACRBP by siRNA suppressed the proliferation of BEL-7404 and HepG2 cells. (A) ACRBP mRNA expression was studied by RT-PCR (lower panels) and displayed as relative level of ACRBP/β-actin (upper panels). (B) Protein expression of ACRBP was analyzed by immunoblotting (lower panels) and displayed as relative level of ACRBP/β-actin (upper panels). (C and D) Proliferation of BEL-7404 cells (C) and HepG2 cells (D) were analyzed by CCK-8 assay. *, P < 0.05; **, P < 0.01.
Combination treatment with DAC, VPA and TSA increased expressions of ACRBP and MHC I in murine tumor cells
High expression of ACRBP in HCC tissues indicated ACRBP was a potential target for immunotherapy of HCC. The potency of ACRBP to induce antigen-specific CTLs was evaluated in this study. To test potential cytotoxicity of CTLs, murine HCC cell line Hepa1-6 and melanoma cell line B16F10 were used as target cells.
As aforementioned, ACRBP expression in HCC exhibited inter-tumor and intra-tumor heterogeneity. To decrease heterogeneity and to enhance anti-tumor efficacy of antigen-specific CTLs, epigenetic drugs might be used as a strategy [9,10,13,14]. In light of this, DAC, VPA and TSA, singly and jointly were employed to treat the target cells. As illustrated in Figure 3A-C, Hepa1-6 and B16F10 cells treated with 3 combined drugs of DAC, VPA and TSA (referred to as “triple drugs” below) exhibited the highest mRNA and protein expression of ACRBP when compared with that of cells treated with single and dual drugs respectively. This result indicated a synergistic effect of the triple drugs on ACRBP expression. Similar results were obtained from the human HCC cell line HepG2 (Figure S2).
Figure 3.

Triple-drug treatment significantly upregulated expressions of ACRBP and MHC-I in tumor cells. (A and B) ACRBP mRNA expression was detected by RT-PCR (left panels) and are depicted relative to β-actin expression levels (right panels) in Hepa1-6 (A) and B16F10 (B) cells after different drug treatments. (C) Protein expression of ACRBP was analyzed by immunoblotting in Hepa1-6 cells pre-treated with different drugs. Left panel, demonstration of ACRBP protein levels; right panel, the relative expression of ACRBP was quantified by ImageJ and normalized to β-actin. (D) More MHC-I molecules were determined by flow cytometry when the target cells were incubated with the triple drugs as compared with that of cells treated with DAC only. D, 5 μM DAC; 0.5 V, 0.5 mM VPA; 1 V, 1 mM VPA; 1 T, 1 μM TSA; 2 T, 2 μM TSA. TSS, transcription start site. *, P < 0.05. Different letters indicate significant differences (Kruskal-Wallis test; P < 0.05).
Since the MHC-I molecule is critical for presenting antigen to CD8+ T cells, and reduced MHC-I expression is frequently observed in tumors [32,33], we then examined whether the triple-drug treatment increased MHC-I expression of target cells. Data showed that a higher level of MHC-I expression was induced by the triple-drug treatment than the DAC treatment only (Figure 3D).
ACRBP expression was partly regulated by promoter demethylation
Since combined treatment with demethylation agent DAC and HDACis enhanced ACRBP expression, and activation of genes is closely related to promoter hypomethylation [34], pyrosequencing was next used to analyze methylation state of ACRBP promoter in Hepa1-6 cells after the drug treatments. As illustrated in Figure S3A, overall methylation of 5 CpG sites in the promoter exhibited a significant downregulation when cells were administrated with the triple drugs compared with the control group. To further analyze whether the upregulation of ACRBP expression is due to the downregulation of promoter methylation, we next tested the methylation state of ACRBP promoter in Hepa1-6 and HepG2 cells after the treatments with DAC alone and the triple drugs, respectively. As shown in Figure S3B, S3C, significant demethylation of ACRBP promoter was detected in both cell lines after the drug administrations. However, lower methylation levels of ACRBP promoter were observed when the cells were treated with DAC only compared with the triple drugs. These results suggested the upregulation of ACRBP expression induced by the triple-drug administration was associated with but not fully via the demethylation of ACRBP promoter.
Combination treatment of target cells with triple drugs enhanced cytotoxicity of DC/ACRBP-activated CD8+ T cells in vitro
As DCs are the most effective antigen-presenting cells, DC2.4 was used to elicit ACRBP-specific CTLs. ACRBP expression of DC/ACRBP (as described in “Materials and methods” previously) was confirmed by RT-PCR and immunoblotting (Figure S4A and S4B). Immunophenotypic and cytokine secretion analyses were performed to characterize DC/ACRBP (Figure S4C and S4D). These results showed that DC/ACRBP (but not DC/LV and untreated DCs) was mature DC cell line.
The percentage of CD8+ T cells isolated from murine spleen was first examined (Figure 4A). To determine whether DC/ACRBP could induce the formation of CD8+ CTLs, flow cytometry and ELISA assays were performed to analyze the expressions of immunomarkers of the DC-stimulated CD8+ T cells. As shown in Figure 4B, DC/ACRBP-activated CD8+ T cells (referred to as “ACRBP-activated T cells” below) expressed more CD107a, Granzyme B, Perforin, IFN-γ, and IL-2 than those of untreated T cells and T cells stimulated by DC/LV (collectively referred to as “control T cells” below). These data suggested the co-culture of CD8+ T cells with DC/ACRBP enhanced the proportion of CD8+ CTLs in vitro.
Figure 4.

Triple-drug administration sensitized tumor cells to cytotoxicity of ACRBP-activated T cells. (A) Flow cytometry was employed to determine the positive rate of purified CD8+ T cells. (B) Flow cytometry and ELISA analyses were performed to analyze the cytokines expression of DC-stimulated CD8+ T cells. (C, E) EuTDA cytotoxicity assay was conducted to analyze anti-tumor activities of differently treated CD8+ T cells against Hepa1-6 (C) and B16F10 (E) cells. (D, F) A histogram is used to show the cytolytic activity of ACRBP-activated T cells against Hepa1-6 (D) and B16F10 (F) cells. (G and I) Cytotoxicity of CD8+ T cells against Hepa1-6 (G) and B16F10 (I) cells was MHC-I-restricted. (H and J) Anti-MHC-I antibody blocked the anti-tumor activity of ACRBP-activated T cells against Hepa1-6 (H) and B16F10 (J) cells. DAC, target cells were treated with 5 μM DAC; DAC+VPA, target cells were treated with 5 μM DAC and 1 mM VPA; DAC+VPA+TSA, target cells were treated with 5 μM DAC, 1 mM VPA and 2 μM TSA. *, P < 0.05; **, P < 0.01. Different letters indicate differences (Kruskal-Wallis test; P < 0.05).
To further study whether the induced CD8+ CTLs are able to recognize ACRBP-expressing target cells, an EuTDA nonradioactive cytotoxicity assay was next performed. As illustrated in Figure 4C, ACRBP-activated T cells compared with control T cells exhibited elevated cytotoxic activity against Hepa1-6 cells pre-treated with the triple drugs and DAC+VPA, respectively. By contrast, the cytolytic activity of ACRBP-activated T cells showed no difference compared with those of control T cells when tumor cells were treated with DAC only. Since treatment with triple drugs and DAC+VPA compared with DAC only, induced significantly higher ACRBP expression (Figure 3A-C), these results indicated that ACRBP-activated T cells were ACRBP-specific CTLs.
Notably, under the effector/target (E/T) ratio of 50:1, the ACRBP-specific CTLs exhibited remarkably increased anti-tumor activity against Hepa1-6 cells pre-treated with triple drugs compared with DAC+VPA (Figure 4D). Similar results were observed for cell line B16F10 (Figure 4E and 4F). As triple drugs compared with DAC+VPA synergistically enhanced ACRBP expression in target cells (Figure 3A-C), these findings suggested that the administration of triple drugs compared with DAC+VPA, significantly augmented cytotoxicity of ACRBP-specific CTLs through increasing ACRBP expression of tumor cells.
To investigate whether the anti-tumor activity of CTLs was dependent on expression of MHC-I on tumor cells, anti-MHC-I antibody was used in the cytotoxicity assay. The result showed that the anti-MHC-I antibody substantially blocked the cytotoxic lysis of target cells in vitro (Figure 4G-J), indicating recognition of tumor cells by ACRBP-specific CTLs was MHC-I-restricted.
ACRBP-specific CTLs inhibit growth and facilitate apoptosis of ACRBP-expressing Hepa1-6 cells in vivo
To further verify the cytolytic capacity of ACRBP-specific CTLs in vivo, a xenograft model was developed as previously described [29]. As shown in Figure 5A, 5B, mice receiving the ACRBP-specific CTLs displayed substantial decreases in tumor volume and tumor weight, compared with those of the mice receiving PBS and control T cells, respectively. Since ACRBP expression was detected in all tested samples by IHC and immunoblotting (Figure 5C, 5D, 5G, 5H), the loss of tumor volume and tumor weight might result from the cytotoxicity of ACRBP-specific CTLs. Additionally, tumors of mice injected with the triple drugs peritumorally showed upregulated expression of ACRBP, as compared with those of mice without the drug treatment (Figure 5C, 5D, 5G, 5H), indicating triple-drug administration might upregulate the expression of ACRBP in tumors. To evaluate the cell proliferation in tumors, Ki67 expression was determined by IHC and immunoblotting analyses. As shown in Figure 5E-H, Ki67 was expressed more in tumors of mice injected respectively with PBS and control T cells, as compared with that in tumors of mice injected with ACRBP-specific CTLs. These results demonstrated that ACRBP-specific CTLs decreased the in vivo propagation of tumors. As expected, the result of TUNEL assay revealed that the TUNEL-positive cells were significantly more in tumors of mice treated with ACRBP-specific CTLs than that in tumors of mice treated respectively with control T cells and PBS (Figure 5I and 5J). These data demonstrated that ACRBP-specific CTLs facilitated the apoptosis of tumor cells in vivo.
Figure 5.

ACRBP-specific CTLs inhibited the in vivo growth and facilitated the apoptosis of Hepa1-6 cell-derived tumors. (A) Tumor growth was suppressed by the adoptive transfer of ACRBP-specific CTLs. (B) Tumor weight was decreased in mice receiving ACRBP-specific CTLs. (C-F) IHC analysis of ACRBP (C and D) and Ki67 (E and F) expression in tumor xenografts. (C and E) Representative images of immunohistochemical staining of ACRBP (C) and Ki67 (E). (D and F) ACRBP (D) and Ki67 (F) expressions in different tumors of mice. (G and H) Immunoblotting analysis of ACRBP and Ki67 expressions in tumor xenografts. (G) Representative images of Ki67 and ACRBP protein levels. (H) Relative expression levels of Ki67 (left panel) and ACRBP (right panel) are presented as protein/β-actin ratios. (I and J) TUNEL analysis of cell apoptosis in tumor xenografts. (I) Representative images of apoptotic cells in tumors. Scale bar, 10 μm. (J) Quantification of apoptotic cells. PBS, mice injected with PBS; T, mice inoculated with untreated CD8+ T cells; T+DC/LV, mice inoculated with CD8+ T cells stimulated by DC/LV; T+DC/ACRBP, mice injected with CD8+ T cells activated by DC/ACRBP. “+”, mice received triple drugs peritumorally; “-”, mice administrated without drugs. *, P < 0.05; **, P < 0.01; ***, P < 0.001; ****, P < 0.0001.
Notably, for mice receiving ACRBP-specific CTLs, tumors inoculated with triple drugs expressed higher levels of ACRBP (Figure 5C, 5D, 5G, 5H) and displayed smaller tumor masses, lighter tumor weight, more retarded cell growth and facilitated cell apoptosis, as compared with those of tumors without the drug treatment (Figure 5A, 5B, 5E-J). These data further confirmed the previous observation that triple-drug treatment improved the anti-tumor activity of ACRBP-specific CTLs by enhancing ACRBP expression of tumor cells.
Discussion
In this study, ACRBP-overexpressing dendritic cells induce ACRBP-specific CD8+ CTLs. The activity of the CTLs is upregulated by the combined treatment with DAC, VPA and TSA through synergistically enhancing the ACRBP expression in murine tumor cells. These results suggest ACRBP represents a promising target for immunotherapy of HCC and the triple drugs might serve as a potential adjuvant to increase anti-tumor efficacy in antigen-specific immunotherapy.
The results of the IHC analysis with 72 pairs of HCC specimens support ACRBP as a candidate for CTA-based immunotherapy, as the expression rate of ACRBP reaches 93%. Although a previous study reported that a positive rate of ACRBP mRNA expression in liver cancer was only 40% [16], this result was based on a limited sample number (5 cases only). Therefore, the result is less representative. High expression of ACRBP in HCC was associated with poor overall survival of HCC patients. And this is in accordance with the previous reports that high expressions of CTAs, such as NY-ESO-1 and PRAME, suggested an unfavorable prognosis in tumors [35,36].
Downregulation of ACRBP expression might suppress the malignant behaviors of HCC by downregulating Nanog expression of HCC cells [37]. The results of oligonucleotide microarray showed that Nanog expression was repressed after ACRBP was knocked down by siRNA in BEL-7404 cells [37]. Furthermore, Nanog was predicted to interact with ACRBP according to the Kazal-2 motif of Nanog protein [37]. Since Nanog regulates self-renewal of cancer stem cells and affects the malignant behaviors of HCC [38], ACRBP might exert its role partially by influencing Nanog.
The heterogenic expression of ACRBP shown in this study is consistent with previous findings regarding other CTAs [6]. To decrease heterogeneity, for the first time, combined treatment with DAC, VPA and TSA is demonstrated to synergistically upregulate ACRBP expression in murine HCC tumor cells. One of the mechanisms behind the synergy of DAC and HDACis, is that HDACis directly change demethylase activity or remodel a chromatin structure by increasing the histone acetylation [39]. It was also proposed that HDACis might destabilize the activity of DNA methyltransferase 1 (DNMT1) by targeting histone deacetylase 1 (HDAC1) [40,41]. Our results also show that ACRBP expression is affected but not fully regulated by hypomethylation. The regulation might involve other mechanisms, including the pre-transcriptional bindings of transcription factors to promoter, or post-transcriptional bindings of miRNAs to 3’-UTR (untranslated region) of mRNA [42]. In fact, DNA methylation, transcription factor and miRNA may participate in processes which interplay and collectively exert influence on the regulation of gene expression [43-45].
Results of cytotoxicity assay indicated that the triple drugs may promote the tumor recognition by ACRBP-activated T cells via increment of ACRBP expression in HCC cells, and by upregulation of MHC-1 expression in both HCC and dendritic cells. The enhancement of the cytotoxicity of ACRBP-activated T cells was in proportion to the upregulation of ACRBP expression induced by triple drugs in HCC cells. However, increment of ACRBP expression in HCC cells did not affect the cytolytic capacity of DC/LV-stimulated T cells. These data suggest that ACRBP-activated T cells is ACRBP-specific lymphocytes, and the triple drugs may synergize the ACRBP-specific immunotherapy by upregulation of ACRBP. In fact, expression of MHC-I induced by the triple drugs in both HCC and dendritic cells, could also increase antigen presentation and thereby enhance the cytotoxicity of ACRBP-specific CTLs in HCC. And this is in accordance with previous observations [12].
Results of the xenograft study further confirm the findings of cytotoxicity assay. The data demonstrated that topical delivery of epigenetic drugs to the tumors enhanced the anti-tumor activity of ACRBP-activated T cells by upregulating the ACRBP expression in HCC cells. In fact, four months were sufficient for DAC treatment to improved CTA-specific CTL recognition via the up-regulation of CTAs in patients [13]. Accordingly, although high expression of ACRBP in HCC might predict poor overall survival, triple drugs still show promising potential as an adjuvant to the ACRBP-specific immunotherapy against HCC for several months, rather than years. ACRBP expression was detected in tumor cells 14 days after the triple-drug administration of the cells in vitro. This observation is consistent with the previous data that induction of CTA expression in tumor cells by demethylation agent is heritable [46].
Mounting evidence showed that epigenetic drugs were used as anti-tumor drugs alone or in combination with other therapies for solid tumors [47,48]. In this study, the results of xenograft tumor assay indicated that current dose of triple drugs may not have anti-tumor efficacy alone. The drugs only synergize the ACRBP-specific immunotherapy by enhancing ACRBP and MHC-I expression. To analyze the potential anti-tumor activity of the triple drugs, a gradient concentration could be used in cytotoxicity assay to optimize the dosing in future work.
In summary, we show that DAC, VPA and TSA synergistically upregulate the ACRBP expression in murine tumor cells, thereby enhancing the ACRBP-specific tumor recognition by T cells.
Acknowledgements
This work was supported by National Natural Science Foundation of China (Grant No. 81960453, 81860445 and 81560408), Natural Science Foundation of Guangxi (Grant No. 2018GXNSFBA281187, 2018GXNSFAA281251, and 2018GXNSFAA050058), Basic Ability Improvement Project for Young and Middle-aged Teachers in Colleges and Universities of Guangxi (grant No. 2018KY0109), Science and Technology Innovation Cultivation Project of Pre-clinical School in Guangxi Medical University (GXMUBMSTCF-G11 and GXMUBMSTC-T07), and Key Laboratory of Early Prevention and Treatment for Regional High Frequency Tumor (Guangxi Medical University) and Ministry of Education (Grant No. GKE2019-08 and GKE-ZZ202006). We thank professor Xiao-Ling Lu (National Center for International Research of Biological Targeting Diagnosis and Therapy, Guangxi Medical University, Nanning, Guangxi, P.R. China) for generously providing cell lines. We thank Dr. Li Xi-Sheng (Department of Neurosurgery, The People’s Hospital of Guangxi Zhuang Autonomous Region, P. R. China) for his help in xenograft tumor assay.
Disclosure of conflict of interest
None.
Supporting Information
References
- 1.Wang XH, Long LH, Cui Y, Jia AY, Zhu XG, Wang HZ, Wang Z, Zhan CM, Wang ZH, Wang WH. MRI-based radiomics model for preoperative prediction of 5-year survival in patients with hepatocellular carcinoma. Br J Cancer. 2020;122:978–985. doi: 10.1038/s41416-019-0706-0. [DOI] [PMC free article] [PubMed] [Google Scholar]
- 2.Caballero OL, Chen YT. Cancer/testis (CT) antigens: potential targets for immunotherapy. Cancer Sci. 2009;100:2014–2021. doi: 10.1111/j.1349-7006.2009.01303.x. [DOI] [PMC free article] [PubMed] [Google Scholar]
- 3.Ishihara M, Tono Y, Miyahara Y, Muraoka D, Harada N, Kageyama S, Sasaki T, Hori Y, Soga N, Uchida K, Shiraishi T, Sato E, Kanda H, Mizuno T, Webster GA, Ikeda H, Katayama N, Sugimura Y, Shiku H. First-in-human phase I clinical trial of the NY-ESO-1 protein cancer vaccine with NOD2 and TLR9 stimulants in patients with NY-ESO-1-expressing refractory solid tumors. Cancer Immunol Immunother. 2020;69:663–675. doi: 10.1007/s00262-020-02483-1. [DOI] [PMC free article] [PubMed] [Google Scholar]
- 4.Al-Khadairi G, Decock J. Cancer testis antigens and immunotherapy: where do we stand in the targeting of PRAME? Cancers (Basel) 2019;11:984. doi: 10.3390/cancers11070984. [DOI] [PMC free article] [PubMed] [Google Scholar]
- 5.Seifi-Alan M, Shamsi R, Ghafouri-Fard S. Application of cancer-testis antigens in immunotherapy of hepatocellular carcinoma. Immunotherapy. 2018;10:411–421. doi: 10.2217/imt-2017-0154. [DOI] [PubMed] [Google Scholar]
- 6.Luo G, Huang S, Xie X, Stockert E, Chen YT, Kubuschok B, Pfreundschuh M. Expression of cancer-testis genes in human hepatocellular carcinomas. Cancer Immun. 2002;2:11. [PubMed] [Google Scholar]
- 7.Liu J, Dang H, Wang XW. The significance of intertumor and intratumor heterogeneity in liver cancer. Exp Mol Med. 2018;50:e416. doi: 10.1038/emm.2017.165. [DOI] [PMC free article] [PubMed] [Google Scholar]
- 8.Salinas RD, Durgin JS, O’Rourke DM. Potential of glioblastoma-targeted chimeric antigen receptor (CAR) T-Cell therapy. CNS Drugs. 2020;34:127–145. doi: 10.1007/s40263-019-00687-3. [DOI] [PubMed] [Google Scholar]
- 9.Xie K, Fu C, Wang S, Xu H, Liu S, Shao Y, Gong Z, Wu X, Xu B, Han J, Xu J, Xu P, Jia X, Wu J. Cancer-testis antigens in ovarian cancer: implication for biomarkers and therapeutic targets. J Ovarian Res. 2019;12:1. doi: 10.1186/s13048-018-0475-z. [DOI] [PMC free article] [PubMed] [Google Scholar]
- 10.Shi X, Chen X, Fang B, Ping Y, Qin G, Yue D, Li F, Yang S, Zhang Y. Decitabine enhances tumor recognition by T cells through upregulating the MAGE-A3 expression in esophageal carcinoma. Biomed Pharmacother. 2019;112:108632. doi: 10.1016/j.biopha.2019.108632. [DOI] [PubMed] [Google Scholar]
- 11.Griffiths EA, Srivastava P, Matsuzaki J, Brumberger Z, Wang ES, Kocent J, Miller A, Roloff GW, Wong HY, Paluch BE. NY-ESO-1 vaccination in combination with decitabine induces antigen-specific T-lymphocyte responses in patients with myelodysplastic syndrome. Clin Cancer Res. 2018;24:1019–1029. doi: 10.1158/1078-0432.CCR-17-1792. [DOI] [PMC free article] [PubMed] [Google Scholar]
- 12.Jansen YJL, Verset G, Schats K, Van Dam PJ, Seremet T, Kockx M, Van Laethem JB, Neyns B. Phase I clinical trial of decitabine (5-aza-2’-deoxycytidine) administered by hepatic arterial infusion in patients with unresectable liver-predominant metastases. ESMO Open. 2019;4:e000464. doi: 10.1136/esmoopen-2018-000464. [DOI] [PMC free article] [PubMed] [Google Scholar]
- 13.Zhang Z, He Q, Tao Y, Guo J, Xu F, Wu LY, Zhao YS, Wu D, Zhou LY, Su JY, Song LX, Xiao C, Li X, Chang CK. Decitabine treatment sensitizes tumor cells to T-cell-mediated cytotoxicity in patients with myelodysplastic syndromes. Am J Transl Res. 2017;9:454–465. [PMC free article] [PubMed] [Google Scholar]
- 14.Blagitko-Dorfs N, Schlosser P, Greve G, Pfeifer D, Meier R, Baude A, Brocks D, Plass C, Lübbert M. Combination treatment of acute myeloid leukemia cells with DNMT and HDAC inhibitors: predominant synergistic gene downregulation associated with gene body demethylation. Leukemia. 2019;33:945–956. doi: 10.1038/s41375-018-0293-8. [DOI] [PubMed] [Google Scholar]
- 15.Gu S, Tian Y, Chlenski A, Salwen HR, Lu Z, Raj JU, Yang Q. Valproic acid shows potent antitumor effect with alteration of DNA methylation in neuroblastoma. Anti-cancer drugs. 2012;23:1054. doi: 10.1097/CAD.0b013e32835739dd. [DOI] [PMC free article] [PubMed] [Google Scholar]
- 16.Ono T, Kurashige T, Harada N, Noguchi Y, Saika T, Niikawa N, Aoe M, Nakamura S, Higashi T, Hiraki A, Wada H, Kumon H, Old LJ, Nakayama E. Identification of proacrosin binding protein sp32 precursor as a human cancer/testis antigen. Proc Natl Acad Sci U S A. 2001;98:3282–3287. doi: 10.1073/pnas.041625098. [DOI] [PMC free article] [PubMed] [Google Scholar]
- 17.Fan R, Huang W, Xiao SW, Luo B, He SJ, Luo GR, Xie XX. OY-TES-1 expression and serum immunoreactivity in hepatocellular carcinoma. World Chi J Digest. 2009;17:3307–3312. [Google Scholar]
- 18.Luo B, Yun X, Fan R, Lin YD, He SJ, Zhang QM, Mo FR, Chen F, Xiao SW, Xie XX. Cancer testis antigen OY-TES-1 expression and serum immunogenicity in colorectal cancer: its relationship to clinicopathological parameters. Int J Clin Exp Pathol. 2013;6:2835–2845. [PMC free article] [PubMed] [Google Scholar]
- 19.Li XS, Yan J, Fan R, Luo B, Zhang QM, Lin YD, Zhou SF, Luo GR, Xie XX, Xiao SW. Serum immunoreactivity of cancer/testis antigen OY-TES-1 and its tissues expression in glioma. Oncol Lett. 2017;13:3080–3086. doi: 10.3892/ol.2017.5799. [DOI] [PMC free article] [PubMed] [Google Scholar]
- 20.Fan R, Huang W, Luo B, Zhang QM, Xiao SW, Xie XX. Cancer testis antigen OY-TES-1: analysis of protein expression in ovarian cancer with tissue microarrays. Eur J Gynaecol Oncol. 2015;36:298–303. [PubMed] [Google Scholar]
- 21.Safavi A, Kefayat A, Sotoodehnejadnematalahi F, Salehi M, Modarressi MH. Production, purification, and in vivo evaluation of a novel multiepitope peptide vaccine consisted of immunodominant epitopes of SYCP1 and ACRBP antigens as a prophylactic melanoma vaccine. Int Immunopharmacol. 2019;76:105872. doi: 10.1016/j.intimp.2019.105872. [DOI] [PubMed] [Google Scholar]
- 22.Luo B, Yun X, Li J, Fan R, Guo WW, Liu C, Lin YD, Ge YY, Zeng X, Bi SQ, Nong WX, Zhang QM, Xie XX. Cancer-testis antigen OY-TES-1 expression and immunogenicity in hepatocellular carcinoma. Curr Med Sci. 2020;40:719–728. doi: 10.1007/s11596-020-2241-x. [DOI] [PubMed] [Google Scholar]
- 23.Okumura H, Noguchi Y, Uenaka A, Aji T, Ono T, Nakagawa K, Aoe M, Shimizu N, Nakayama E. Identification of an HLA-A24-restricted OY-TES-1 epitope recognized by cytotoxic T-cells. Microbiol Immunol. 2005;49:1009–1016. doi: 10.1111/j.1348-0421.2005.tb03688.x. [DOI] [PubMed] [Google Scholar]
- 24.Zheng J, Guo X, Gao X, Liu H, Tu Y, Zhang Y. Overexpression of retinoic acid-induced protein 3 predicts poor prognosis for hepatocellular carcinoma. Clin Transl Oncol. 2014;16:57–63. doi: 10.1007/s12094-013-1040-2. [DOI] [PubMed] [Google Scholar]
- 25.Bosman FT, Carneiro F, Hruban RH, Theise N. World Health Organization. 4th ed. Lyon: IARC; 2010. WHO classification of tumors of the digestive system; pp. 1–418. [Google Scholar]
- 26.Liao XY, Zhang DW. The 8th edition American Joint Committee on Cancer staging for hepato-pancreato-biliary cancer: a review and update. Arch Pathol Lab Med. 2020 doi: 10.5858/arpa.2020-0032-RA. [Epub ahead of print] [DOI] [PubMed] [Google Scholar]
- 27.Kamarajah SK, Frankel TL, Sonnenday C, Cho CS, Nathan H. Critical evaluation of the American Joint Commission on Cancer (AJCC) 8th edition staging system for patients with Hepatocellular Carcinoma (HCC): a surveillance, epidemiology, end results (SEER) analysis. J Surg Oncol. 2018;117:644–650. doi: 10.1002/jso.24908. [DOI] [PubMed] [Google Scholar]
- 28.Pfeifer JD, Wick MJ, Roberts RL, Findlay K, Normark SJ, Harding CV. Phagocytic processing of bacterial antigens for class I MHC presentation to T cells. Nature. 1993;361:359–362. doi: 10.1038/361359a0. [DOI] [PubMed] [Google Scholar]
- 29.Hanabuchi S, Ohashi T, Koya Y, Kato H, Hasegawa A, Takemura F, Masuda T, Kannagi M. Regression of human T-cell leukemia virus type I (HTLV-I)-associated lymphomas in a rat model: peptide-induced T-cell immunity. J Natl Cancer Inst. 2001;93:1775–1783. doi: 10.1093/jnci/93.23.1775. [DOI] [PubMed] [Google Scholar]
- 30.Eisinga R, Heskes T, Pelzer B, Te Grotenhuis M. Exact p-values for pairwise comparison of Friedman rank sums, with application to comparing classifiers. BMC Bioinformatics. 2017;18:68. doi: 10.1186/s12859-017-1486-2. [DOI] [PMC free article] [PubMed] [Google Scholar]
- 31.Fu J, Luo B, Guo WW, Zhang QM, Shi L, Hu QP, Chen F, Xiao SW, Xie XX. Down-regulation of cancer/testis antigen OY-TES-1 attenuates malignant behaviors of hepatocellular carcinoma cells in vitro. Int J Clin Exp Pathol. 2015;8:7786–7797. [PMC free article] [PubMed] [Google Scholar]
- 32.Morrison BJ, Steel JC, Morris JC. Reduction of MHC-I expression limits T-lymphocyte-mediated killing of Cancer-initiating cells. BMC Cancer. 2018;18:469. doi: 10.1186/s12885-018-4389-3. [DOI] [PMC free article] [PubMed] [Google Scholar]
- 33.Romero I, Garrido C, Algarra I, Chamorro V, Collado A, Garrido F, Garcia-Lora AM. MHC Intratumoral heterogeneity may predict cancer progression and response to immunotherapy. Front Immunol. 2018;9:102. doi: 10.3389/fimmu.2018.00102. [DOI] [PMC free article] [PubMed] [Google Scholar]
- 34.Baylin SB, Jones PA. A decade of exploring the cancer epigenome - biological and translational implications. Nat Rev Cancer. 2011;11:726–734. doi: 10.1038/nrc3130. [DOI] [PMC free article] [PubMed] [Google Scholar]
- 35.Iura K, Kohashi K, Hotokebuchi Y, Ishii T, Maekawa A, Yamada Y, Yamamoto H, Iwamoto Y, Oda Y. Cancer-testis antigens PRAME and NY-ESO-1 correlate with tumour grade and poor prognosis in myxoid liposarcoma. J Pathol Clin Res. 2015;1:144–159. doi: 10.1002/cjp2.16. [DOI] [PMC free article] [PubMed] [Google Scholar]
- 36.Thomas R, Al-Khadairi G, Roelands J, Hendrickx W, Dermime S, Bedognetti D, Decock J. NY-ESO-1 based immunotherapy of cancer: current perspectives. Front Immunol. 2018;9:947. doi: 10.3389/fimmu.2018.00947. [DOI] [PMC free article] [PubMed] [Google Scholar]
- 37.Hu QP, Fu J, Luo B, Huang M, Guo WW, Lin YD, Xie XX, Xiao SW. OY-TES-1 may regulate the malignant behavior of liver cancer via NANOG, CD9, CCND2 and CDCA3: a bioinformatic analysis combine with RNAi and oligonucleotide microarray. Oncol Rep. 2015;33:1965–1975. doi: 10.3892/or.2015.3792. [DOI] [PubMed] [Google Scholar]
- 38.Shan JJ, Shen JJ, Liu L, Xia F, Xu C, Duan GJ, Xu YM, Ma QH, Yang Z, Zhang QZ, Ma LN, Liu J, Xu SL, Yan XC, Bie P, Cui YH, Bain XW, Qian C. Nanog regulates self-renewal of cancer stem cells through the insulin-like growth factor pathway in human hepatocellular carcinoma. Hepatology. 2012;56:1004–1014. doi: 10.1002/hep.25745. [DOI] [PubMed] [Google Scholar]
- 39.Cervoni N, Szyf M. Demethylase activity is directed by histone acetylation. J Biol Chem. 2001;276:40778–40787. doi: 10.1074/jbc.M103921200. [DOI] [PubMed] [Google Scholar]
- 40.Hosseini A, Minucci S. A comprehensive review of lysine-specific demethylase 1 and its roles in cancer. Epigenomics. 2017;9:1123–1142. doi: 10.2217/epi-2017-0022. [DOI] [PubMed] [Google Scholar]
- 41.Wang J, Hevi S, Kurash JK, Lei H, Gay F, Bajko J, Su H, Sun W, Chang H, Xu G, Gaudet F, Li E, Chen T. The lysine demethylase LSD1 (KDM1) is required for maintenance of global DNA methylation. Nat Genet. 2009;41:125–129. doi: 10.1038/ng.268. [DOI] [PubMed] [Google Scholar]
- 42.Lee RC, Feinbaum RL, Ambros V. The C. elegans heterochronic gene lin-4 encodes small RNAs with antisense complementarity to lin-14. Cell. 1993;75:843–854. doi: 10.1016/0092-8674(93)90529-y. [DOI] [PubMed] [Google Scholar]
- 43.Yin Y, Morgunova E, Jolma A, Kaasinen E, Sahu B, Khund-Sayeed S, Das PK, Kivioja T, Dave K, Zhong F, Nitta KR, Taipale M, Popov A, Ginno PA, Domcke S, Yan J, Schübeler D, Vinson C, Taipale J. Impact of cytosine methylation on DNA binding specificities of human transcription factors. Science. 2017;356:eaaj2239. doi: 10.1126/science.aaj2239. [DOI] [PMC free article] [PubMed] [Google Scholar]
- 44.Cheray M, Etcheverry A, Jacques C, Pacaud R, Bougras-Cartron G, Aubry M, Denoual F, Peterlongo P, Nadaradjane A, Briand J, Akcha F, Heymann D, Vallette FM, Mosser J, Ory B, Cartron PF. Cytosine methylation of mature microRNAs inhibits their functions and is associated with poor prognosis in glioblastoma multiforme. Mol Cancer. 2020;19:36. doi: 10.1186/s12943-020-01155-z. [DOI] [PMC free article] [PubMed] [Google Scholar]
- 45.Li YT, Chen FY, Chu JC, Li Y, Li H, Ma HX. miR-148-3p inhibits growth of glioblastoma targeting DNA methyltransferase-1 (DNMT1) Oncol Res. 2019;27:911–921. doi: 10.3727/096504019X15516966905337. [DOI] [PMC free article] [PubMed] [Google Scholar]
- 46.Coral S, Sigalotti L, Colizzi F, Spessotto A, Nardi G, Cortini E, Pezzani L, Fratta E, Fonsatti E, Di Giacomo AM. Phenotypic and functional changes of human melanoma xenografts induced by DNA hypomethylation: immunotherapeutic implications. J Cell Physiol. 2006;207:58–66. doi: 10.1002/jcp.20540. [DOI] [PubMed] [Google Scholar]
- 47.Morel D, Jeffery D, Aspeslagh S, Almouzni G, Postel-Vinay S. Combining epigenetic drugs with other therapies for solid tumours-past lessons and future promise. Nat Rev Clin Oncol. 2020;17:91–107. doi: 10.1038/s41571-019-0267-4. [DOI] [PubMed] [Google Scholar]
- 48.Cappellacci L, Perinelli DR, Maggi F, Grifantini M, Petrelli R. Recent progress in histone deacetylase inhibitors as anticancer agents. Curr Med Chem. 2020;27:2449–2493. doi: 10.2174/0929867325666181016163110. [DOI] [PubMed] [Google Scholar]
Associated Data
This section collects any data citations, data availability statements, or supplementary materials included in this article.