Abstract
Face processing is a fast and efficient process due to its evolutionary and social importance. A majority of people direct their first eye movement to a featureless point just below the eyes that maximizes accuracy in recognizing a person's identity and gender. Yet, the exact properties or features of the face that guide the first eye movements and reduce fixational variability are unknown. Here, we manipulated the presence of the facial features and the spatial configuration of features to investigate their effect on the location and variability of first and second fixations to peripherally presented faces. Our results showed that observers can utilize the face outline, individual facial features, and feature spatial configuration to guide the first eye movements to their preferred point of fixation. The eyes have a preferential role in guiding the first eye movements and reducing fixation variability. Eliminating the eyes or altering their position had the greatest influence on the location and variability of fixations and resulted in the largest detriment to face identification performance. The other internal features (nose and mouth) also contribute to reducing fixation variability. A subsequent experiment measuring detection of single features showed that the eyes have the highest detectability (relative to other features) in the visual periphery providing a strong sensory signal to guide the oculomotor system. Together, the results suggest a flexible multiple-cue approach that might be a robust solution to cope with how the varying eccentricities in the real world influence the ability to resolve individual feature properties and the preferential role of the eyes.
Keywords: eye movements, faces, visual periphery, optimal fixation
Introduction
Faces carry critical information about people's identities, emotions, genders, and ethnicities and are essential to survival. Face perception is mediated by unique behavioral signatures (holistic processing), high efficiency compared to object and scene perception (Farah, Wilson, Drain, & Tanaka, 1998a; Tanaka & Sengco, 1997), and dedicated brain areas (Haxby, Hoffman, & Gobbini, 2000; Kanwisher, McDermott, & Chun, 1997; McCarthy, Puce, Gore, & Allison, 1997; Rossion, Hanseeuw, & Dricot, 2012; Tsao & Livingstone, 2008). Faces are also processed extremely rapidly. People can make a saccade and respond to a face within about 100 ms (Crouzet, Kirchner, & Thorpe, 2010).
In general, the eye region attracts fixations when people look at faces (Hessels, 2020). Within a few hundred milliseconds, a majority of humans consistently direct their gaze to a featureless point just below the eyes during face recognition (preferred point of fixation; Hsiao & Cottrell, 2008; Peterson & Eckstein, 2012) and acquire most of the visual information supporting face recognition (Hsiao & Cottrell, 2008; Or, Peterson, & Eckstein, 2015). Studies have also shown interindividual variability in the initial preferred point of fixation. A minority of people consistently look further down along the face closer to the middle and tip of the nose. In addition, variability in the horizontal direction is small (fixations are usually close to the vertical midline of the face) while higher in the vertical direction (Gurler, Doyle, Walker, Magnotti, & Beauchamp, 2015; Kanan, Bseiso, Ray, Hsiao, & Cottrell, 2015; Mehoudar, Arizpe, Baker, & Yovel, 2014; Peterson & Eckstein, 2013).
Importantly, the preferred point of fixation has functional importance to maximizing accuracy in many face-related tasks (Or et al., 2015; Peterson & Eckstein, 2012) and enhancing face-specific electrophysiological responses (Stacchi, Ramon, Lao, & Caldara, 2019). Instructing observers to fixate away (further down along the face) from an observer's preferred point of fixation degrades face identification accuracy (Or et al., 2015). Furthermore, the location of the typical preferred point of fixation can be explained in terms of the varying resolution of information processing across the visual field and the distribution of featural information across faces. The eyes are the features containing the most information to identify a person from the face (Peterson & Eckstein, 2012). Fixating just below the eyes allows observers to integrate information across features and process the most informative eye features with relatively higher spatial resolution.
Although we have learned much about why humans direct their first fixation to a featureless point just below the eyes, we know less about the properties of faces that guide the first eye movements. What features or properties of faces appearing at an observer's visual periphery are critical to guide the first eye movements towards the preferred location? This question might seem identical to determining the features to which observers direct their eye movements. It is not necessarily the case. Eye movements directed to a specific feature could be guided by other spatially neighboring visual features visible in the visual periphery. For example, while searching for a kitchen sponge, eye movements toward the sponge might seem to be guided exclusively by the sponge. But it is the kitchen counter and sink, visible in the periphery, that are critical to guiding the eye movements (Castelhano & Heaven, 2010; Chen & Zelinsky, 2006; Eckstein, 2017; Koehler & Eckstein, 2017a; Koehler & Eckstein, 2017b; Malcolm & Henderson, 2010). The sponge itself is difficult to detect in the periphery and might provide a weak sensory signal to reliably guide eye movements. Similarly, for faces presented in the periphery, humans might direct an eye movement to a featureless point below the eyes, but it could be the face outline or some specific facial feature that guides the eye movements to that point.
Robust visual processing also requires minimizing the variability of the saccade end points. Fixation variability is an essential aspect of oculomotor control that has been heavily studied for tasks with simple stimuli (van Beers, 2007; Kowler, 2011; Kowler & Blaser, 1995; Poletti, Intoy, & Rucci, 2020). The variability is determined by motor noise and bottlenecks in sensory processing that limit the ability of the brain to localize the saccadic target in the visual periphery (van Beers, 2007). The majority of variability is associated with the uncertainty in target localization related to the visual sensory signals (van Beers, 2007). Little is known about how fixational variability to faces is influenced by the peripheral sensory signals provided by individual features. The goal of the current paper is to understand how different face properties and features contribute to the guidance of the first and second saccades and influence fixation variability.
We aim to determine which visual features guide first eye movements to faces. We used a similar logic to the study of eye movements in visual search (Castelhano & Heaven, 2010; Chen & Zelinsky, 2006; Eckstein, 2017; Koehler & Eckstein, 2017a; Koehler & Eckstein, 2017b; Malcolm & Henderson, 2010). We manipulated the presence of facial features and their configurations to assess how they impact the mean location and variability of eye movements to faces.
Previous studies have investigated the influences of manipulation of facial features on face recognition and discrimination tasks. Most studies have focused on behavioral performance changes. For example, changes in facial features, such as lip thickness, eye color, and shape, are the most influential for face identification tasks (Abudarham & Yovel, 2016). Configurational changes in the eye region are detected easier than changes in the mouth region (Xu & Tanaka, 2013). Changes in the feature configurations lead to higher performance in identifying individual features than identifying the whole face (Tanaka & Farah, 1993). Other studies have explored the effects of eye movement patterns. For example, in a face change detection task, people tended to make more inter-featural saccades with blurred faces to integrate the spatial relationships between features and made longer fixations on individual features for scrambled faces to find detailed local information (Bombari, Mast, & Lobmaier, 2009). People frequently looked at the eye region in a face-matching task even when a gaze-contingent mask covered the eyes (van Belle, De Graef, Verfaillie, Busigny, & Rossion, 2010a).
In the current study, we focused on the precise location of fixations within faces and their variability. We evaluated how fixations were influenced by the absence of individual facial features and by different feature configurations. We investigated different hypotheses about how facial components guide the first eye movement to the face. We assessed the contributions of the absence of one of four features (the face outline, eyes, nose, and mouth) and varying their spatial configuration. One hypothesis is that the face outline mainly guides the first eye movement to faces. The face outline acts as a reference for the face's boundary and could be processed rapidly and easily in the periphery. If so, presenting only a face outline in the periphery might be sufficient for humans to look at their typical preferred point on the face and ensure reduced fixation variability.
Alternatively, the first eye movements could be guided mostly by a single facial feature. The facial feature guiding saccades might be determined by how visible or salient the feature is in the visual periphery. For example, the eyes might guide first fixations because of the high contrast of the iris relative to the sclera (Levy, Foulsham, & Kingstone, 2013), making them a salient facial feature. Suppose a single facial feature guides the first eye movement to faces. In that case, observers’ saccade end point and fixation variance should be influenced by the presence or absence of that critical feature. In contrast, if the brain does not utilize a facial feature to guide the first eye movements, the fixation location or variability should not be affected by the presence or absence of that feature.
Another possibility is that the spatial configuration of various features and the face outline jointly guide the first eye movement. In such a scenario, manipulating the presence of face outline or facial feature configuration by altering their position within faces should have a large influence on first fixations. A final possibility is that the facial features guiding the first eye movements might vary across individuals and might be related to the feature proximity to the preferred point of fixation. For example, individuals fixating just below the eyes might be guided mainly by the eyes. In contrast, the more infrequent individuals fixating at lower points along the face might show eye movements guided by the nose or mouth.
Aside from identifying the facial features guiding the first eye movement, we aim to understand why humans utilize a specific feature or set of features. In particular, we evaluate whether there is a relationship between selecting a feature for guidance and its detectability in the visual periphery. Both the guidance and variability of eye movement endpoints in simple tasks can be related to the visibility of the saccade target in the visual periphery (van Beers, 2007; Beutter, Eckstein, & Stone, 2003; Eckstein, Beutter, & Stone, 2001). One hypothesis is that the first eye movements to faces rely on a feature that are most visible and pronounced in the visual periphery. Previous studies have evaluated visual periphery performance in different face-related tasks: the detectability of intact (Brown, Huey, & Findlay, 1997; Mäkelä, Näsänen, Rovamo, & Melmoth, 2001), inverted and scrambled faces (Brown et al., 1997), the discriminability of emotions (Goren & Wilson, 2006; Smith & Rossit, 2018), gender (Bayle, Schoendorff, Hénaff, & Krolak-Salmon, 2011), and gaze direction (Loomis, Kelly, Pusch, Bailenson, & Beall, 2008). Yet, no studies have measured the detectability of isolated facial features in the periphery.
In Experiment 1, we assessed the initial fixations to a face in the periphery in face identification tasks by manipulating the presence or the configuration of the features. We investigated which face properties were the most critical cue in guiding the initial fixations. To further investigate whether visibility in the periphery of certain feature(s) might be related to their stronger effect in guiding the first fixations, we implemented Experiment 2 to measure peripheral detectability. In Experiment 2, we measured the visibility of single features in the visual periphery while observers maintained gaze on the point of fixation. We assessed the relationship between the detectability of features and the location and variability of first eye movements to faces in Experiment 1.
Experiment 1: Feature deletion and scrambled configurations
Methods
Participants
Thirteen undergraduate (10 White, 2 Asian, 1 Latino;10 women, 3 men, ages from 19–21 years) from the University of California, Santa Barbara, were recruited as observers for credits or volunteers in this experiment. All had normal or corrected-to-normal vision. All participants signed consent forms to participate in the study. The study was approved by UCSB Institutional Review Board (IRB).
Stimuli
Preprocessing
Frontal-view photographs of four White male identities were used in the face identification tasks. To create modified faces, we first created individual binary masks for the eyes, nose, and mouth regions of each face. We also created a blank face outline using Photoshop so that only the face boundary and hair are visible. Poisson blending was used to blend individual facial features from the original face (source image) onto the blank face outline (Pérez, Gangnet, & Blake, 2003). Poisson blending is an image processing technique that allows inserting one image into another without introducing any visually prominent seams. All facial features were blended to the same face outline so that subjects can only identify a face based on the facial features but not based on the hairstyle or face shape. Note that in the face outline condition, all four face outlines were the same. Therefore, the face outline is a control condition in which we expected observers to perform at the chance (25% proportion correct).
Presentation
All faces were scaled and aligned (14 degrees height and 10 degrees width), and the vertical positions of the features were aligned. Nine face conditions were created for each identity: (1) original face (the intact face), (2) all facial features without the face outline (floating features), (3) the face outline without facial features (face outline), (4) original face without the mouth (no mouth), (5) original face without the nose (no nose), (6) original face without the eyes (no eyes) and three feature scrambling faces, (7) EMN: eyes on the top, mouth in the middle, nose in the bottom, (8) NEM: nose, eyes, mouth, and (9) MNE: mouth, nose, eyes (Figure 1). See Appendix A1 for all four face identities in all nine conditions.
Figure 1.
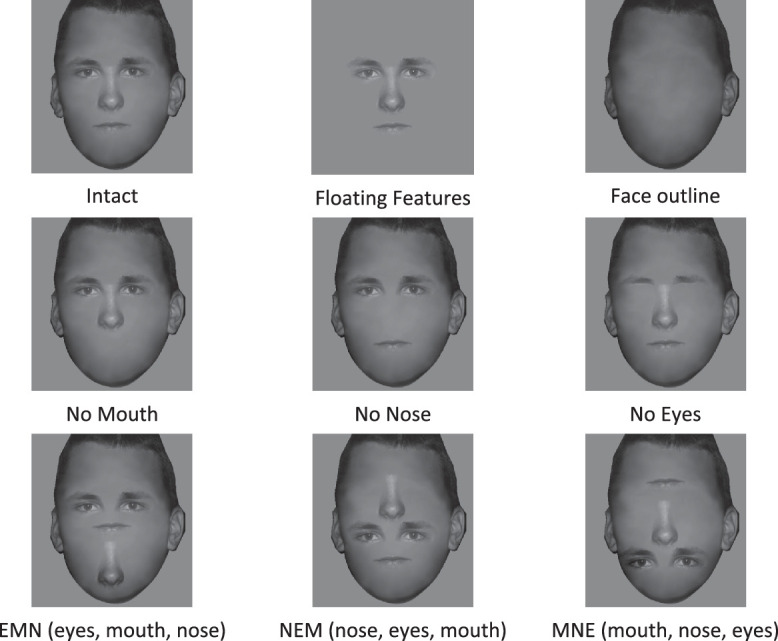
Experimental stimuli in nine face conditions for one of the four face identities.
Apparatus
Stimuli were created using MATLAB and the Psychophysics Toolbox (Kleiner, Brainard, Pelli, Ingling, Murray, & Broussard, 2007) and were presented on the screen with resolution 1280 × 1024, which was 75 cm away from subjects’ eyes. Images were converted to 8-bit grayscale, with a mean luminance of 44 cd/m², with the same contrast and zero-mean white Gaussian noise of a standard deviation of 10 cd/m² added to the original image. Each subject's left eye was tracked by an SR Research Eyelink 1000 plus Desktop Mount eye tracker with a sampling rate of 1000 Hz. The subject's eye movements were calibrated and validated before each session. Eye events in which velocity was higher than 35 degrees/s and acceleration exceeded 9500 degrees/s² were recorded as saccades.
Procedure
Subjects were instructed to perform a (1 out of 4) face identification task for all nine conditions. Each subject completed 210 trials (7 sessions * 30 trials/session) for each condition. Within one session, subjects completed a block of 30 trials for each face condition. The order of the face conditions was random and determined independently for each subject. All subjects participated in a practice session before the initiation of the main experiments. The practice session consisted of blocks of 30 trials for each condition in random order. The purpose of the practice session is to familiarize subjects with novel faces and get them prepared for the main experiments.
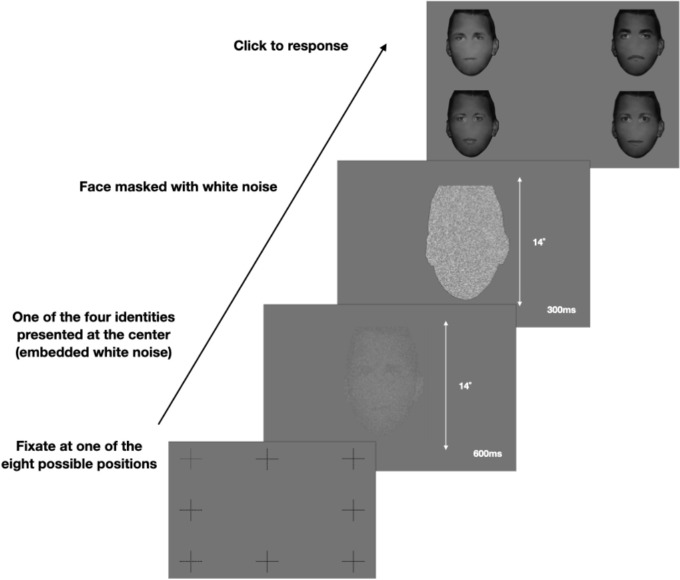
Before the trials started, subjects were instructed to finish a nine-point calibration and validation, with a mean error of no more than 0.5 degrees of visual angle between the calibration and the validation process to ensure eye-tracking precision. At the beginning of each trial, one of eight fixation crosses was randomly chosen and presented on the screen. Fixation crosses were at different locations around the location where the face would be presented (top left, top middle, top right, middle left, middle right, bottom left, bottom middle, and bottom right; see Figure 2). The distance among the four fixation crosses in the corner to the closest point along the face outline was 5.8 degrees of visual angle. The distance between the left and right-middle fixation crosses to the closest point along the face outline was 4.8 degrees of visual angle. The distance between the top and bottom-middle fixation crosses to the closest point along the face outline was a visual angle of 3.2 degrees.
Figure 2.
Procedure flow for each trial. The participants were required to fixate at one of the eight fixation positions and press the space bar to initialize the trial. Then one of the four face identities with overlaid white noise was randomly presented on the screen for 600 ms, during which participants could make free eye movements. After 600 ms, a luminance-matched Gaussian white noise mask was presented for 300 ms. Finally, the response screen was displayed, and participants clicked on the face they identified.
Subjects were instructed to direct their gaze to the fixation cross and press the space bar to initiate the trial. If the eye tracker detected an eye movement away from the fixation cross of more than a 1 degree visual angle while they pressed the space bar, the trial would not start. Once the trial started, one of the four faces with additive independent Gaussian noise was presented at the center of the screen. Once the face appeared, subjects were allowed to make free eye movements, and no instructions were given about eye movement strategies. After 600 ms presentation time, a white noise Gaussian noise mask was presented for 300 ms. Then the response screen was presented with images of the faces for the four identities at each corner. Faces at the response screen came from the same condition and were presented at full contrast without additive Gaussian noise. Subjects then used the mouse to select the face they identified that was presented in that trial. The procedure details are shown in Figure 2. Additive noise to the face stimuli and a post-stimulus noise mask increased the task difficulty. Average subjects’ behavioral performance in face recognition for the intact faces was approximately 70%.
Statistical power and data analysis
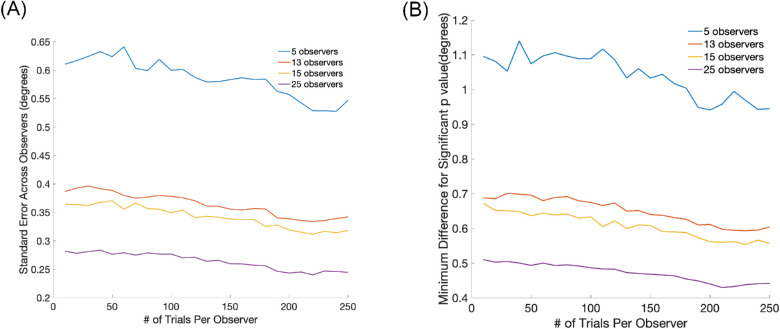
We chose our number of subjects and trials per condition based on estimated calculations of standard errors for the first fixations from a previous data set of 300 observers and 400 trials per observer (see Appendix A2 for details) viewing faces of a similar size. Based on those data, we expected that with 13 subjects completing 210 trials per condition, we would obtain a standard error of the first fixation to be about 0.35 degrees.
To test whether fixations were below a reference point (e.g. below the eyes), we used a one-sample t-test to compare mean first fixations across subjects to the eyes’ position. To quantify the effect of feature positions on fixations in different facial conditions, we used 1-way ANOVAs and post hoc Tukey tests to compare mean fixation locations across different conditions. We used nonparametric bootstrap resampling methods with false discover rate (FDR) correction to evaluate statistical differences in the variance of first fixation locations. We obtained 10,000 bootstrap samples to compare the variances of the fixations’ location across conditions.
Results
We first plotted the frequency of the number of fixations observers made during face presentation time. The participants could make a limited number of saccades in the given face presentation time of 600 ms (usually between 1 and 2 saccades, see Figure 3 for the histogram).
Figure 3.
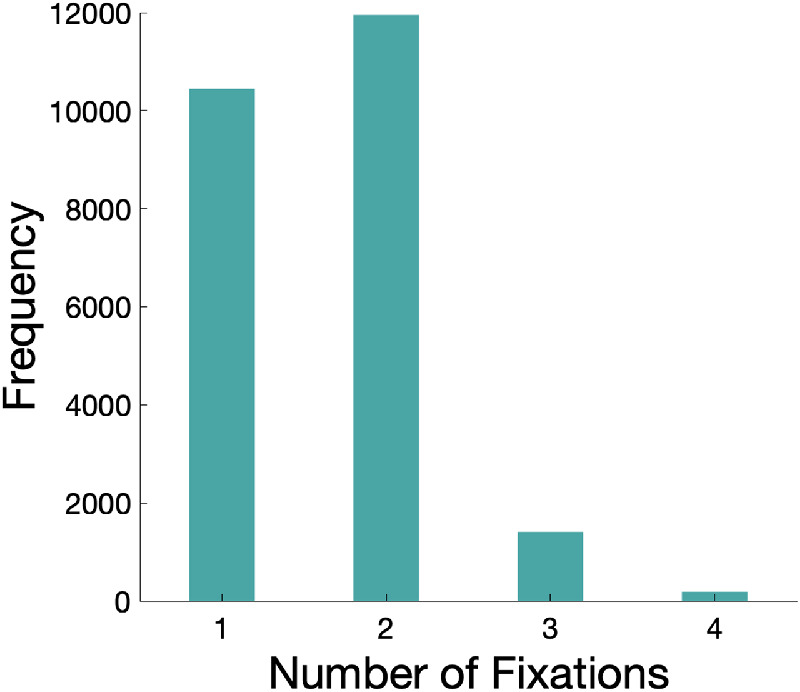
Histogram of the number of fixations subjects executed during a 600 ms presentation time in all conditions and all subjects’ trials.
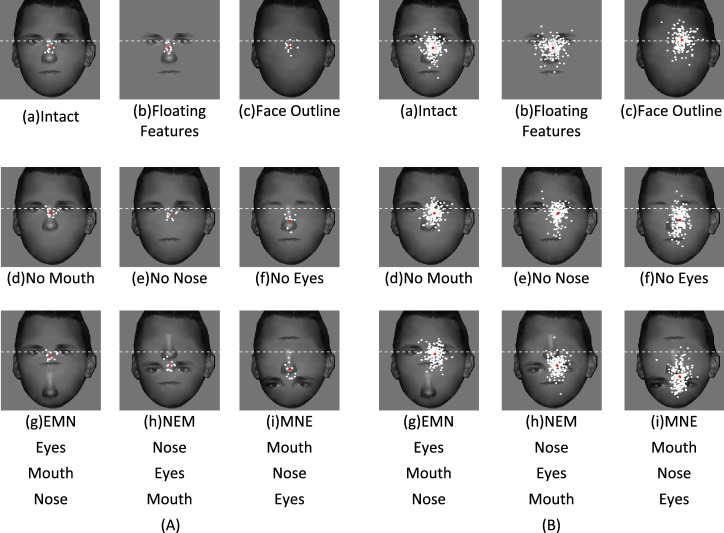
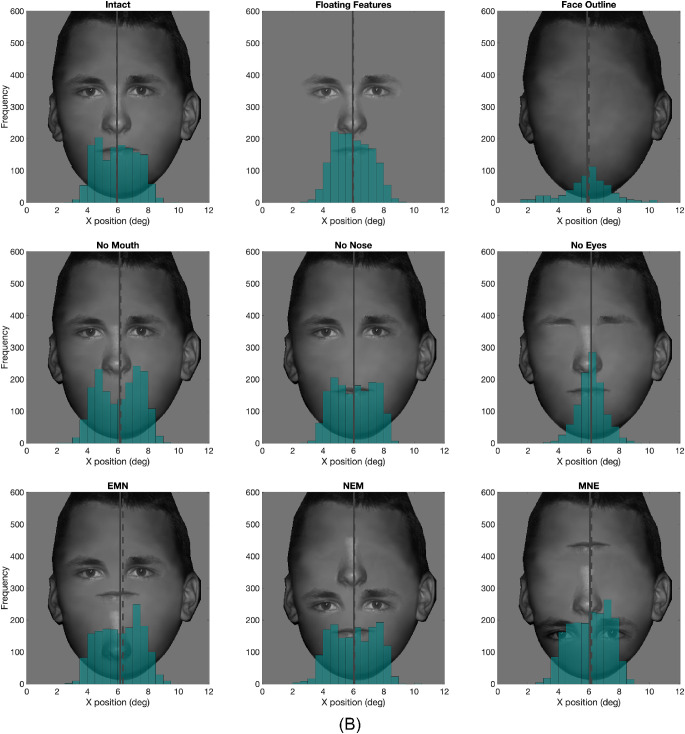
Figure 4 shows the first fixation behavior. Figure 4A plots the average first fixations of each subject (white circles) in all nine conditions and the mean across all subjects (red circles). Figure 4B plots an example of a single subject's first fixations and the mean across the subject's fixations. We separated the nine conditions into three subgroups to further analyze the first and second fixations. We combined the fixations to the face corresponding to trials with initial fixation crosses at different locations (Arizpe, Kravitz, Yovel, & Baker, 2012) surrounding the face (see Figure 2). A comparison of first fixations for the different starting positions resulted in significant differences for two of the nine conditions: the face outline condition (standard deviation across initial fixation cross locations = 0.71 degrees) and the NEM condition (standard deviation across initial fixation cross locations = 0.21 degrees). The differences in saccade endpoint for the two conditions (face outline and NEM) are related to a tendency for undershooting saccades in the top and bottom fixations (see Appendix A3 for a detailed analysis of starting position).
Figure 4.
(A) Average first fixations for 13 subjects for each condition. The dashed white line is the eyes’ position reference in the intact face. The white dots are the individual subject's average first fixations. The red dot is the average across all subjects. (B) Example of first fixations for one subject from all trials. The white dots are the individual trials, and the red dot is the average across all trials.
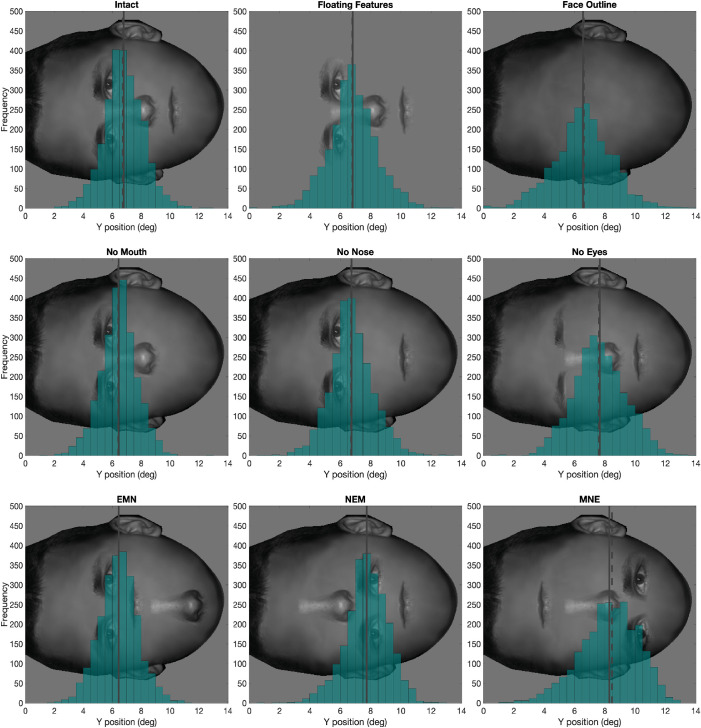
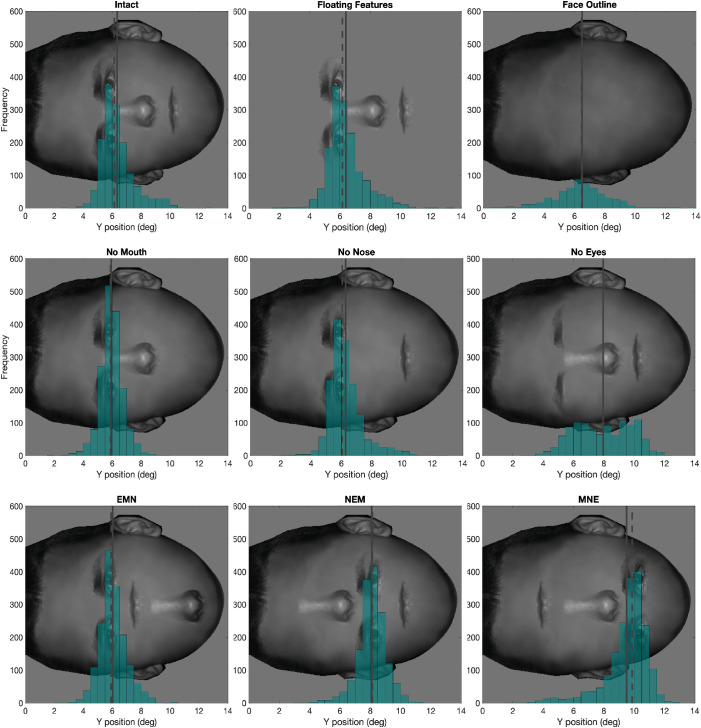
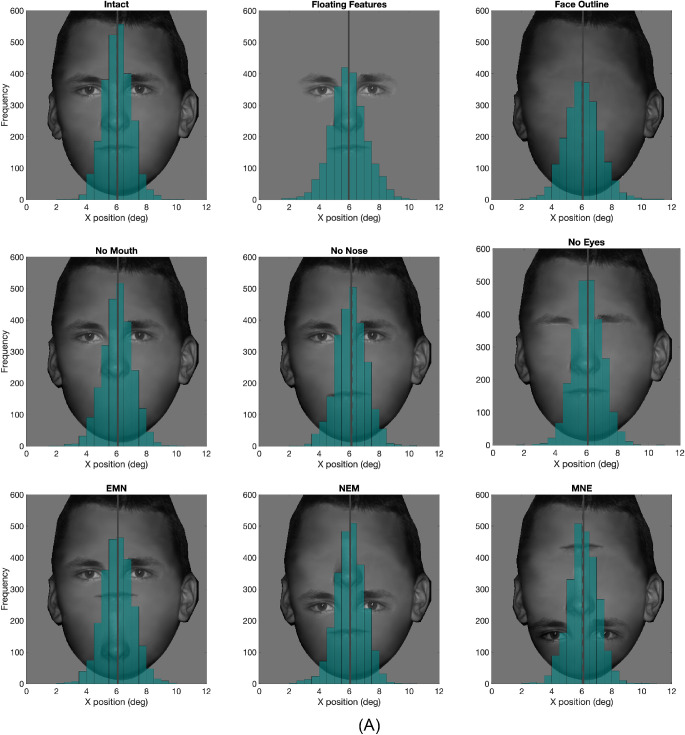
We separately assessed the role of the face outline and individual features. Figures 5 and 6 show the distribution across all subjects of first and second fixations in the vertical direction with annotated means and medians. Distributions are mostly symmetrical (see Figure 5). Distributions of fixations for the horizontal direction are shown in Appendix 4.
Figure 5.
Histogram of the first fixation's y position for all nine conditions from all subjects, The solid vertical line represents the mean, and the dashed vertical line represents the median.
Figure 6.
Histogram of y position of second fixations in all nine conditions from all subjects. The solid vertical line represents the mean, and the dashed vertical line represents the median.
Both face outline and features contribute to reducing variability of first fixations
We evaluated the influence of the presence of only the facial features versus only the face outline on the first fixations to faces. In the intact face condition, the position of the first fixations across trials and observers was on average 0.93 degrees below the eyes’ position for the intact faces (SE = 0.34 degrees, t(12) = 5.4, p < 0.001, 2-tailed). Figures 4A(a) to (c) shows little variation in the mean vertical position of first fixations on the faces.
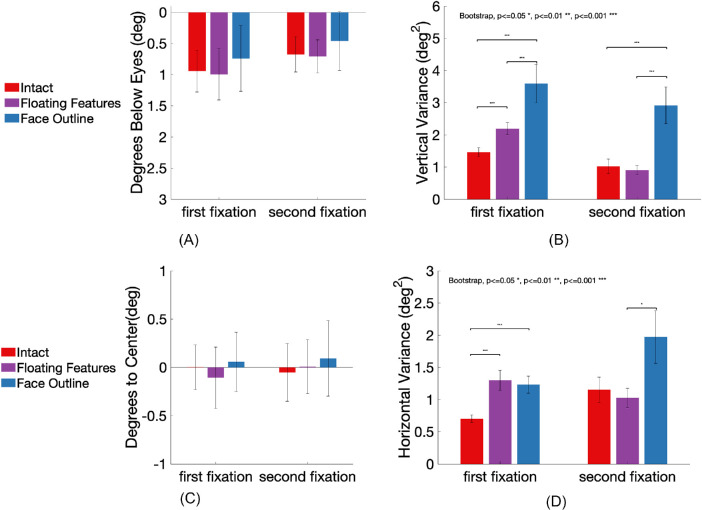
Figure 7A shows that the mean vertical position of the first fixations did not vary significantly across the intact, the floating features, and the face outline condition (intact meanbelow eyes = 0.93 degrees, SE = 0.34 degrees; floating features meanbelow eyes = 0.99 degrees, SE = 0.41 degrees; face outline meanbelow eyes = 0.74 degrees, SE = 0.52 degrees; no significant main effect: F(2,36) = 0.6, p = 0.553, η2 = 0.03). Similarly, there was no difference in the second fixations positions (Intact meanbelow eyes = 0.68 degrees, SE = 0.34 degrees; floating features meanbelow eyes = 0.71 degrees, SE = 0.41 degrees; face outline, meanbelow eyes = 0.46 degrees, SE = 0.53 degrees; and no significant main effect was found: F(2,36) = 0.44, p = 0.65, η2 = 0.02).
Figure 7.
Fixation location and variance in the intact face, the floating features, and the face outline conditions. Error bars represent standard errors. (A) Mean fixation location in degrees below the eyes’ position in the intact faces. (B) Within-observer fixations vertical variance. (C) Mean fixation location in degrees away from the central vertical line of the face in the horizontal direction, x > 0 represents positions on the right side of the central vertical line, x < 0 represents positions on the left of the central vertical line. (D) Within-observer fixation variance along the horizontal coordinate.
We also evaluated whether the within-subject variance of the vertical first fixation position varied as a function of the presence or absence of the features and face outline. Figure 7B shows that for the first fixations, both the floating feature condition (σ² = 2.19 deg2, p < 0.001) and the face outline condition (σ² = 3.59 deg2, p < 0.001) had significant higher variance than in the intact conditions (σ² = 1.46 deg2). In addition, the face outline condition had a significantly higher variance in the first fixation position than that of the floating feature condition (p < 0.001). We also analyzed how the first fixation within-subject variance varied across sessions and did not find statistically significant changes (see Appendix A5).
Similarly, second fixations in the face outline condition (σ² = 2.91 deg2) had significantly higher variance than in the intact condition (σ² = 1.02 deg2, p < 0.001) and the floating feature condition (σ² = 0.91 deg2, p < 0.001), whereas the difference in the variance between the intact and the floating feature condition was not significant (p = 0.31).
Figure 7C shows the mean horizontal position of the fixations compared to the face's central vertical line. We subtracted the face center × coordinate from fixation × coordinate such that positive values represent fixation on the right side of the face center, and negative values represent fixation on the left side of the face center. One-way ANOVA showed that there was no main effect of condition on the first fixations F(2,36) = 0.62, p = 0.54, η2 = 0.03, (intact meanfrom center = 0.002 degrees, SE = 0.23 degrees; floating features meanfrom center = −0.11 degrees, SE = 0.32 degrees; face outline meanfrom center = 0.06 degrees, SE = 0.31 degrees). Similarly, there was no main effect of condition on the horizontal coordinate of the second fixation F(2,36) = 0.14, p = 0.87, η2 = 0.01, (intact meanfrom center = −0.05 degrees, SE = 0.30 degrees; floating features meanfrom center = 0.01 degrees, SE = 0.28 degrees; face outline meanfrom center = 0.09 degrees, SE = 0.39 degrees). Figure 7D shows that the variance of the first fixations’ horizontal coordinate was both significantly higher in the face outline condition (σ² = 1.30 deg2) and floating features (σ² = 1.23 deg2) compared to the intact (σ² = 0.69 deg2), both p < 0.001. The variance of the second fixations’ horizontal coordinate was only significantly higher in the floating features (σ² = 1.92 deg2) compared to the face outline (σ² = 1.23 deg2, p < 0.05). Appendix 4(a)(b) top row shows that most of the first fixations and the second fixations are close to the face center, whereas the second fixations show a wider spread that included the eye region. Taken together, both facial features and the facial outline were important in reducing the vertical and horizontal variability of the first fixation positions.
Missing features influence both the position and variability of first fixations
We then evaluated how eliminating single facial features influenced the mean first fixation position and its variability. Figure 4A (d) to (f) shows that the mean first fixation locations are influenced more strongly by the absence of a facial feature, compared to the effects of eliminating the face outline or all features simultaneously Figure 4A (a) to (c).
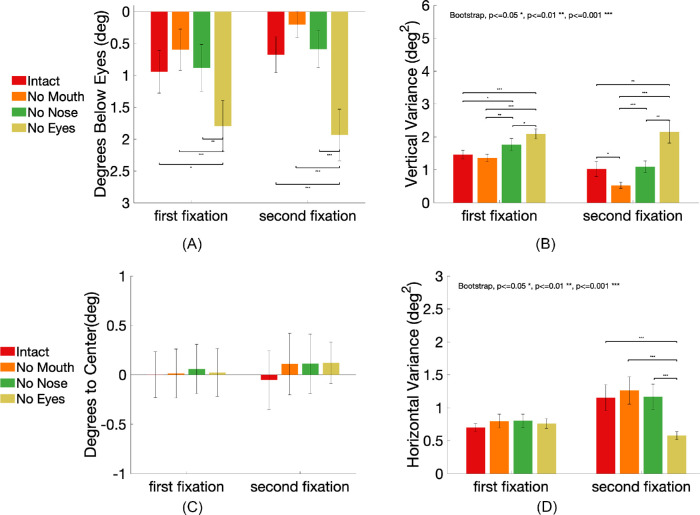
Figure 8A shows the vertical position of the fixation for the various conditions expressed relative to the eyes in intact faces (degrees below the eyes). For the first fixations, there was a significant main effect of condition, F(3,48) = 7.55, p < 0.001, η2 = 0.32. Post hoc Tukey honestly significant difference (HSD) comparison showed that eliminating the eyes (the no eye condition) significantly lowered the mean vertical coordinate of the first fixation (meanbelow eyes = 0.93 degrees vs. 1.80 degrees, SE = 0.40 degrees) compared to the intact condition, p = 0.01, and the no mouth condition, p < 0.001, and the no nose condition, p < 0.01. Eliminating the nose or mouth did not change the position of the first fixations significantly relative to the intact condition (intact vs. no mouth meanbelow eyes = 0.93 degrees vs. 0.60 degrees, SE = 0.32°, p = 0.56; intact versus no nose meanbelow eyes = 0.93 degrees vs. 0.88 degrees, SE = 0.37 degrees, p = 0.99. For the second fixations, we also found a main effect of condition, F(3,48) = 12.73, p < 0.001, η2 = 0.80. Tukey HSD confirmed that only the no eyes condition had a significantly lower second fixation position (meanbelow eyes = 1.94 degrees, SE = 0.41 degrees) compared to the other three conditions (intact meanbelow eyes = 0.68 degrees, SE = 0.34 degrees; no mouth meanbelow eyes = 0.20 degrees, SE = 0.20 degrees; no nose meanbelow eyes = 0.59 degrees, SE = 0.29 degrees), all p < 0.001.
Figure 8.
Fixation location and variance in the intact, the no mouth, no nose, and no eyes conditions. Error bars represent standard errors. (A) Mean fixation location in degrees below the eyes’ position in the intact faces. (B) Within-observer fixations vertical variance. (C) Mean fixation location in degrees away from the central vertical line of the face in the horizontal direction, x > 0 represents positions on the right side of the central vertical line, x < 0 represents positions on the left of the central vertical line. (D) Within-observer fixations horizontal variance.
We evaluated whether the within-observer variance in the fixations’ vertical position varied when eliminating features. For the first fixations, compared to the intact condition (σ2 = 1.46), the fixations’ variances were significantly larger when eliminating the nose (σ2 = 1.77, p < 0.05) or the eyes (σ2 = 2.09, p < 0.001). Eliminating the mouth did not change the variance (σ2 = 1.36 deg2) significantly, p = 0.15 (Figure 8B). For the second fixations, eliminating the eyes (σ2 = 2.15) increased the variance significantly compared to the intact condition (σ2 = 1.02, p < 0.01), the no mouth condition (σ2 = 0.52, p < 0.001), and the no nose condition (σ2 = 1.09, p < 0.01). There was no difference between the intact condition and the no nose condition (p = 0.32), and eliminating the mouth reduced the variance of the second fixations compared to the intact condition (p < 0.05). Further analysis revealed that a small proportion of second fixations are to the mouth (see Figure 6). Elimination of the mouth abolishes second fixations down along the face, concentrates the fixations closer to the eyes, and reduces their variability.
For the first fixations’ horizontal direction, there was no significant main effect of condition F(3,48) = 0.05, p = 0.99, η2 = 0.003, (intact meanfrom center = 0.002 degrees, SE = 0.23 degrees; no mouth meanfrom center = 0.01 degrees, SE = 0.25 degrees; no nose meanfrom center = 0.06 degrees, SE = 0.25 degrees, no eyes meanfrom center = 0.02 degrees, SE = 0.24 degrees). There was no difference in the horizontal position variance, all p > 0.05. Similarly, there was no significant main effect of condition on second fixations’ horizontal direction, F(3,48) = 0.21, p = 0.89, η2= 0.01, (intact meanfrom center = -0.05 degrees, SE = 0.30 degrees; no mouth meanfrom center = 0.11 degrees, SE = 0.31 degrees; no nose meanfrom center = 0.11 degrees, SE = 0.30 degrees, no eyes meanfrom center = 0.12 degrees, SE = 0.21 degrees; Figure 8C). In contrast to the vertical direction, the horizontal variance in the no eyes condition (σ2 = 0.60) was significantly lower compared to the intact (σ2 = 1.15), no mouth (σ2 = 1.26) and no nose (σ2 = 1.17), all p < 0.001 (Figure 8D). This might reflect a tendency to make second eye movements to either of the eyes when eyes are present, increasing the variability in horizontal location.
Scrambled features influence the position of first fixations
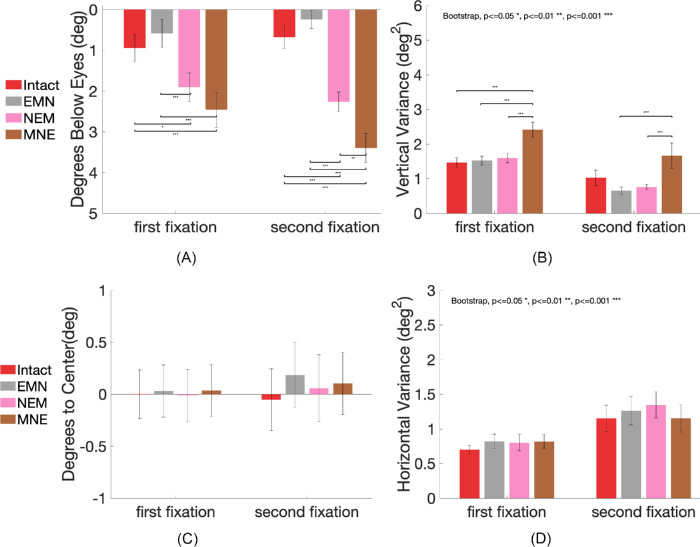
In this section, we investigated the effect of changing the spatial configuration of features on the eye movements to faces (see Figure 1, three conditions in the last row). The first fixations on faces had higher variability in these three conditions (see Figure 4A.g–i). Figure 9A shows the first fixations’ vertical positions in the scrambled conditions. There was a main effect of condition on the first fixations to faces in scrambled feature conditions and the intact condition, F(3,48) = 16.49, p < 0.001. Tukey-corrected comparisons showed that the EMN condition had similar first fixation positions with the intact condition (intact versus EMN meanbelow eyes = 0.94 degrees vs. 0.59 degrees, SE = 0.34 degrees, p = 0.99). The position of the first fixation was significantly lower both in the NEM condition (intact versus NEM meanbelow eyes = 0.94 degrees vs. 1.90 degrees, SE = 0.35 degrees, p = 0.01) and the MNE condition (intact versus MNE meanbelow eyes = 0.94 degrees vs. 2.46 degrees, SE = 0.43 degrees, p < 0.001) than those in the intact condition and the EMN condition (EMN versus NEM, p < 0.001; EMN versus MNE, p < 0.001). For the second fixations, there was a significant main effect across conditions F(3,48) = 43.13, p < 0.001, η2 = 0.73. A Tukey test showed significantly lower second fixation positions on the NEM (NEM meanbelow eyes = 2.26 degrees, SE = 0.24 degrees) and the MNE (MNE meanbelow eyes = 3.39 degrees, SE = 0.36 degrees) compared to the intact face (intact meanbelow eyes = 0.67 degrees, SE = 0.28 degrees) and the EMN condition (EMN meanbelow eyes = 0.24 degrees, SE = 0.22 degrees), respectively, all p < 0.001. The position in the MNE condition was significantly lower than the NEM condition, p < 0.01. However, there was no difference between the intact and the EMN (p = 0.52). Together, the results suggest that lowering the position of the eyes influenced both the first and the second eye movements significantly. When the eyes’ position was not changed, altering the two other features’ position did not change the fixation locations.
Figure 9.
Fixation location and variance in the intact, the no mouth, no nose, and no eyes conditions. Error bars represent standard errors. (A) Mean fixation location in degrees below the eyes’ position in the intact faces. (B) Within-observer fixations vertical variance. (C) Mean fixation location in degrees away from the central vertical line of the face in the horizontal direction, x > 0 represents positions on the right side of the central vertical line, x < 0 represents positions on the left of the central vertical line. (D) Within-observer fixations horizontal variance.
We evaluated whether the changes in the spatial configuration of facial features affected the fixations’ within-observer variability. Figure 9B shows the variance of fixations across the three conditions. For the first fixations, only the variance in the MNE (σ² = 2.42 deg2) was significantly higher than all the other three conditions (intact σ² = 1.46 deg2; EMN σ² = 1.52 deg2, MEN σ² = 1.60 deg2), all p < 0.001. There were no differences among the intact, the EMN, and the MNE conditions, all p > 0.05. As with the second fixations, the MNE condition had a higher variance (σ² = 1.66 deg2) compared to the EMN (σ² = 0.65 deg2) and the NEM conditions (σ² = 0.76 deg2, both p < 0.001), but did not reach significance when compared to the intact condition (σ² = 1.02 deg2, p = 0.07). This suggests that lowering the position of eyes toward the bottom dramatically increases the variances of both first and second fixations.
For the horizontal coordinate, there was no significant main effect of condition for both the first fixations F(3,48) = 0.04, p = 0.98 (EMN meanfrom center = 0.03 degrees, SE = 0.25 degrees; NEM meanfrom center = −0.01 degrees, SE = 0.25 degrees, MNE meanfrom center = 0.04 degrees, SE = 0.25 degrees) and the second fixations F(3,48) =24, p = 0.87 (EMN meanfrom center = 0.19 degrees, SE = 0.31 degrees; NEM meanfrom center = 0.06 degrees, SE = 0.32 degrees, MNE meanfrom center = 0.10 degrees, SE = 0.30 degrees). No significant differences in variance across all conditions for both the first and second fixations’ horizontal positions were found, all p > 0.05 (Figures 9C, 9D).
Distance of first fixations to individual facial features
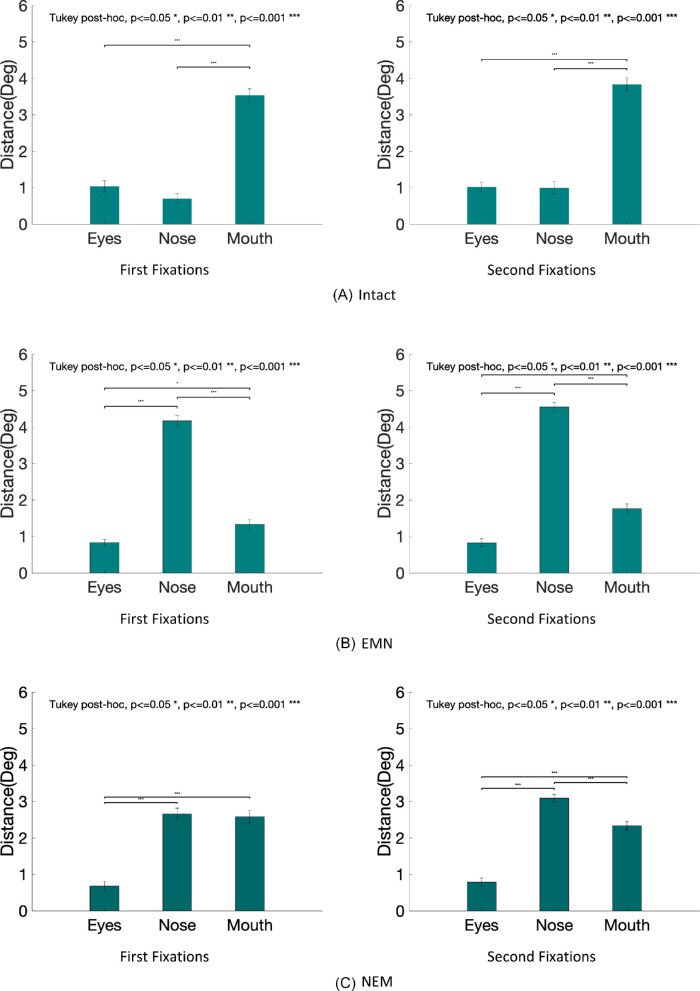
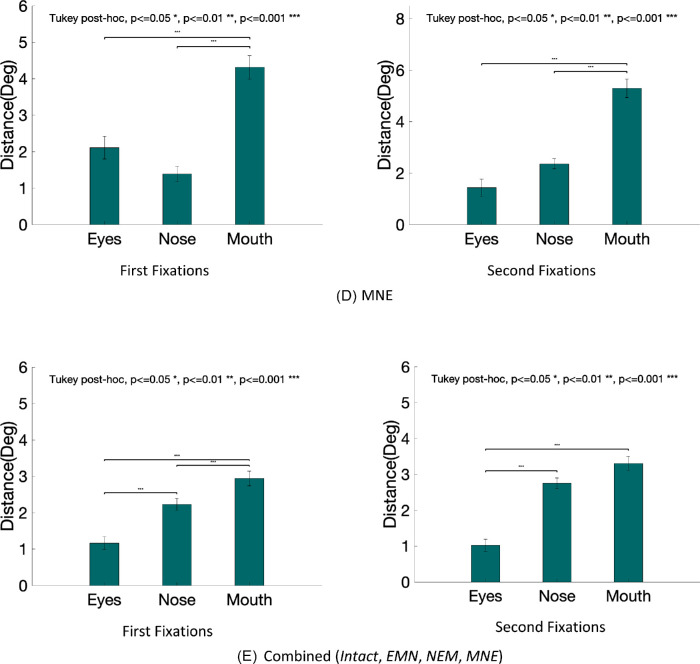
We also evaluated the average first fixations’ distance to the features’ centers (eyes, nose, and mouth) in the intact, EMN, NEM, and MNE conditions. Table 1 shows the mean distance to each feature, standard errors, and p values comparing the distances to each feature. Figure 10 shows the distances for each configuration condition.
Table 1.
Summary of fixation distances to each feature, with standard error in the parenthesis.
| Intact | EMN | NEM | MNE | ||
|---|---|---|---|---|---|
| Eyes | First fixation | 1.04 degrees (0.16) | 0.83 degrees (0.09) | 0.58 degrees (0.13) | 2.11 degrees (0.31) |
| Second fixation | 1.02 degrees (0.12) | 0.83 degrees (0.11) | 0.79 degrees (0.11) | 1.43 degrees (0.33) | |
| Nose | First fixation | 0.70 degrees (0.13) | 4.18 degrees (0.14) | 2.66 degrees (0.16) | 1.39 degrees (0.21) |
| Second fixation | 0.99 degrees (0.17) | 4.55 degrees (0.13) | 3.09 degrees (0.11) | 2.36 degrees (0.20) | |
| Mouth | First fixation | 3.54 degrees (0.17) | 1.33 degrees (0.14) | 2.58 degrees (0.17) | 4.31 degrees (0.32) |
| Second fixation | 3.84 (0.18) | 1.77 degrees (0.13) | 2.33 degrees (0.12) | 5.29 degrees (0.36) | |
| Comparison | First fixation | Eyes < Mouth (p < 0.001) Nose < Mouth (p < 0.001)Nose < Eyes(p = 0.29) | Eyes < Nose (p < 0.001) Eyes < Mouth (p < 0.05) Mouth < Nose (p < 0.001) | Eyes < Nose (p < 0.001) Eyes < Mouth (p < 0.001)Mouth < Nose(p = 0.94) | Eyes < Mouth (p < 0.001) Nose < Mouth (p < 0.001)Nose < Eyes(p = 0.19) |
| Second fixation | Eyes < Mouth (p < 0.001) Nose < Mouth (p < 0.001)Nose < Eyes(p = 0.99) | Eyes < Nose (p < 0.001) Eyes < Mouth (p < 0.001) Mouth < Nose (p < 0.001) | Eyes < Nose (p < 0.001) Eyes < Mouth (p < 0.001) Mouth < Nose (p < 0.001) | Eyes < Mouth (p < 0.001) Nose < Mouth (p < 0.001)Eyes < Nose(p = 0.09) |
All significant p values are in BOLD.
Figure 10.
Distance between fixations and each feature averaged across observers for each condition: intact (A), EMN (B), NEM (C), MNE (D), and all combined (E).
Figure 10.
Continued.
For the intact faces, the first fixation is directed below the eyes. Distances to the nose and eyes are comparable. When the feature locations were manipulated, we found that the first and second fixations were consistently closer to the eyes than the other features. In the intact and the MNE condition, the distances to the eyes and the nose did not reach statistical significance but were still significantly closer than that to the mouth (see Figure 10).
Relationship between preferred fixation for intact faces and influence of the eyes in guiding eye movements
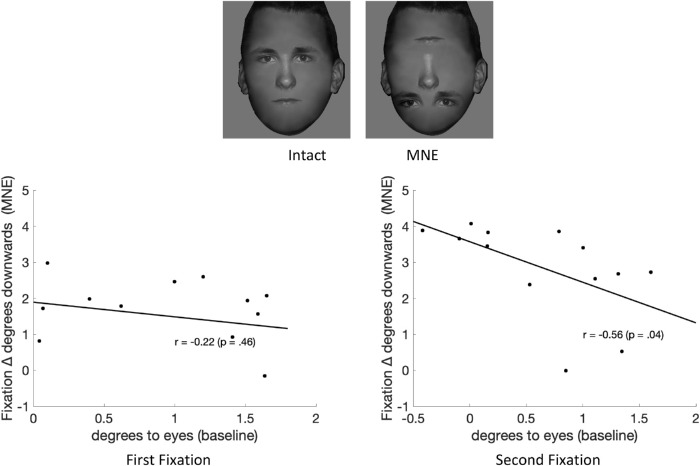
We investigated the possibility that the guidance of eye movements by a facial feature might interact with an observer's preferred point of fixation for intact faces. If so, we would expect observers whose preferred points of fixation were closer to the eyes for the intact condition to be more influenced by changes in the position of the eyes. Such a hypothesis would predict that observers looking closer to the eyes in the intact condition would lower their fixations the most when the eyes’ position is lower along the face, closer to the chin. On the other hand, observers whose preferred points of fixation were closer to the nose might lower their fixations less when the eyes’ position is lower on the face. Figure 11 shows the downward displacement along the face of the first fixations when lowering the eyes’ position (relative to first fixations for the intact condition) versus the distance of the preferred point of fixation to the intact condition's eyes. The first fixations correlation showed a small negative trend but did not reach significance (r = −0.22; p = 0.46), which might because of our small sample size. However, the correlation for the second fixations reached significant for (r = −0.56, p = 0.04; see Figure 11).
Figure 11.
Correlation between preferred fixation distance to the eyes’ position in the intact face (degrees to eyes) and the downward fixation displacement in the MNE condition (for first fixations and second fixations) where the eyes are lowered to the lowest point. Each dot represents one subject.
Behavioral performance
All subjects performed above chance in all conditions except the face outline condition, which contained the same outline for all faces and is expected to result in chance accuracy. Performance improvements across sessions did not reach statistical significance (see Appendix A5 for details), suggesting no learning during the main experiment. Figure 12(a) shows the mean proportion correct (PC) of identification tasks for all nine conditions. We found a main effect of condition on PC (intact meanpc = 0.73, SE = 0.03; floating features meanpc = 0.72, SE = 0.02; face outline meanpc = 0.26, SE = 0.02; no mouth meanpc = 0.68, SE = 0.02; no nose meanpc = 0.71, SE = 0.02; no eyes meanpc = 0.62, SE = 0.02; EMN meanpc = 0.67, SE = 0.02; NEM meanpc = 0.65, SE = 0.03; MNE meanpc = 0.58, SE = 0.03; F(8,108) = 26.57, p < 0.001). Tukey-corrected comparisons showed that performance in the face outline condition was significantly lower than all other conditions (all p < 0.01). We found a significantly lower PC in the no eyes condition compared to the intact condition (p < 0.01) as well as the EMN condition (p < 0.05). Eliminating the eyes had the strongest consequence for face recognition performance among all conditions. We observed a decreasing trend in task performance as the eyes’ position was further away from that in the intact condition (EMN, NEM, and MNE), which indicates the importance of eyes in facial recognition tasks. Figure 12(b) shows the d’ (Green & Swets, 1989) for the identification tasks averaged across subjects. In agreement with the PC analysis, we found a significant main effect of condition on d’, F(8,108) =17.01, p < 0.001. A Tukey post hoc test showed that the d’ in face outline condition was significantly lower than the other conditions, all p < 0.001. In addition, the d’ in the intact (d’ = 1.54, SE = 0.10), the floating features (d’ = 1.53, SE = 0.11), and the EMN conditions (d’ = 1.53, SE = 0.11) were all found to be significantly higher than that of the MNE condition, all p < 0.05, indicating a strong disadvantage of face identification when the eyes were further away from the normal position. When the eyes were in the normal position, there was no statistically significant influence on the identification even when the nose and mouth positions were swapped (intact versus EMN).
Figure 12.
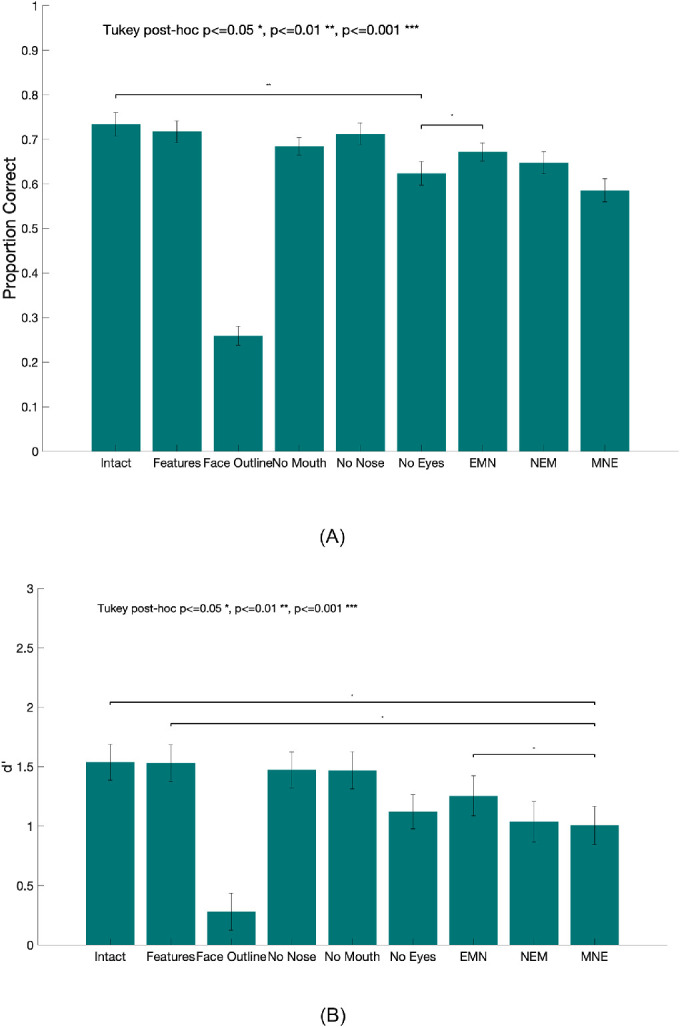
(A) Proportion correct face identification for all nine conditions (mean across observers). Error bars represent standard errors. (B) Index of detectability, d’ for all nine conditions averaged across observers. Note that both proportion correct and d’ for the face outline condition were significantly lower than those in all the other conditions (all p < 0.001). Significant comparisons between the face outline condition and other conditions are not shown in the graph for display purposes.
Experiment 2: Detectability of individual features in the periphery
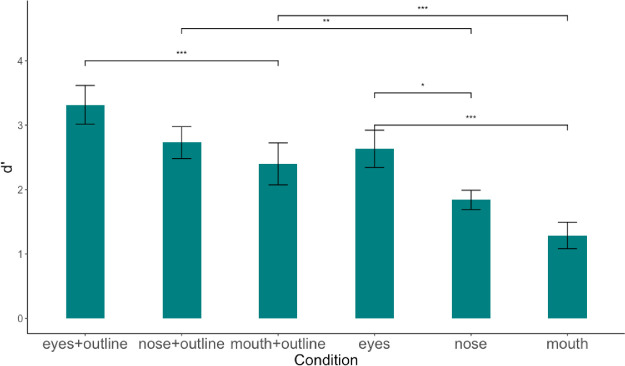
In Experiment 2, we assessed the detectability of the individual features in the visual periphery. We considered the hypothesis that the guidance of eye movements towards faces is partly explained by the visibility of the individual features in the periphery. Therefore, we used single features (both with and without face outline) as stimuli to measure their detectability in the periphery. To our knowledge, this is the first study to test individual feature detectability in the periphery. No study has specifically tested individual feature detection at the fovea as well, so we were not able to make any direct comparison to previous results. Some relevant studies have mixed results. For example, a previous study compared feature discriminability when presented individually within a face outline and found nose and mouth were easier to discriminate compared to the eyes (Logan, Gordon, & Loffler, 2017). Another study evaluated the individual feature displacement detection within normal faces and found advantages of detecting eyes and nose displacement compared to nose for familiar faces (Brooks & Kemp, 2007). In our experiment, we focused on trying to understand whether a feature's detectability in the periphery is related to its contribution to guiding fixations. The effect of face outline was also investigated because results from Experiment 1 showed its importance in reducing the variability of first fixations. In Experiment 2, individual features were briefly presented at random peripheral locations. Participants determined whether a feature was present or not (a yes/no detection task with 50% probability) while maintaining their gaze on a fixation cross.
Methods
Participants
Seven White undergraduate students (4 women, 3 men, ages from 18–21 years) from the University of California, Santa Barbara, were recruited as subjects for credits or volunteers in this experiment. All had normal or corrected-to-normal vision. All participants signed consent forms to participate in the study.
Stimuli
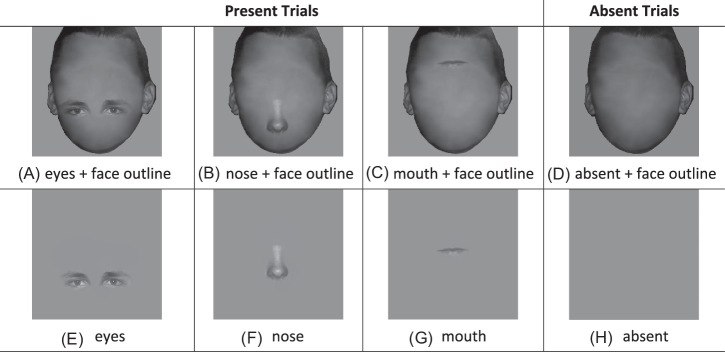
We used the same face identities and display set-up as in Experiment 1. In Experiment 2, we created six conditions with only one facial feature presented at a time: eyes with a face outline, nose with a face outline, mouth with a face outline, and three corresponding versions without a face outline (see Figure 13). All stimuli were embedded with the same Gaussian white noise and adjusted to the same contrast as in Experiment 1. In Experiment 2, the features were presented at the horizontal center but at random vertical locations across trials. To make sure that the features were presented within the same vertical range across different conditions, we used the face outline as a reference. We chose a maximum vertical range so that features could fully fit within the face outline region (e.g. if the eyes’ position is toward the very bottom of the face, then part of the eyes will be outside of the face region). Then, we randomly presented the features within that vertical range. To keep consistency across conditions, for features without face outline condition, we used the same vertical range as the features with face outline.
Figure 13.
Examples of stimuli of six feature-present conditions and two corresponding feature-absent conditions (A–C) features present with face outline, (D) feature absent with face outline, (E–G) features present without face outline, (H) feature absent without face outline.
Procedure
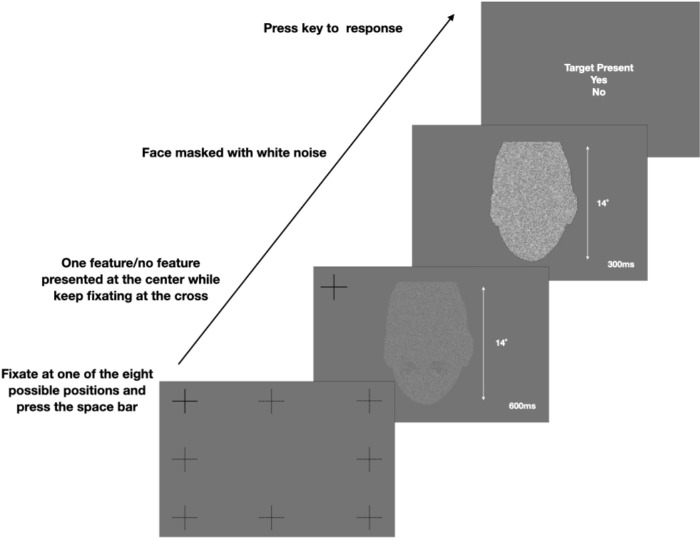
On each trial, participants were asked to fixate at one of the eight fixation crosses and press the space bar when ready. During the feature presentation, they were instructed to maintain their gaze at the fixation cross without moving their eyes. If the fixation drifted by more than 1 degree away from the fixation cross, the trial will be aborted. The features were presented at random vertical positions within the same range in the face outline. For the conditions with face outline, on 50% of the trials, there was a feature presented within the face outline. On the rest of the absent trials, only a face outline was presented. For the conditions without a face outline, on 50% of the trials, there was just a single feature on the screen. On 50% of the absent trials, there was only noise presented on the screen (see Figure 13). After each trial, participants pressed a button to indicate if a feature was present or not (see Figure 14). Subjects finished five sessions for features with a face outline and five sessions for features without a face outline. Each session contained 180 trials presented in random order, out of which 90 trials were feature-absent trials, 90 trials were feature-present trials. Within those 90 feature-present trials, each feature had 30 trials (30 × 3 = 90). Each subject finished 900 trials for features with face outlines and 900 trials for features without face outline (180 trials/session × 5 sessions).
Figure 14.
Timeline for each trial. The participants were required to maintain their gaze at one of the eight fixation positions and press the space bar to initialize the trial. One of the features embedded in white noise was randomly presented on the screen for 600 ms at a random location within a face outline or without a face outline. During the presentation, participants maintained fixation with no eye movements. After a mask was shown right after the face's presentation, participants pressed a key to indicate whether there is a feature presented or not.
Data analysis
To test if there was a difference in feature detectability in the periphery, we ran a 1-way ANOVA to test the main effect of conditions on d’ in the yes/no task for each condition. Subsequently, we used post hoc Tukey HSD comparisons to test the differences between conditions.
Results
Eyes have higher detectability in the periphery with/without face outline
Figure 15 shows the index of detectability, d’, averaged across observers for all feature conditions with and without the face outline. A 1-way ANOVA on the d’ found a significant main effect of condition, F(5, 204) = 16.34, p < 0.001. For the conditions with a face outline, the detectability of the eyes was significantly higher than the mouth (Tukey post hoc, p < 0.001). The detectability of the nose was in-between that of the eyes and mouth but did not reach statistical significance (nose versus eyes, p = 0.15; nose versus mouth, p = 0.76). For the conditions with no face outline, the Tukey post hoc test showed a significantly higher d’ in the eyes condition compared to both that in the nose (p < 0.05) and the mouth condition (p < 0.001; see Figure 15). Even when all the features were presented in random vertical positions on the screen, the eyes still showed an advantage in detectability compared to the other two features regardless of the presence of the face outline. For each feature, we compared the d’ with and without the face outline. The d’ in the eyes + face outline condition was not significantly higher than that in the eyes condition (p = 0.08). However, both d’ for the nose (p < 0.01) and the mouth (p < 0.001) conditions were higher when the face outline was present. This indicating that the presence of face outline supports feature detectability in the periphery.
Figure 15.
Index of detectability (d’) for six conditions: eyes + outline, nose + outline, mouth + outline, eyes, nose, and mouth. Error bars represent standard errors.
Discussion
There is a large literature investigating how eye movements are directed to faces and how these vary across individuals, perceptual tasks, and cultures (Arizpe et al., 2012; Blais, Jack, Scheepers, Fiset, & Caldara, 2008; Mehoudar et al., 2014; Or et al., 2015; Peterson & Eckstein, 2012; Peterson & Eckstein, 2013; Rodger, Kelly, Blais, & Caldara, 2010; Schauder, Park, Tsank, Eckstein, Tadin, & Bennetto, 2019; van Belle et al., 2010b; Xivry, Ramon, Lefevre, & Rossion, 2008). A previous study looked at eye movements to cartoon pictures of entire human and non-human figures and manipulated the eyes’ position within the bodies (Levy et al., 2013). They showed that observers’ gaze was directed preferentially toward the eyes (Levy et al., 2013). The current investigation differed from that previous study in various ways. We concentrated on features within the face (face outline, eyes, nose, and mouth) rather than the entire head and body. We used actual photographs rather than cartoon pictures. We systematically explored the elimination of individual features. We measured smaller spatial scale changes on fixation positions within the face. We measured eye movements while observers engaged in a specific face identification task rather than free viewing. We did not concentrate solely on whether gaze was aimed at the eyes but tried to understand how the various facial features contributed to the guidance of the eye movements towards an observers’ point of fixation (Or et al., 2015; Peterson & Eckstein, 2012; Peterson & Eckstein, 2013). We also investigated how various facial features contributed to minimizing the fixation variability (van Beers, 2007).
We considered various hypotheses: single feature guidance, multiple feature guidance, and the hypothesis that there is an interaction between an observer's preferred point of fixation and the feature used for guidance.
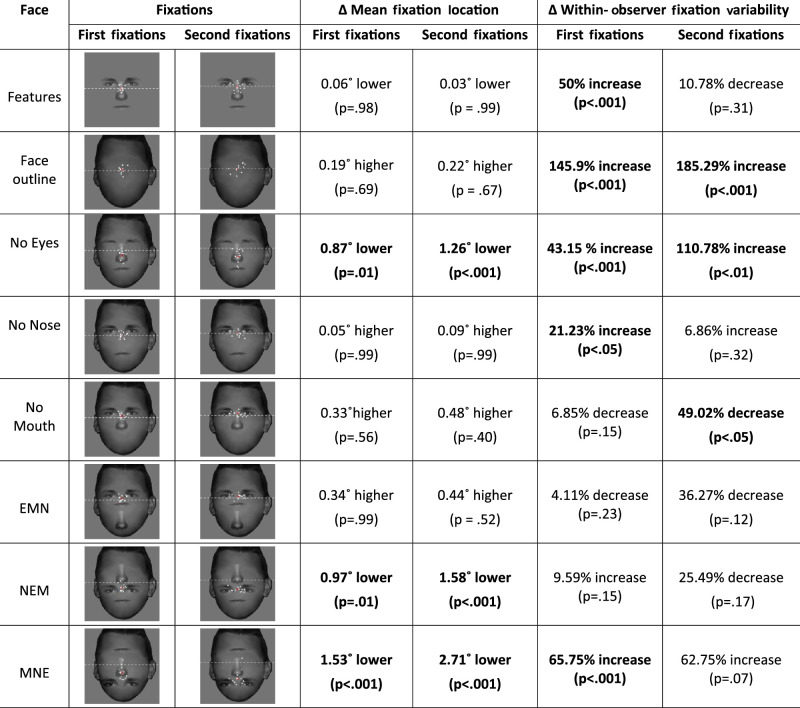
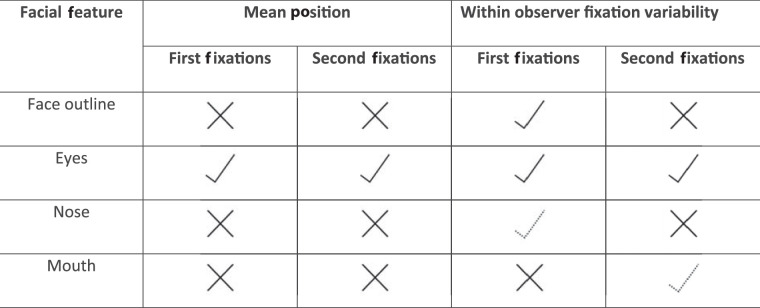
Table 2 summarizes the results for the three experimental manipulations: facial features versus face outline, feature elimination, and feature location swapping. We did not exhaustively investigate all possible combinations or manipulations (e.g. deleting multiple features). Table 3 summarizes the effects of the face outline and individual features on the first eye movement to faces we found in the current study. The explored conditions suggest some conclusions about the contributions of different face properties to the guidance of eye movements.
Table 2.
Summary of the various experimental manipulations and their influence on the mean vertical position of the and the intra-observer variability of the first fixation
|
All comparisons are relative to that of the mean fixations of the intact faces. The dotted line indicates the average first fixations position in the intact condition. Bold values indicate statistically significant differences.
Table 3.
Basic summary of the influence of the face outline and individual features on the fixations to faces based on the findings in the current study.
|
A check indicates a strong effect, while a dotted check symbol indicates a smaller effect. An x indicates that the study did not find a statistically significant effect.
In terms of facial features versus face outline, the results show that humans can utilize both the group of facial features (eyes, nose, and mouth) or the face outline to guide the first eye movement toward the preferred point of fixation. This is consistent with the idea that the human visual system might need a flexible multiple-cue approach to guide the first eye movements towards the face and accommodate the various scenarios in the real world. For faces that are closer and not in the far periphery, the visual system might resolve facial features and rely on them to guide eye movements. Yet, when a face is further in the periphery, the visual system might not resolve the facial features (Levi, 2008; Loomis et al., 2008; Mäkelä et al., 2001), and the brain might need to rely on the face outline to guide the eye movement toward the face. A bias to make eye movements toward the center of the face might also become a driving influence when the inner facial features are missing or jumbled. Our results also show that maximizing the precision of the first fixation (minimizing within-observer variance) requires the joint presence of face outlines and inner facial features. Eliminating either led to a statistically significant increase in fixation variability (see Table 2). When there were no facial features within the face outline, the variability was highest indicating that the brain relies more heavily on internal facial features compared to the face outline for the precision of the first fixation.
In terms of individual features, both the feature elimination and the feature configuration manipulations (see Table 2) supported the idea that the eyes are the most important feature guiding the first eye movement to faces. Eliminating the eyes or swapping their position with the mouth had the largest influence on the mean first fixation position and intra-observer fixation variability (see Table 2). Eliminating the mouth and nose did not influence the mean of the first fixation. The absence of the nose increased the fixation variability. Eliminating the mouth did not change the intra-observer fixation variability for the first fixation. Results for the second fixation were, in general, very consistent with the effects on the first fixation (see Table 2). One exception was the elimination of the mouth that decreased the variability of the second fixation. The mouth competes with the eyes for second fixations. Eliminating increases the second fixation to the eyes and reduces their variability.
What might explain the large influence of the eyes on saccadic eye movement locations and variability? Our findings point to two possible reasons. First, the eyes are consistently more detectable in the periphery than the mouth or the nose in the presence or absence of the face outline. Precise localization of targets in the visual periphery is crucial to guide eye movements to small targets and during search (van Beers, 2007; Eckstein et al., 2001; Findlay, 1997; Semizer & Michel, 2017; Viviani & Swensson, 1982). The higher the visibility of the peripheral, the more accurate the guidance and the lower the fixation variability (van Beers, 2007; Eckstein et al., 2001). Second, the eyes were the most critical facial feature for face identification. Previous studies found that face identification or perception is largely dependent on the feature of the eyes (Diego-Mas, Fuentes-Hurtado, Naranjo, & Alcañiz, 2020; Keil, 2009; Tanaka & Farah, 1993). This is also consistent with the results we found showing that the behavioral performance is lowest when the eyes were eliminated or moved to the bottom of the face, and also with results from previous studies manipulating the eyes. For example, eye-related features (e.g. eye shape, eyebrow thickness, eye size, etc.) were found to be more important for perceptual performance in a face-matching task (Abudarham & Yovel, 2016) compared to other features. When the feature configuration was manipulated (e.g. the distance between features), changes in the eye region were found to be easier to detect, and with shorter response times compared to changes in the mouth region (Brooks & Kemp, 2007; Xu & Tanaka, 2013).
We also investigated whether the degree of influence of the eyes in guiding the fixations was related to the proximity of an individual's preferred point of fixation to the eyes in the normal face. We only found a significant relationship between them for the second fixations, indicating that eyes have a stronger influence in guiding the second fixations for people who have a closer preferred fixation to eyes in normal faces.
There are several caveats to the current findings. First, the results are specific to a specific size (14 degrees height × 10 degrees width) of the face and retinal eccentricity. The interplay between the various features will likely vary across retinal eccentricities and face retinal size. The face outline likely becomes more important as the face becomes more eccentric and individual features more challenging to resolve. Second, we only investigated a face identification task. There is a possibility that different tasks (i.e. emotion discrimination) might affect the features observers use to guide eye movement to faces.
Third, our study measured eye movements with perturbed face stimuli using a blocked design. It is unclear whether the measured changes in fixation location when the eyes are eliminated or spatially displaced would persist if we intermixed all stimuli across trials. If observers need some practice to learn a new fixation strategy for the perturbed stimuli, such learning occurs fast because we did not observe any significant changes across experimental sessions.
An underlying assumption in the data interpretation is that experiments with manipulated and unnatural stimuli can be informative to infer strategies and computations with natural stimuli. This assumption is common in vision science and various approaches that perturb the stimuli with visual noise (Abbey & Eckstein, 2006; Pelli & Farell, 1999), bubbles (Schyns, Bonnar, & Gosselin, 2002; Spezio, Adolphs, Hurley, & Piven, 2007), and cue manipulations (Landy, Banks, & Knill, 2011). In the present paper, the assumption is that observers use the same facial properties to guide the search for the intact and scrambled feature faces. However, it could be that the eye movements to faces with scrambled features tell us little about which features are important in guiding fixations to intact faces. For example, what if observers utilize the mouth to guide the search in intact faces, and then when the eyes are positioned downward along the face, they changed their strategy to use the eyes. Although possible, various reasons point against this scenario. We investigated eight manipulations of the internal facial features and the face outline, and only three resulted in significant differences in the mean location of the first fixations. A strategy to use different features across face manipulations would likely result in disparate results across conditions: fixations closest to one feature in one scrambled condition and closest to a different feature in another manipulation. Our findings find the opposite, a consistent influence of the eyes’ position on fixation locations and the strongest effects on fixations when eliminating the eyes from the face.
The work also assumes that the presence of the noise does not interact with the features and influences the eye movement strategy. For the case of intact faces, the preferred point of fixation is similar for greyscale images in white noise and full-color images with no additive noise (Peterson & Eckstein, 2013). However, the assumption was not tested for the images with an eliminated feature. Thus, a possibility remains that there could be an interaction between the elimination of a feature and the white noise, which could result in varying eye movement strategies when the noise is present vs. absent.
Our analysis considered the contribution of individual features but did not focus on any additional benefit from the holistic processing that depends on all the parts and configuration at once (Farah, Wilson, Drain, & Tanaka, 1998b; Fitousi, 2020; Richler, Palmeri, & Gauthier, 2012; Tanaka & Farah, 1993; van Belle et al., 2010a). It might be that unique benefits to eye movement guidance arise from the presence of all features with their typical configuration. Yet, some manipulations arguably disrupted the holistic processing but had little effect on fixations’ location or variability. Thus, it might be that the guidance of eye movements to faces might be less influenced by disruptions to holistic processing than perceptual performance (but see Schwarzer, Huber, & Dümmler, 2005 for relationships between holistic processing and eye movement behavior).
To summarize, the current findings support the idea that both the face outline and the features guide first eye movements to faces. The internal facial features play a critical role in reducing fixation variability. The eyes are the most detectable facial feature in the visual periphery. They are also the most informative feature for face identification and have a dominant role in guiding and reducing fixation variability. Together, the findings increase the understanding of oculomotor behavior to faces.
Acknowledgments
Research was sponsored by the US Army Research Office and was accomplished under Contract Number W911NF-19-D-0001 for the Institute for Collaborative Biotechnologies. The views and conclusions contained in this document are those of the authors and should not be interpreted as representing the official policies, either expressed or implied, of the US Government. The US Government is authorized to reproduce and distribute reprints for Government purposes, notwithstanding any copyright notation herein.
Commercial relationships: none.
Corresponding author: Nicole X. Han.
Email: xhan01@ucsb.edu.
Address: Department of Psychological and Brain Sciences, University of California, Santa Barbara, Santa Barbara, CA 93106-9660, USA.
Appendix A1. Individual faces
Figure A1.
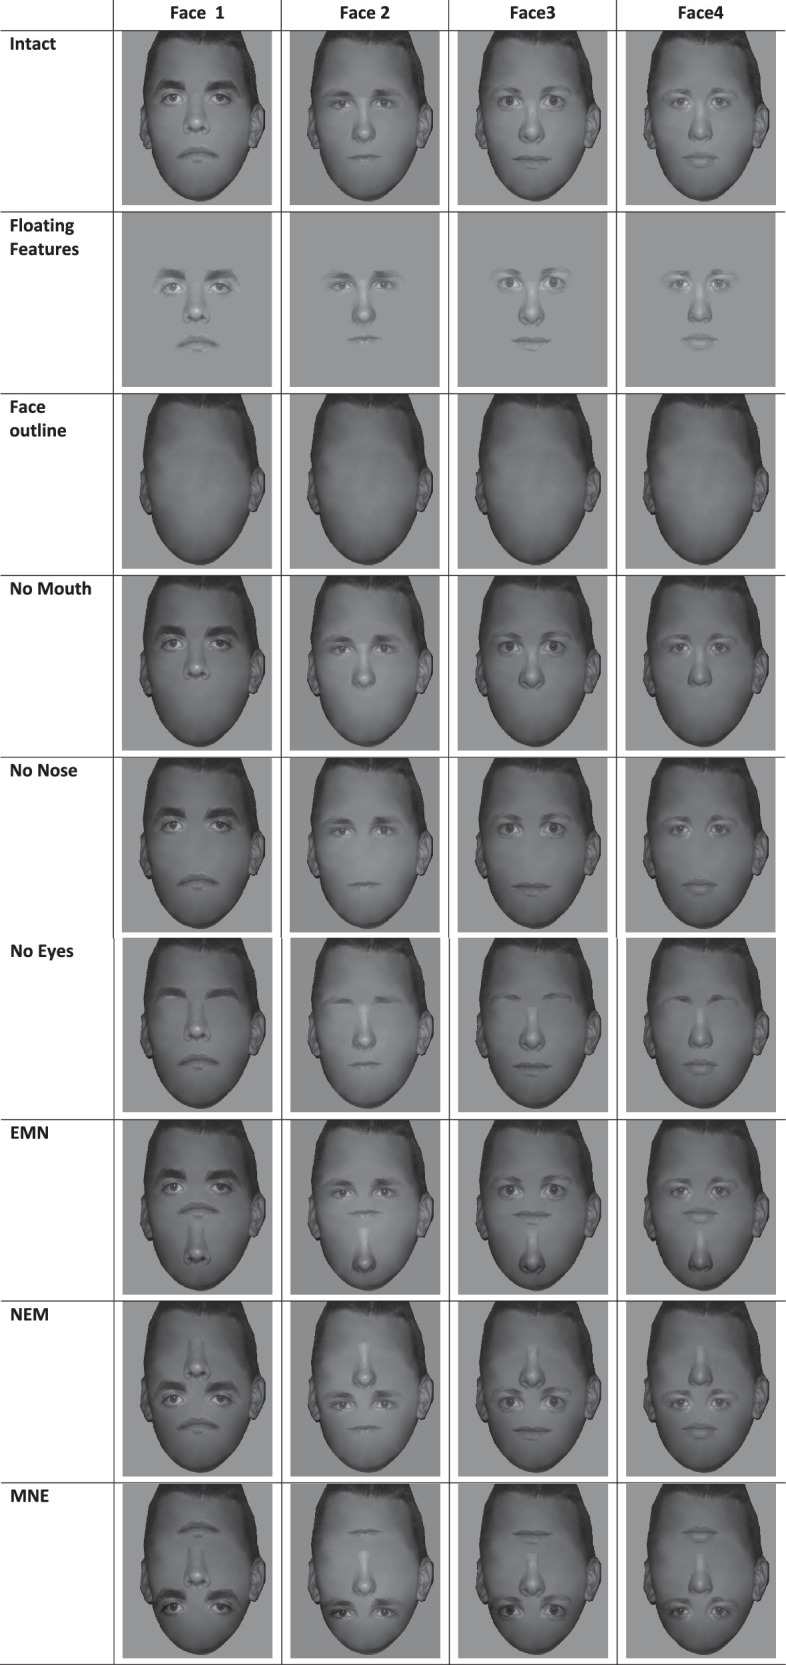
All four identity faces in nine conditions. The faces are presented without the additive Gaussian luminance noise. In the experiment, independent Gaussian noise had a mean = 0, SD = 10 cd/m2, was added to each pixel value of the faces.
Appendix A2. Power analysis for first fixation
Relationship between the standard error of the first fixation to a face, number of observers, and number of trials per observer.
The estimates were calculated from the first fixations to faces of a separate data set of 300 observers, including previously published studies (Or et al., 2015; Peterson & Eckstein, 2012; Peterson & Eckstein, 2013; Peterson & Eckstein, 2014; Tsank & Eckstein, 2017) and additional unpublished data. For all observers, the fixations were measured during a face identification task. The graphed standard errors were estimated from sampling different mutually exclusive groups of N observers and M trials from the 300 observers (Figure A.2.A). We then computed the estimated standard errors across observers for each group and averaged the measure across sampled groups. For example, for groups of five observers, we sampled M trials from 60 different groups of five observers. Figure A2.B. shows the minimum difference that can be detected with a t-test with a significance level of 0.05 for a varying number of observers and trials per observer. For our current experiment with 13 observers and 210 trials, the standard error of the measurements is estimated to be 0.35 degrees. The minimum t-value needed to reach a p < 0.05 with df = 12 is 1.782. Therefore, using the t-test formula, we should be able to detect a difference of around 0.62 degrees. The estimated minimum detectable difference will vary from this estimate when an ANOVA is used and also if a multiple comparison correction (e.g. false discovery rate) is adopted.
Figure A2.
(A) Estimated standard error across observers vs. the number of trials per observer. Different lines correspond to varying numbers of observers in the study; (B) The minimum difference in degrees of visual angle that can be detected with t-test at a significance level of 0.05. The graph shows the minimum detectable difference as a function of the number of trials per observer.
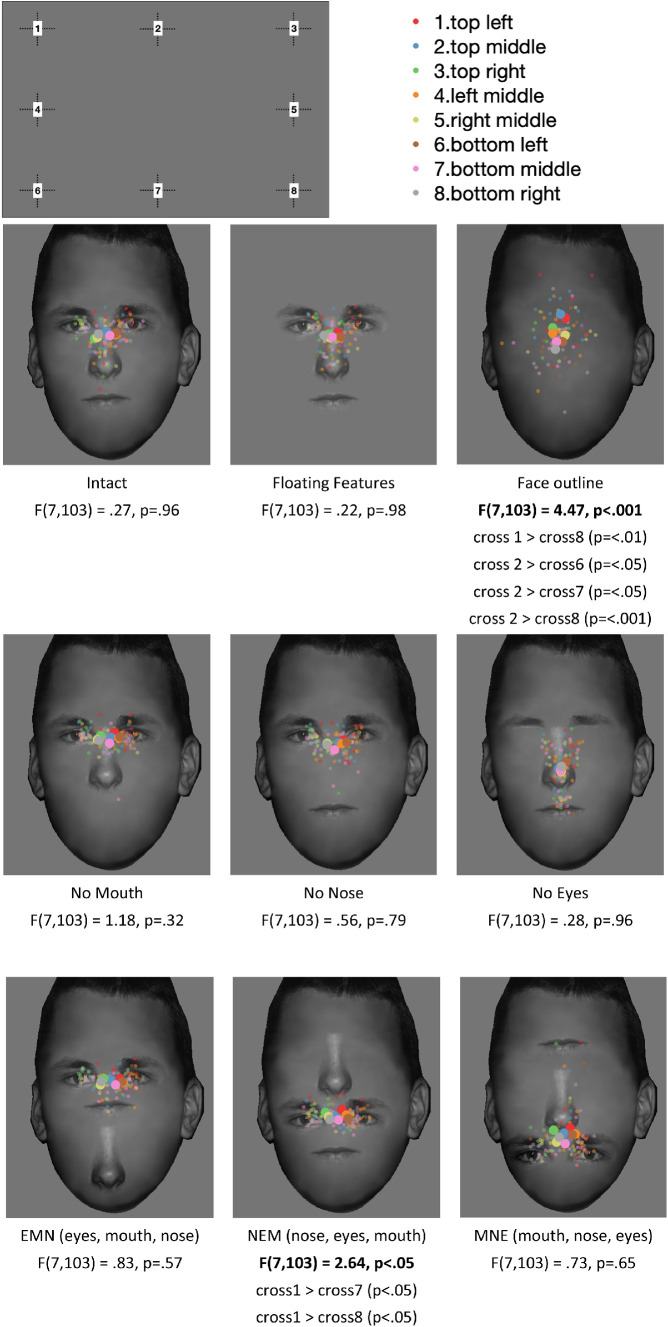
Appendix A3. Effects of initial position of fixation cross
Since the screen was a rectangle, the distances between the initial eight fixation crosses to the face were different. We evaluated the average first fixation vertical positions on the face based on the starting fixation point. For each condition, a 1-way ANOVA on the first fixation position showed no significant main effect of initial starting points on the first fixations in all the conditions except in the face outline condition, F(7,103) = 4.47, p < 0.001, and in the NEM condition, F(7,103) = 2.64, p < 0.05. See Figure A3 for p values and Tukey post hoc test statistics.
Figure A3.
First fixations to faces for different initial fixation cross positions for the various conditions. Smaller dots are individual subjects’ average first fixations, and large dots are the average of all subjects’ first fixations.
Appendix A4. Distribution of fixations in horizontal direction
Figure A4.
(A) Distribution of the first fixation in the horizontal direction; (B) Distribution of the second fixation in the horizontal direction. Solid lines represent means; dashed lines represent medians.
Figure A4.
Continued.
Appendix A5. Learning effects on eye movements
No effect of learning or changes of initial fixation variances
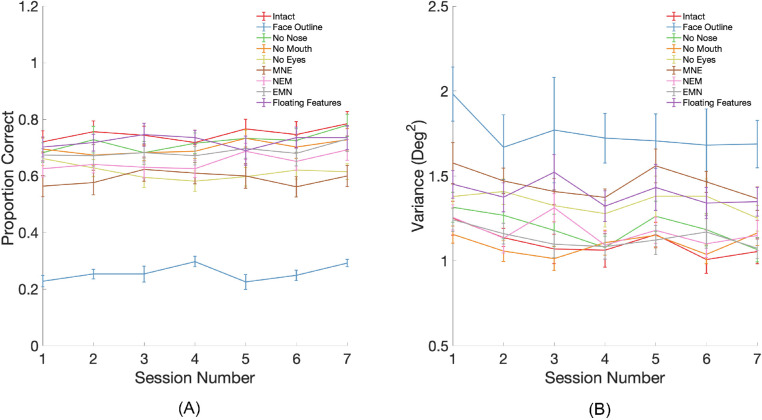
Here, we show the analyses suggesting no significant effect of learning across sessions in the experiment. Figure A.4.A. shows proportion correct across sessions. Figure A.4.B shows the variance of first fixations across sessions. The error bars were estimated using bootstrap sampling (10,000 samples) for each condition and session. To assess whether there was an increase in performance or a decrease in fixation variance across sessions, we fit a regression line to the measure vs. sessions for each condition from each bootstrap sample. A slope of 0 would indicate no learning effect. A significant positive slope on proportion correct would suggest learning. A significant negative slope for the variance would suggest an increase in the precision of the saccades with practice. No condition resulted in a significant regression coefficient greater than 0 (all p > 0.05). Similarly, we found no significant decrease in the variance of the first fixations (all p > 0.05).
Figure A5.
(A) Proportion correct face identification across sessions; (B) Variance of the first fixations across sessions.
References
- Abbey, C. K., & Eckstein, M. P. (2006). Classification images for detection, contrast discrimination, and identification tasks with a common ideal observer. Journal of Vision , 6(4), 335–355. [DOI] [PubMed] [Google Scholar]
- Abudarham, N., & Yovel, G. (2016). Reverse engineering the face space: Discovering the critical features for face identification. Journal of Vision , 16(3), 40. [DOI] [PubMed] [Google Scholar]
- Arizpe, J., Kravitz, D. J., Yovel, G., & Baker, C. I. (2012). Start position strongly influences fixation patterns during face processing: difficulties with eye movements as a measure of information use. PLoS One , 7(2), e31106. [DOI] [PMC free article] [PubMed] [Google Scholar]
- Bayle, D. J., Schoendorff, B., Hénaff, M.-A., & Krolak-Salmon, P. (2011). Emotional facial expression detection in the peripheral visual field. PLoS One , 6(6), e21584. [DOI] [PMC free article] [PubMed] [Google Scholar]
- Beutter, B. R., Eckstein, M. P., & Stone, L. S. (2003). Saccadic and perceptual performance in visual search tasks. I. Contrast detection and discrimination. Journal of the Optical Society of America. A, Optics, Image Science, and Vision , 20(7), 1341–1355. [DOI] [PubMed] [Google Scholar]
- Blais, C., Jack, R. E., Scheepers, C., Fiset, D., & Caldara, R. (2008). Culture shapes how we look at faces. PLoS One , 3(8), e3022. [DOI] [PMC free article] [PubMed] [Google Scholar]
- Bombari, D., Mast, F. W., & Lobmaier, J. S. (2009). Featural, configural, and holistic face-processing strategies evoke different scan patterns. Perception , 38(10), 1508–1521. [DOI] [PubMed] [Google Scholar]
- Brooks, K. R., & Kemp, R. I. (2007). Sensitivity to feature displacement in familiar and unfamiliar faces: beyond the internal/external feature distinction. Perception , 36(11), 1646–1659. [DOI] [PubMed] [Google Scholar]
- Brown, V., Huey, D., & Findlay, J. M. (1997). Face detection in peripheral vision: do faces pop out? Perception , 26(12), 1555–1570. [DOI] [PubMed] [Google Scholar]
- Castelhano, M. S., & Heaven, C. (2010). The relative contribution of scene context and target features to visual search in scenes. Attention, Perception & Psychophysics , 72(5), 1283–1297. [DOI] [PubMed] [Google Scholar]
- Chen, X., & Zelinsky, G. J. (2006). Real-world visual search is dominated by top-down guidance. Vision Research , 46(24), 4118–4133. [DOI] [PubMed] [Google Scholar]
- Crouzet, S. M., Kirchner, H., & Thorpe, S. J. (2010). Fast saccades toward faces: Face detection in just 100 ms. Journal of Vision , 10(4), 16.1–17. [DOI] [PubMed] [Google Scholar]
- Diego-Mas, J. A., Fuentes-Hurtado, F., Naranjo, V., & Alcañiz, M. (2020). The influence of each facial feature on how we perceive and interpret human faces. I-Perception , 11(5), 2041669520961123. [DOI] [PMC free article] [PubMed] [Google Scholar]
- Eckstein, M. P., Beutter, B. R., & Stone, L. S. (2001). Quantifying the performance limits of human saccadic targeting during visual search. Perception , 30(11), 1389–1401. [DOI] [PubMed] [Google Scholar]
- Eckstein, M. (2017). Probabilistic computations for attention, eye movements, and search. Annu. Rev. Vis. Sci. , 3, 18.1–18.24. [DOI] [PubMed] [Google Scholar]
- Farah, M. J., Wilson, K. D., Drain, M., & Tanaka, J. N. (1998b). What is “special” about face perception? Psychological Review , 105(3), 482–498. [DOI] [PubMed] [Google Scholar]
- Farah, M. J., Wilson, K. D., Drain, M., & Tanaka, J. (1998a). What is “special” about face perception? Psychological Review , 105(3), 482–498. [DOI] [PubMed] [Google Scholar]
- Findlay, J. M. (1997). Saccade target selection during visual search. Vision Research , 37(5), 617–631. [DOI] [PubMed] [Google Scholar]
- Fitousi, D. (2020). Decomposing the composite face effect: Evidence for non-holistic processing based on the ex-Gaussian distribution. Quarterly Journal of Experimental Psychology , 73(6), 819–840. [DOI] [PubMed] [Google Scholar]
- Goren, D., & Wilson, H. R. (2006). Quantifying facial expression recognition across viewing conditions. Vision Research , 46(8), 1253–1262. [DOI] [PubMed] [Google Scholar]
- Green, D. M., & Swets, J. A. (1989). Signal Detection Theory and Psychophysics. Westport, CT: Peninsula Publishing. [Google Scholar]
- Gurler, D., Doyle, N., Walker, E., Magnotti, J., & Beauchamp, M. (2015). A link between individual differences in multisensory speech perception and eye movements. Attention, Perception, & Psychophysics , 77(4), 1333–1341. [DOI] [PMC free article] [PubMed] [Google Scholar]
- Haxby, J. V., Hoffman, E. A., & Gobbini, M. I. (2000). The distributed human neural system for face perception. Trends in Cognitive Sciences , 4, 223–233. [DOI] [PubMed] [Google Scholar]
- Hessels, R. S. (2020). How does gaze to faces support face-to-face interaction? A review and perspective. Psychonomic Bulletin & Review , 27(5), 856–881. [DOI] [PMC free article] [PubMed] [Google Scholar]
- Hsiao, J., & Cottrell, G. (2008). Two fixations suffice in face recognition. Psychological Science , 19(10), 998–1006. [DOI] [PMC free article] [PubMed] [Google Scholar]
- Kanan, C., Bseiso, D. N. F., Ray, N. A., Hsiao, J. H., & Cottrell, G. W. (2015). Humans have idiosyncratic and task-specific scanpaths for judging faces. Vision Research , 108, 67–76. [DOI] [PubMed] [Google Scholar]
- Kanwisher, N., McDermott, J., & Chun, M. M. (1997). The fusiform face area: a module in human extrastriate cortex specialized for face perception. The Journal of Neuroscience , 17(11), 4302–4311. [DOI] [PMC free article] [PubMed] [Google Scholar]
- Keil, M. S. (2009). “I look in your eyes, honey”: internal face features induce spatial frequency preference for human face processing. PLoS Computational Biology , 5(3), e1000329. [DOI] [PMC free article] [PubMed] [Google Scholar]
- Kleiner, M., Brainard, D. H., Pelli, D., Ingling, A., Murray, R., & Broussard, C. (2007). What's new in Psychtoolbox-3. Perception , 36, 1–16. [Google Scholar]
- Koehler, K., & Eckstein. (2017a). Temporal and peripheral extraction of contextual cues from scenes during visual search. Journal of Vision , 17(2), 16. [DOI] [PubMed] [Google Scholar]
- Koehler, K., & Eckstein, M. (2017b). Beyond Scene Gist: Objects guide search more than backgrounds. Journal of Experimental Psychology. Human Perception and Performance , 43(60), 1177–1193. [DOI] [PubMed] [Google Scholar]
- Kowler, E. (2011). Eye movements: The past 25years. Vision Research , 51(13), 1457–1483. [DOI] [PMC free article] [PubMed] [Google Scholar]
- Kowler, E., & Blaser, E. (1995). The accuracy and precision of saccades to small and large targets. Vision Research , 35(12), 1741–1754. [DOI] [PubMed] [Google Scholar]
- Landy, M. S., Banks, M. S., & Knill, D. C. (2011). Ideal-observer models of cue integration. Sensory Cue Integration, 10.1093/acprof:oso/9780195387247.003.0001. [DOI] [Google Scholar]
- Levi, D. M. (2008). Crowding—An essential bottleneck for object recognition: A mini-review. Vision Research , 48(5), 635–654. [DOI] [PMC free article] [PubMed] [Google Scholar]
- Levy, J., Foulsham, T., & Kingstone, A. (2013). Monsters are people too. Biology Letters , 9(1), 20120850. [DOI] [PMC free article] [PubMed] [Google Scholar]
- Logan, A. J., Gordon, G. E., & Loffler, G. (2017). Contributions of individual face features to face discrimination. Vision Research , 137, 29–39. [DOI] [PubMed] [Google Scholar]
- Loomis, J. M., Kelly, J. W., Pusch, M., Bailenson, J. N., & Beall, A. C. (2008). Psychophysics of perceiving eye-gaze and head direction with peripheral vision: Implications for the dynamics of eye-gaze behavior. Perception , 37(9), 1443–1457. [DOI] [PubMed] [Google Scholar]
- Mäkelä, P., Näsänen, R., Rovamo, J., & Melmoth, D. (2001). Identification of facial images in peripheral vision. Vision Research , 41(5), 599–610. [DOI] [PubMed] [Google Scholar]
- Malcolm, G. L., & Henderson, J. M. (2010). Combining top-down processes to guide eye movements during real-world scene search. Journal of Vision , 10(2), 4.1–4.11. [DOI] [PubMed] [Google Scholar]
- McCarthy, G., Puce, A., Gore, J. C., & Allison, T. (1997). Face-Specific Processing in the Human Fusiform Gyrus. Journal of Cognitive Neuroscience , 9(5), 605–610. [DOI] [PubMed] [Google Scholar]
- Mehoudar, E., Arizpe, J., Baker, C. I., & Yovel, G. (2014). Faces in the eye of the beholder: Unique and stable eye scanning patterns of individual observers. Journal of Vision , 14(7), 6. [DOI] [PMC free article] [PubMed] [Google Scholar]
- Or, C. C.-F., Peterson, M. F., & Eckstein, M. P. (2015). Initial eye movements during face identification are optimal and similar across cultures. Journal of Vision , 15(13), 12. [DOI] [PMC free article] [PubMed] [Google Scholar]
- Pelli, D. G., & Farell, B. (1999). Why use noise? Journal of the Optical Society of America. A, Optics, Image Science, and Vision , 16(3), 647–653. [DOI] [PubMed] [Google Scholar]
- Pérez, P., Gangnet, M., & Blake, A. (2003). Poisson image editing. ACM Transactions on Graphics , 22(3), 313–318. [Google Scholar]
- Peterson, M. F., & Eckstein, M. P. (2012). Looking just below the eyes is optimal across face recognition tasks. Proceedings of the National Academy of Sciences of the United States of America , 109(48), E3314–3323. [DOI] [PMC free article] [PubMed] [Google Scholar]
- Peterson, M. F., & Eckstein, M. P. (2013). Individual differences in eye movements during face identification reflect observer-specific optimal points of fixation. Psychological Science. 24(7), 1216–1225. [DOI] [PMC free article] [PubMed] [Google Scholar]
- Peterson, M. F., & Eckstein, M. P. (2014). Learning optimal eye movements to unusual faces. Vision Research , 99, 57–68. [DOI] [PMC free article] [PubMed] [Google Scholar]
- Poletti, M., Intoy, J., & Rucci, M. (2020). Accuracy and precision of small saccades. Scientific Reports , 10(1), 16097. [DOI] [PMC free article] [PubMed] [Google Scholar]
- Richler, J. J., Palmeri, T. J., & Gauthier, I. (2012). Meanings, mechanisms, and measures of holistic processing. Frontiers in Psychology , 3(DEC), 1–6. [DOI] [PMC free article] [PubMed] [Google Scholar]
- Rodger, H., Kelly, D. J., Blais, C., & Caldara, R. (2010). Inverting faces does not abolish cultural diversity in eye movements. Perception , 39(11), 1491–1503. [DOI] [PubMed] [Google Scholar]
- Rossion, B., Hanseeuw, B., & Dricot, L. (2012). Defining face perception areas in the human brain: A large-scale factorial fMRI face localizer analysis. Brain and Cognition , 79, 138–157. [DOI] [PubMed] [Google Scholar]
- Schauder, K. B., Park, W. J., Tsank, Y., Eckstein, M. P., Tadin, D., & Bennetto, L. (2019). Initial eye gaze to faces and its functional consequence on face identification abilities in autism spectrum disorder. Journal of Neurodevelopmental Disorders , 11(1), 42. [DOI] [PMC free article] [PubMed] [Google Scholar]
- Schwarzer, G., Huber, S., & Dümmler, T. (2005). Gaze behavior in analytical and holistic face processing. Memory & Cognition , 33(2), 344–354. [DOI] [PubMed] [Google Scholar]
- Schyns, P. G., Bonnar, L., & Gosselin, F. (2002). Show me the features! Understanding recognition from the use of visual information. Psychological Science , 13(5), 402–409. [DOI] [PubMed] [Google Scholar]
- Semizer, Y., & Michel, M. M. (2017). Intrinsic position uncertainty impairs overt search performance. Journal of Vision , 17(9), 13–13. [DOI] [PubMed] [Google Scholar]
- Smith, F. W., & Rossit, S. (2018). Identifying and detecting facial expressions of emotion in peripheral vision. PLoS One , 13(5), e0197160. [DOI] [PMC free article] [PubMed] [Google Scholar]
- Spezio, M. L., Adolphs, R., Hurley, R. S. E., & Piven, J. (2007). Analysis of face gaze in autism using “Bubbles”. Neuropsychologia , 45(1), 144–151. [DOI] [PubMed] [Google Scholar]
- Stacchi, L., Ramon, M., Lao, J., & Caldara, R. (2019). Neural representations of faces are tuned to eye movements. The Journal of Neuroscience , 39(21), 4113–4123. [DOI] [PMC free article] [PubMed] [Google Scholar]
- Tanaka, J. W., & Sengco, J. A. (1997). Features and their configuration in face recognition. Memory & Cognition , 25(5), 583–592. [DOI] [PubMed] [Google Scholar]
- Tanaka, J., & Farah, M. J. (1993). Parts and wholes in face recognition, 46A, 225–45. [DOI] [PubMed] [Google Scholar]
- Tsank, Y., & Eckstein, M. P. (2017). Domain specificity of oculomotor learning after changes in sensory processing. The Journal of Neuroscience , 37(47), 11469–11484. [DOI] [PMC free article] [PubMed] [Google Scholar]
- Tsao, D. Y., & Livingstone, M. S. (2008). Mechanisms of face perception. Annual Review of Neuroscience , 31, 411–437. [DOI] [PMC free article] [PubMed] [Google Scholar]
- van Beers, R. J. (2007). The sources of variability in saccadic eye movements. Journal of Neuroscience , 27(33), 8757–8770. [DOI] [PMC free article] [PubMed] [Google Scholar]
- van Belle, G., De Graef, P., Verfaillie, K., Busigny, T., & Rossion, B. (2010a). Whole not hole: Expert face recognition requires holistic perception. Neuropsychologia , 48(9), 2620–2629. [DOI] [PubMed] [Google Scholar]
- van Belle, G., Ramon, M., Lefèvre, P., & Rossion, B. (2010b). Fixation patterns during recognition of personally familiar and unfamiliar faces. Frontiers in Psychology , 1, 20. [DOI] [PMC free article] [PubMed] [Google Scholar]
- Viviani, P., & Swensson, R. G. (1982). Saccadic eye movements to peripherally discriminated visual targets. Journal of Experimental Psychology. Human Perception and Performance , 8(1), 113–126. [DOI] [PubMed] [Google Scholar]
- Xivry, J. O., Ramon, M., Lefèvre, P., & Rossion, B. (2008). Reduced fixation on the upper area of personally familiar faces following acquired prosopagnosia. Journal of Neuropsychology , 2(1), 245–268. [DOI] [PubMed] [Google Scholar]
- Xu, B., & Tanaka, J. W. (2013). Does face inversion qualitatively change face processing: An eye movement study using a face change detection task. Journal of Vision , 13(2), 22. [DOI] [PubMed] [Google Scholar]


