Figure 8.

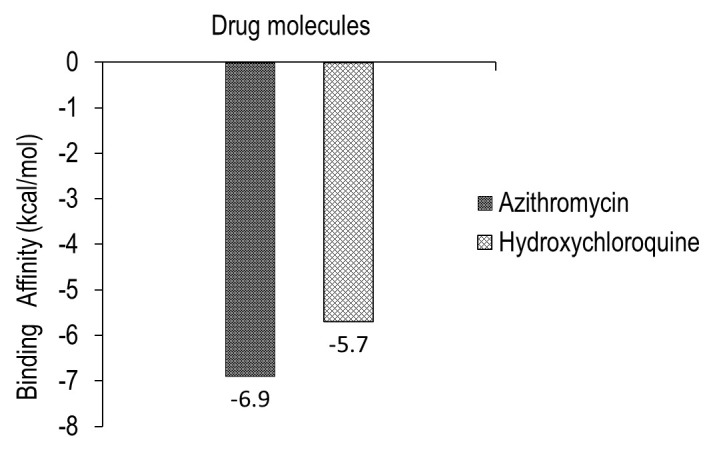
Graphical representation of binding energy of both the drugs with surface target glycoprotein from minimum to maximum energy score in kcal/mol.

Graphical representation of binding energy of both the drugs with surface target glycoprotein from minimum to maximum energy score in kcal/mol.