Abstract
Aims
Dietary Mg2+ deficiency (MgD) impairs hippocampus‐dependent memory in mice; however, the molecular mechanisms underlying MgD‐induced memory impairments are unclear. Here, we investigated the molecular signatures in the hippocampus of MgD mice by analyzing the hippocampal transcriptome.
Methods
We performed RNA‐sequencing of the hippocampal transcriptome of MgD mice. We used gene ontology analyses and quantitative real‐time PCR to validate the RNA‐sequencing results.
Results
mRNAs for neuroinflammation‐related genes were upregulated in the hippocampus and cortex of MgD mice.
Conclusion
MgD induces neuroinflammation in the mouse brain, including the hippocampus and cortex. Our findings suggest that MgD‐induced neuroinflammation triggers the impairments of hippocampus‐dependent memory.
Keywords: hippocampus‐dependent memory, magnesium deficiency, microglia, neuroinflammation, transcriptome
This study aimed to identify the molecular signatures of dietary Mg2+ deficits (MgD) ‐induced deficits of hippocampus‐dependent memory performance in mice by analyzing the hippocampal transcriptome. MgD mice exhibited that mRNAs for neuroinflammation‐related genes were upregulated in the hippocampus and cortex, suggesting that MgD induces neuroinflammation in the mouse brain. Our findings suggest that MgD‐induced neuroinflammation triggers the memory impairments.

1. INTRODUCTION
Magnesium (Mg2+) is an essential mineral for maintaining normal cellular functions by functioning as a cofactor in more than 300 enzymatic reactions. 1 , 2 , 3 Mg2+ deficiency (MgD) disturbs the homeostasis of numerous biological processes, causing chronic and acute diseases such as metabolic syndrome, 4 type 2 diabetes, 5 and hypertension. 6 Importantly, Mg2+ is required for the voltage‐dependent blockade of N‐methyl‐D‐aspartate‐type glutamate receptors, thereby controlling their opening, 7 , 8 , 9 and also contributes to synaptic plasticity such as long‐term potentiation.
Consistently, Mg has been shown to play an important role in learning and memory. Increasing brain Mg2+ concentration improves learning ability, working memory, and short‐ and long‐term memory in rats, 10 while MgD impairs fear memory formation. 11 , 12 We previously investigated the effects of MgD on brain function and found that MgD diet‐fed mice have deficits in hippocampus‐dependent memories such as contextual fear, spatial, and social recognition memories, while they have normal amygdala‐ and insular cortex‐dependent conditioned taste aversion memory, locomotor activity, and emotional behaviors. 13 Conversely, MgD mice have normal spine density and morphology of hippocampal neurons. Thus, previous studies have shown that MgD impairs hippocampus‐dependent memory without affecting hippocampal neuron morphology. 13 However, the molecular mechanisms underlying the impairments of hippocampus‐dependent memory by MgD remain unclear. In this study, we analyzed the hippocampal transcriptome in MgD mice to identify the molecular signatures of MgD‐induced deficits of hippocampus‐dependent memory performance in mice.
2. METHODS
2.1. Animals
All experiments were conducted according to the Guide for the Care and Use of Laboratory Animals, Japan Neuroscience Society and Tokyo University of Agriculture. All animal experiments performed in this study were approved by the Animal Care and Use Committee of Tokyo University of Agriculture. Male C57BL/6N mice were obtained from Charles River (Yokohama, Japan). The mice were housed in cages of 5 or 6, maintained on a 12 hours light/dark cycle, and allowed ad libitum access to pellet food and water. The mice were at least 12 weeks of age at the start of the experiments, and all samples were collected during the light phase of the cycle. All experiments were conducted blind to the treatment condition of the mice.
2.2. MgD treatment
Dietary MgD was induced by using paired feeding procedures. 13 , 14 , 15 , 16 , 17 To habituate the mice to a powdered diet, both groups were given a powdered Mg2+‐containing diet ad libitum for 1 week. The mice were divided randomly into the MgD (n = 9) and control (Ctrl, n = 11) groups. The mice received a powdered MgD AIN‐93 or Ctrl AIN‐93 diet (Table S1), respectively, ad libitum during the treatment period (weeks 0‐6). The Ctrl group was pair‐fed with the MgD group.
2.3. Mg concentration analysis
Blood samples were collected by the tail vein puncture; these samples were subsequently used to measure the serum Mg concentrations. Blood samples were incubated (16 hours, 4°C) and centrifuged (1200 g, 20 minutes, 4°C). The obtained supernatants were used to determine serum magnesium levels colorimetrically with a Wako Magnesium B Test Kit (Wako Pure Chemical Industries).
2.4. Quantitative real‐time PCR (qRT‐PCR)
MgD and Ctrl mice were sacrificed by cervical dislocation. Regions of whole hippocampus and whole cortex were rapidly dissected and snap‐frozen in liquid nitrogen. Total RNA was prepared using an RNeasy Mini Kit (QIAGEN) or acid guanidinium thiocyanate‐phenol‐chloroform extraction method. 18 Total RNA was reverse‐transcribed using Superscript Ⅲ reverse transcriptase (Invitrogen) and an oligo dT primer. qRT‐PCR was performed with the QuantStudio 3 Real‐Time PCR system (Thermo Fisher Scientific) using the Power SYBR Green PCR Master Mix (Thermo Fisher Scientific). qRT‐PCR was carried out at 50°C for 2 minutes 95°C for 10 minutes, and 40 cycles of 95°C for 15 seconds and 60°C for 1 minute. The expression of target genes was normalized to that of Hprt. The primers for qRT‐PCR are listed in Table S2.
2.5. RNA‐sequencing
Total RNA was isolated using an RNeasy Mini Kit (QIAGEN). After RNA quality check (all RIN values ≥ 8.0) with an RNA Nano Kit (Agilent Technologies) on an Agilent Bioanalyzer (Agilent Technologies), 1 μg total RNA was used to prepare cDNA libraries with a TruSeq RNA Sample Preparation Kit v2 (Illumina). The derived cDNA libraries were analyzed on an Agilent Bioanalyzer with a DNA 1000 Kit and quantified by qPCR using a KAPA Library Quantification Kit (KAPA Bio systems). cDNA libraries were pooled in lanes and clusters were generated on a cBot (Illumina) to obtain 100‐bp single reads in a HiSeq 2500 sequencer (Illumina). Demultiplexed fastq files were generated using bcl2fastq ver. 2.18 (Illumina). The raw sequence reads were filtered to exclude adapter sequences, ambiguous nucleotides, and low‐quality sequences, and the retained sequences were aligned against the mouse genome (mm10) using CLC Genomics Workbench software ver. 9.5 (Qiagen). Ingenuity Pathway Analysis (IPA, QIAGEN) was performed using 751 differentially expressed genes (P < 0.05). Pathway enrichment was examined through Fisher's exact test. Gene Set Enrichment Analysis (GSEA) was performed using GSEA ver. 2.0.3. 19 , 20 The C5 gene set collections (5917 gene ontology [GO] gene sets) were obtained from the Molecular Signature Database v6.0 (http://software.broadinstitute.org/gsea/msigdb/collections.jsp). The gene expression values were calculated as transcript per million (TPM). 21 Expressed genes were ranked according to their TPM values. Gene sets were considered to be highly enriched for a P‐value < 0.05 and false discovery rate (FDR)‐corrected q‐value <0.25. 22 RNA‐sequencing data have been deposited in the DDBJ Sequence Read Archive (accession number: DRA011148).
2.6. Statistical analysis
Two‐way repeated ANOVA was used to analyze an effect of body weight gain. Student's t test was used to analyze differences in the blood serum concentrations of Mg and mRNA expression levels. All values in the text and figures represent the mean ± standard error of the mean.
3. RESULTS AND DISCUSSION
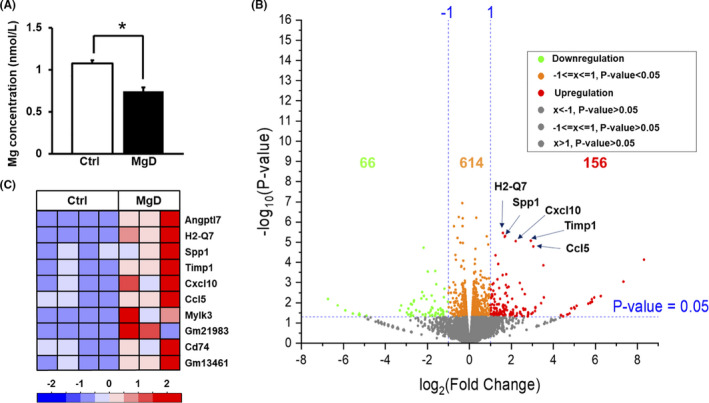
To examine the effects of dietary MgD on transcriptome profiles in the mouse brain, male C57BL/6N mice were fed an AIN‐93‐based MgD or Ctrl diet (Table S1). Importantly, MgD mice showed significantly lower blood serum Mg concentration than Ctrl mice (Figure 1A) without changing body weight gain (Figure S1), suggesting that the MgD diet lowers the Mg levels.
FIGURE 1.

Serum Mg concentrations and overall mRNA expression changes in the hippocampus of Mg2+ deficiency (MgD) mice versus control (Ctrl) mice. (A) Serum Mg concentrations are decreased by MgD (Ctrl, n = 3; MgD, n = 4). *P <.05. Error bars indicate standard error of the mean. (B) Volcano plot showing 156 upregulated (log2 fold change > 1, P < 0.05, red) and 66 downregulated (log2 fold change < −1, P < 0.05, green) genes in the hippocampus of MgD mice compared to Ctrl mice. (C) Expression heatmap of the top 10 significantly upregulated genes in the hippocampus of MgD mice compared to Ctrl mice. Relative expression levels normalized by transcripts per million.
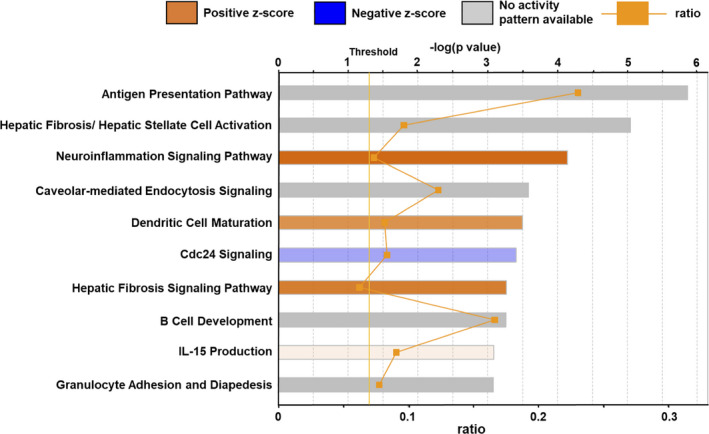
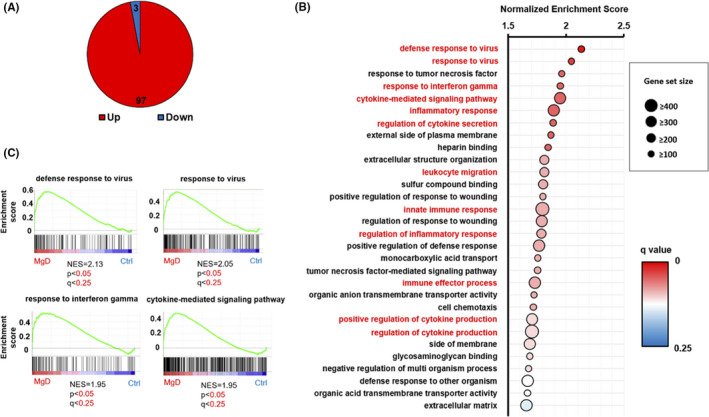
We analyzed the hippocampal transcriptome by performing RNA‐sequencing (Ctrl, n = 4; MgD, n = 3). We found that the expression of 156 and 56 genes was upregulated (P < 0.05, log2 > 1) or downregulated (P < 0.05, log2 < −1), respectively, in the hippocampus of MgD mice (Figure 1B). Interestingly, we observed inflammation‐related genes including Angptl7, H2‐Q7, Spp1, Timp1, Cxcl10, and Ccl5 in the top 10 significantly upregulated genes in the hippocampus of MgD mice (Figure 1C). To explore the potential biological pathways affected by the MgD diet, we performed GO analysis using Ingenuity Pathway Analysis on the 751 differentially regulated genes in MgD mice compared to Ctrl mice. Interestingly, in the top 10 pathways, “neuroinflammation signaling” (z‐score = 2.982, ratio = 0.0736), “dendritic cell maturation” (z‐score = 2.138, ratio = 0.082), and “hepatic fibrosis signaling pathway” (z‐score = 2.558, ratio = 0.0625) exhibited positive z‐scores and are involved in immune/inflammation signaling pathways (Figure 2, Table S3). To clarify further the biological pathways affected by MgD, we performed GSEA (gene set size ≥ 100). Using P < 0.05 and FDR < 0.25, GSEA revealed that the expression of 97 and 3 gene sets was significantly increased or decreased, respectively, in the hippocampus of MgD mice (Figure 3A). Figure 3B shows the top 30 significantly upregulated gene sets in the hippocampus of MgD mice. Twelve immune/inflammation‐associated gene sets were observed in the top 30 gene sets showing significant upregulation of mRNA expressions in MgD mice (Figure 3B,C). Collectively, these observations indicate that MgD upregulates the expression of genes related to immune/inflammation signaling pathways in the hippocampus, suggesting that MgD induces hippocampal neuroinflammation.
FIGURE 2.

Top 10 biological pathways of Ingenuity Pathway Analysis. The significance score (negative log of the P‐value calculated using Fisher's exact test) for each pathway is indicated by the bars. The orange points on each pathway bar represent the ratio of the number of genes in a given pathway that meet the cutoff criteria (P < 0.05) and the total number of genes that map to the pathway. An orange bar predicts an overall increase in the activity of the pathway. A blue bar predicts an overall decrease in the activity. A gray bar predicts no activity pattern.
FIGURE 3.

Gene Set Enrichment Analysis (GSEA) demonstrating the upregulation of immune/inflammation‐associated gene sets in the hippocampus of Mg2+ deficiency (MgD) mice. (A) GSEA revealed that the expression levels of 97 and 3 gene sets were significantly increased or decreased, respectively, in the hippocampus of MgD mice (n = 3) compared to control (Ctrl) mice (n = 4) (P < 0.05 and FDR < 0.25, gene set size ≥ 100). (B) Twelve immune/inflammation‐associated gene sets (in red) were observed in the top 30 gene sets showing upregulation of mRNA expressions in MgD mice. Normalized enrichment score (NES) for each gene set is indicated. (C) Representative enrichment plot showing significantly increased expression of inflammation‐associated gene sets in the hippocampus of MgD mice. Genes included in the enrichment score are shown in Table S4.
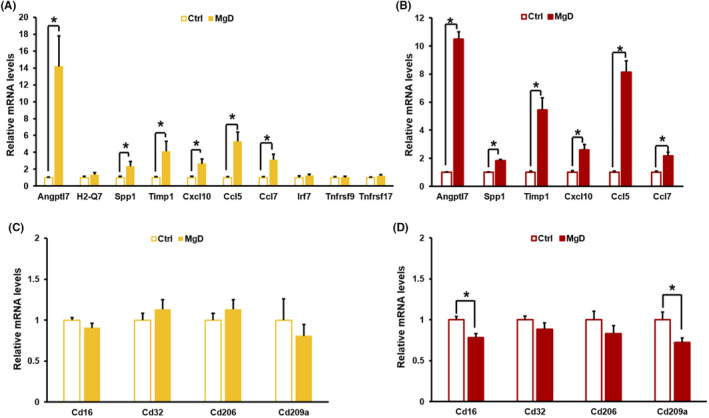
To validate the RNA‐sequencing data, we measured the mRNA levels of inflammation‐associated genes, which were included in the top 10 upregulated genes as above (Figure 1C) and/or are involved in gene sets whose upregulation was observed in GSEA (Table S4), in the hippocampus of MgD mice using qRT‐PCR. Angptl7, Spp1, Timp1, Cxcl10, Ccl5, and Ccl7 mRNA levels were significantly increased in the hippocampus of MgD mice compared to Ctrl mice (Figure 4A). These observations confirmed the results of RNA‐sequencing and suggested that MgD increases the expression of neuroinflammation‐associated genes in the hippocampus.
FIGURE 4.

Changes in the mRNA levels of neuroinflammation‐associated genes in the hippocampus and cortex of Mg2+ deficiency (MgD) mice. (A) Changes in mRNA levels in the hippocampus of MgD mice. Angptl7, H2‐Q7, Timp1, Cxcl10, Ccl5, and Ccl7 (control [Ctrl], n = 8; MgD, n = 6) and Spp1 (Ctrl, n = 11; MgD, n = 9). (B) Increases in mRNA levels in the cortex of MgD mice (Ctrl, n = 8; MgD, n = 7). (C) No changes in the mRNA levels of M1 (Cd16, Cd32) and M2 (Cd206, Cd209a) microglia markers in the hippocampus of MgD mice (Ctrl, n = 11; MgD, n = 9). (D) Changes in the mRNA levels of microglia markers in the cortex of MgD mice (Ctrl, n = 8; MgD, n = 7). *P < 0.05. Error bars indicate standard error of the mean.
We next examined the expression levels of neuroinflammation‐associated genes in the cortex of MgD mice. Angptl7, Spp1, Timp1, Cxcl10, Ccl5, and Ccl7 mRNA levels were significantly increased in the cortex of MgD mice compared to Ctrl mice (Figure 4B). Thus, dietary MgD increases the expression of neuroinflammation‐associated genes in the cortex as well as the hippocampus, suggesting that MgD induces neuroinflammation in the mouse brain.
The activation of M1 microglia is related to the induction of neuroinflammation. To examine whether microglia are activated by dietary MgD, we examined the mRNA levels of activation markers for M1 and M2 microglia, in the hippocampus and cortex. The mRNA levels of Cd16 (M1 marker) and Cd209a (M2 marker), but not Cd32 (M1) and Cd206 (M2), mRNAs were significantly decreased in the cortex, while no changes of mRNAs were observed in the hippocampus (Figure 4C,D), suggesting that the activity of M1 and M2 microglia is negatively regulated in the cortex, but not in the hippocampus, by dietary MgD (Figure 4D).
Collectively, we found that MgD upregulates the expression of neuroinflammation‐associated genes in the hippocampus and cortex, suggesting that MgD induces neuroinflammation in the mouse brain. Previous studies have shown that neuroinflammation in the brain impairs learning and memory. 23 , 24 Therefore, our findings raise the possibility that MgD‐induced neuroinflammation impairs hippocampus‐dependent memories such as contextual fear, spatial, and social recognition memories. Additionally, future studies are required to examine effects of MgD on cortex‐dependent memories since upregulation of neuroinflammation‐associated genes was observed in the cortex.
Similar to MgD, high‐fat diet (HFD) feeding induces neuroinflammation and impairs hippocampus‐dependent spatial memory. 25 , 26 , 27 . Importantly, a recent study showed that HFD feeding increases microglial activation and dendritic spine loss in the hippocampus. 26 In contrast, no obvious activation of microglia (Figure 4C,D) or spine loss 13 was observed in the hippocampus of MgD mice. Therefore, it is possible that dietary MgD induces weaker neuroinflammation compared to an HFD, although this level of neuroinflammation is sufficient for dysfunction of hippocampus‐dependent memory performance. Further studies are required to investigate the relationship between the upregulation of neuroinflammation‐associated genes and impaired hippocampus‐dependent memory in MgD mice. Importantly, downregulation of makers of M1 (proinflammatory) and M2 (anti‐inflammatory) microglia was observed in the cortex, raising the possibility that altered activities of M1 and M2 microglia have influences on the progression of neuroinflammation and memory function. It is important to further investigate effects of MgD on activities of M1 and M2 microglia in the cortex and cortex‐dependent memory to understand mechanisms of MgD‐induced neuroinflammation and memory impairments.
CONFLICT OF INTEREST
None.
AUTHORS CONTRIBUTION
SK is responsible for the hypothesis development and overall design of the research and experiment and supervised the experimental analyses. RT and SK cowrote the paper. RT performed MgD treatments, RNA‐sequencing, and qRT‐PCR. HI and MU contributed to the overall design of the experiment and prepared the control and MgD diets. All authors read and approved this paper.
ANIMAL STUDIES
All animal experiments were approved by the Animal Care and Use Committee of Tokyo University of Agriculture.
Supporting information
Fig S1
Table S1‐S4
ACKNOWLEDGEMENTS
SK was supported by Grant‐in‐Aids for Scientific Research (A) (15H02488, 18H03944, 19H01047), Scientific Research (B) (23300120 and 20380078), and Challenging Exploratory Research (24650172, 26640014, 17K19464, 20K21265); Grant‐in‐Aids for Scientific Research on Priority Areas—Molecular Brain Science (18022038 and 22022039); Grant‐in‐Aid for Scientific Research on Innovative Areas (Research in a proposed research area) (24116008, 24116001, 23115716, 17H06084, 17H05961, 17H05581, 18H05428, 18H05434, 19H04917); MEXT‐Supported Program for the Strategic Research Foundation at Private Universities (S1311017); Core Research for Evolutional Science and Technology (CREST), Japan; The Sumitomo Foundation, Japan; the Takeda Science Foundation, Japan; The Naito Foundation, The Uehara Memorial Foundation, Daiichi Sankyo Foundation of Life Science, The Food Science Institute Foundation (Ryoushoku‐kenkyukai), Danone Research Grant from Danone Institute of Japan Foundation, and The Science Research Promotion Fund; and The Promotion and Mutual Aid Corporation for Private Schools of Japan.
Tsuji R, Inoue H, Uehara M, Kida S. Dietary magnesium deficiency induces the expression of neuroinflammation‐related genes in mouse brain. Neuropsychopharmacol Rep. 2021;41:230–236. 10.1002/npr2.12167
DATA AVAILABILITY STATEMENT
All relevant data are included in Supporting Information.
REFERENCES
- 1. Garfinkel L, Garfinkel D. Magnesium regulation of glycolytic pathway and the enzymes involved. Magnesium. 1985;4:60–72. [PubMed] [Google Scholar]
- 2. Bara M, Guiet‐Bara A. Potassium, magnesium and membranes. Magnesium. 1984;3:212–25. [PubMed] [Google Scholar]
- 3. Rubin H. Magnesium deprivation reproduces the co‐ordinate effects of serum removal or cortisol addition on transport and metabolism in chick embryo fibroblasts. J Cell Physiol. 1976;89:613–26. [DOI] [PubMed] [Google Scholar]
- 4. Ford ES, Li C, McGuire LC, Mokdad AH, Liu S. Intake of dietary magnesium and the prevalence of the metabolic syndrome among U.S. adults. Obesity. 2007;15:1139–46. [DOI] [PubMed] [Google Scholar]
- 5. Larsson SC, Wolk A. Magnesium intake and risk of type 2 diabetes: a metaanalysis. J Intern Med. 2007;262:208–14. [DOI] [PubMed] [Google Scholar]
- 6. Jee SH, Miller ERIII, Guallar E, Singh VK, Appel LJ, Klag MJ. The effect of magnesium supplementation on blood pressure: a meta‐analysis of randomized clinical trials. Am J Hypertens. 2002;15:691–6. [DOI] [PubMed] [Google Scholar]
- 7. Mayer ML, Westbrook GL, Guthrie PB. Voltage‐dependent block by Mg2⁺ of NMDA responses in spinal cord neurones. Nature. 1984;309:261–3. [DOI] [PubMed] [Google Scholar]
- 8. Nowak L, Bregestovski P, Ascher P, Herbet A, Prochiantz A. Magnesium gates glutamate‐activated channels in mouse central neurons. Nature. 1984;307:462–5. [DOI] [PubMed] [Google Scholar]
- 9. Dingledine R, Borges K, Bowie D, Traynelis SF. The glutamate receptor ion channels. Pharmacol Rev. 1999;51:7–61. [PubMed] [Google Scholar]
- 10. Slutsky I, Abumaria N, Wu LJ, Huang C, Zhang L, Li B, et al. Enhancement of learning and memory by elevating brain magnesium. Neuron. 2010;65:165–77. [DOI] [PubMed] [Google Scholar]
- 11. Bardgett ME, Schultheis PJ, McGill DL, Richmond RE, Wagge JR. Magnesium deficiency impairs fear conditioning in mice. Brain Res. 2005;1038:100–6. [DOI] [PubMed] [Google Scholar]
- 12. Bardgett ME, Schultheis PJ, Muzny A, Riddle MD, Wagge JR. Magnesium deficiency reduces fear‐induced conditional lick suppression in mice. Magnes Res. 2007;20:58–65. [PubMed] [Google Scholar]
- 13. Serita T, Miyahara M, Tanimizu T, Takahashi S, Oishi S, Nagayoshi T, et al. Dietary magnesium deficiency impairs hippocampus‐dependent memories without changes in the spine density and morphology of hippocampal neurons in mice. Brain Res Bull. 2019;144:149–57. [DOI] [PubMed] [Google Scholar]
- 14. Matsuzaki H, Masuyama R, Uehara M, Nakamura K, Suzuki K. Effects of simultaneous increases in dietary phosphorus and magnesium concentrations on nephrocalcinosis and kidney function in female rats. Magnes Res. 2004;17:14–9. [PubMed] [Google Scholar]
- 15. Nakaya Y, Suzuki M, Uehara M, Katsumata S, Suzuki K, Sakai K, et al. Absence of negative feedback on intestinal magnesium absorption on excessive magnesium administration in rats. J Nutr Sci Vitaminol (Tokyo). 2009;55:332–7. [DOI] [PubMed] [Google Scholar]
- 16. Akiyama S, Uehara M, Katsumata S, Ihara H, Hashizume N, Suzuki K. Effects of dietary ascorbic acid supplementation on lipid peroxidation and the lipid content in the liver and serum of magnesium‐deficient rats. Magnes Res. 2008;21:232–6. [PubMed] [Google Scholar]
- 17. Nakaya Y, Uehara M, Katsumata S, Suzuki K, Sakai K, Ohnishi R, et al. The frequency of magnesium consumption directly influences its serum concentration and the amount of elutable bone magnesium in rats. Magnes Res. 2010;23:48–56. [DOI] [PubMed] [Google Scholar]
- 18. Kida S, Josselyn SA, Peña de Ortiz S, Kogan JH, Chevere I, Masushige S, et al. CREB required for the stability of new and reactivated fear memories. Nat Neurosci. 2002;4:348–55. [DOI] [PubMed] [Google Scholar]
- 19. Mootha VK, Lindgren CM, Eriksson KF, Subramanian A, Sihag S, Lehar J, et al. PGC‐1alpha‐responsive genes involved in oxidative phosphorylation are coordinately downregulated in human diabetes. Nat Genet. 2003;34:267–73. [DOI] [PubMed] [Google Scholar]
- 20. Subramanian A, Tamayo P, Mootha VK, Mukherjee S, Ebert BL, Gillette MA, et al. Gene set enrichment analysis: a knowledge‐based approach for interpreting genome‐wide expression profiles. Proc Natl Acad Sci USA. 2005;102:15545–50. [DOI] [PMC free article] [PubMed] [Google Scholar]
- 21. Wagner GP, Kin K, Lynch VJ. Measurement of mRNA abundance using RNA‐seq data: RPKM measure is inconsistent among samples. Theory Biosci. 2012;131(4):281–5. [DOI] [PubMed] [Google Scholar]
- 22. Benjamini Y, Hochberg Y. Controlling the False Discovery Rate – a practical and powerful approach to multiple testing. J R Stat Soc Ser B Stat Methodol. 1995;57:289–300. [Google Scholar]
- 23. Barrientos RM, Kitt MM, Watkins LR, Maier SF. Neuroinflammation in the normal aging hippocampus. Neuroscience. 2015;309:84–99. [DOI] [PMC free article] [PubMed] [Google Scholar]
- 24. Pasqualetti G, Brooks DJ, Edison P. The role of neuroinflammation in dementias. Curr Neurol Neurosci Rep. 2015;15:17. [DOI] [PubMed] [Google Scholar]
- 25. Boitard C, Cavaroc A, Sauvant J, Aubert A, Castanon N, Layé S, et al. Impairment of hippocampal‐dependent memory induced by juvenile high‐fat diet intake is associated with enhanced hippocampal inflammation in rats. Brain Behav Immun. 2014;40:9–17. [DOI] [PubMed] [Google Scholar]
- 26. Cope EC, Elizabeth A, LaMarca EA, Monari PK, Olson LB, Martinez S, et al. Microglia play an active role in obesity‐associated cognitive decline. J Neurosci. 2018;38(41):8889–904. [DOI] [PMC free article] [PubMed] [Google Scholar]
- 27. Underwood EL, Thompson LT. A High‐fat diet causes impairment in hippocampal memory and sex‐dependent alterations in peripheral metabolism. Neural Plasticity. 2016;2016:7385314. 10.1155/2016/7385314 [DOI] [PMC free article] [PubMed] [Google Scholar]
Associated Data
This section collects any data citations, data availability statements, or supplementary materials included in this article.
Supplementary Materials
Fig S1
Table S1‐S4
Data Availability Statement
All relevant data are included in Supporting Information.


