

Abstract
Teff, maize, and wheat are the major cereals grown in volcanic ash-rich soils of the Main Ethiopian Rift (MER) Valley. Teff is a gluten-free cereal native to Ethiopia, used for making a local flat bread called injera, and is getting popularity globally due to its nutritional value (gluten-free and high fiber content). Teff can thus be an alternative diet for the treatment of celiac disease, a lifelong intolerance to gluten. This study aims to assess the distribution of toxic and essential elements in these staple cereals using Inductively Coupled Plasma Mass Spectrometry (ICP-MS) and compare with mineral composition of wheat, and maize consumed in the Main Ethiopian Rift Valley. We found significantly higher mean concentrations (in mg/kg) of Mg (1400), Ca (1210), Na (33), Fe (159), Mn (71), Sr (5.6), and Cu (4.8) in teff compared to wheat and maize. Maize had the lowest concentrations of these essential elements. Mean concentrations (in μg/kg) of As (24.7) and Pb (70) in teff were relatively higher compared to wheat and maize, which had similar values of As (4.5) and Pb (8.9). Teff and wheat had similar Cd concentrations (in μg/kg) of 4.8 and 5.4 respectively compared to maize (1.5). Cadmium concentrations were below the Codex standard established for Cd in cereal grains (100 μg/kg). Only one teff sample exceeded the Codex standard set for Pb (200 μg/kg) in cereal grains. This study provides information on nutritional values and food safety of maize, wheat, and teff; the latter is becoming an alternative gluten-free diet for celiac patients in countries where wheat is commonly a staple food.
Keywords: Teff, maize, and wheat; Elemental composition; ICP-MS analysis; Main Ethiopian rift valley
1. Introduction
Cereals constitute a major part of the human diet worldwide (Chen et al., 2012). Maize (Zea mays), wheat (Triticum aestivum), and teff (Eragrostis tef) are the staple cereals grown in volcanic-ash rich soils of the Main Ethiopian Rift (MER) Valley. Teff is an indigenous cereal consumed daily by a majority of the population in Ethiopia and is known to be gluten-free and more nutritious over maize and wheat (Kibatu et al., 2017; Dame, 2018). A lifelong gluten-free diet is the only known remedy for celiac disease, a permanent intolerance to gluten (Hopman et al., 2008). Gluten-free products are limited and may lead to insufficient nutrition (Hopman et al., 2008). In addition, some celiac patients develop clinical symptoms and mucosal damage after consumption of some gluten-free foods (Lundin et al., 2003). Teff could be an alternative cereal for these patients. Other nutritional benefits of teff include high fiber content, potassium (K), Magnesium (Mg), calcium (Ca), sodium (Na), iron (Fe), copper (Cu), zinc (Zn), chromium (Cr), and manganese (Mn) compared to other cereals (Kibatu et al., 2017; Sharma and Chauhan, 2018). However, other studies have indicated that teff contains low amounts of selenium (Se) and sodium (Na) compared to other cereals (Kibatu et al., 2017). Supplementing the daily diet with other cereals like maize and wheat provides the nutrients, which could otherwise be limited in teff. Maize and wheat have been found to contain significant amounts K, Mg, Ca, and Na (Hussain et al., 2010; Nuss and Tanumihardjo, 2010; Ullah et al., 2010). Maize from Ethiopia has been reported to contain macronutrients in the order of K > Mg > Na > Ca (Abebe and Chandravanshi, 2017). Maize is a gluten-free cereal, however it is less nutritious compared to wheat, which contains gluten as a storage protein (Hopman et al., 2008).
Mineral composition of these cereal grains vary depending on soil type, soil fertility, soil moisture, crop genotype among other factors (Chaudhary et al., 2014). They provide essential elements such as Mg, K, Ca, Na, Cu, Fe, and Zn required for the physiological functions of the body and their deficiencies results in nutritional problems (Goldhaber, 2003). For instance, nearly 40 % and 60 % of the global population suffers from Zn malnutrition and Fe deficient, respectively (Radlowski and Johnson, 2013). In Ethiopia, Fe and Zn deficiency are particularly prevalent (Umeta et al., 2005). Despite the daily consumption of cereals in most parts of the world, deficiencies in Fe and Zn have been attributed to high phytic acid and tannins that affect bioavailability of these elements (Umeta et al., 2005). Although consuming foods rich in nutrients is essential for normal physiology, high concentrations of these essential elements can be toxic (Goldhaber, 2003). For example, progressive accumulation of Cu and excessive intake of Fe have been associated with damage of some body organs (e.g. the liver and kidney). Foods including cereals are often contaminated with toxic elements (such as Cadmium (Cd) and lead (Pb)) from the environment including agricultural fields and food handling processes (Sulyman et al., 2015). Food consumption is an important route of metal exposure that can lead to metal toxicity to humans from soils (Teklíc et al., 2013; Jaishankar et al., 2014).
Vast pyroclastic materials derived from geologic rifting and volcanic activities characterize the MER. Such geologic materials are weathered into clay loam to clayey textured volcanic soils, which are rich in macro and micronutrients due to the high amount of volcanic ash content (Le Turdu et al., 1999; Peccerillo et al., 2007; Yitbarek et al., 2016). Large scale soil nutrient information in Ethiopia is scarce, however available data indicate that soil is spatially heterogeneous (Laekemariam and Kibret, 2020). Furthermore, the national soil macronutrient status is outdated and points out that the Ethiopian soils are K depleted (Alemayehu et al., 2016). Hailu et al. (2015) suggests that soils of central Ethiopia are high in exchangeable Ca, Mg, and K. Potassium deficiency in soils has been associated with K to Mg and/or Ca ratios (Hailu et al., 2015; Laekemariam et al., 2018). Soils of Amhara region, northwestern Ethiopia have been reported to contain essential elements in the following order Fe > Mn > Zn > Co > Ni > Cu (Addis and Abebaw, 2017). Soils in Alage and Ziway regions of central Ethiopia are sodic and saline respectively, containing high levels of Na, Cu, Zn, and Ca (Alemayehu et al., 2016). Zinc concentration in Ethiopian soils is contradicting among studies, but most studies have reported low levels (Haileselassie et al., 2011). These nutrients improve soil fertility and thus crop productivity. Addis and Abebaw (2017) reported that soils in Amhara region contains very low levels of toxic elements (Cd and Pb) and are suitable for crop production. However, agriculture and industrial activities may increase levels of toxic elements in soils (Moor et al., 2001). These elements may be introduced into the food chains through the crops grown in the region
Some vegetables and teff grown in volcanic soils of Ethiopia have shown high levels of Pb beyond the recommended limits set by FAO/WHO (FAO/WHO, 2001; Kibatu et al., 2017). Few recent studies have focused on nutritive aspect of teff as a gluten free cereal whose popularity is gradually increasing beyond Ethiopia.(Abebe et al., 2007; Kibatu et al., 2017; Dame, 2018; Koubová et al., 2018). In this study, we assessed the distribution of toxic and essential elements in teff, maize, and wheat. The findings from this study will contribute to the nutritional database of these staple cereals and in particular increase awareness on the potential health benefits of teff.
2. Methods
2.1. Study area
The study area is located in the MER valley, which is part of the Great East African Rift system (Fig. 1). The MER is characterized by closed basins and Pliocene-Quaternary range systems surrounded by Ethiopian plateau to the west and Somalian plateau to the east (Benvenuti et al., 2002). The rift is aligned in the north-northeast (NNE) to south-southwest (SSW) direction, which is formed by steep normal faults, and resulted in an offset of about 1500–2000 m above the sea level (m.a.s.l) between the rift floor and plateau (Benvenuti et al., 2002). The closed basins consist of northeast-southwest trending lake at an average altitude of 1600 m.a.s.l (Le Turdu et al., 1999). The surface geology is comprised of volcanic deposits and lacustrine sediments deposits. In addition, peralkaline rhyolites and minor trachytes (silicic volcanic rocks) deposited in the form of pyroclastic flows or fall deposits occupy the rift floor and rift axis volcanoes (Peccerillo et al., 2007). The local Oligocene-Pliocene aged rocks have resulted in fertile volcanic soils, and together with adequate mean annual rainfall permits to produce cereal crops within the MER (Fritzsche et al., 2007). Based on the amount of rainfall there are two agricultural seasons in Ethiopia: the Belg (March/April to May/June) and Meher (July/August to September/-October). Belg is the dry/low rainfall season while Meher is the high rainfall season. Harvesting of these three cereals occurs between August and February (United States Department of Agriculture (USDA, 2008; Knowling, 2015).
Fig. 1.
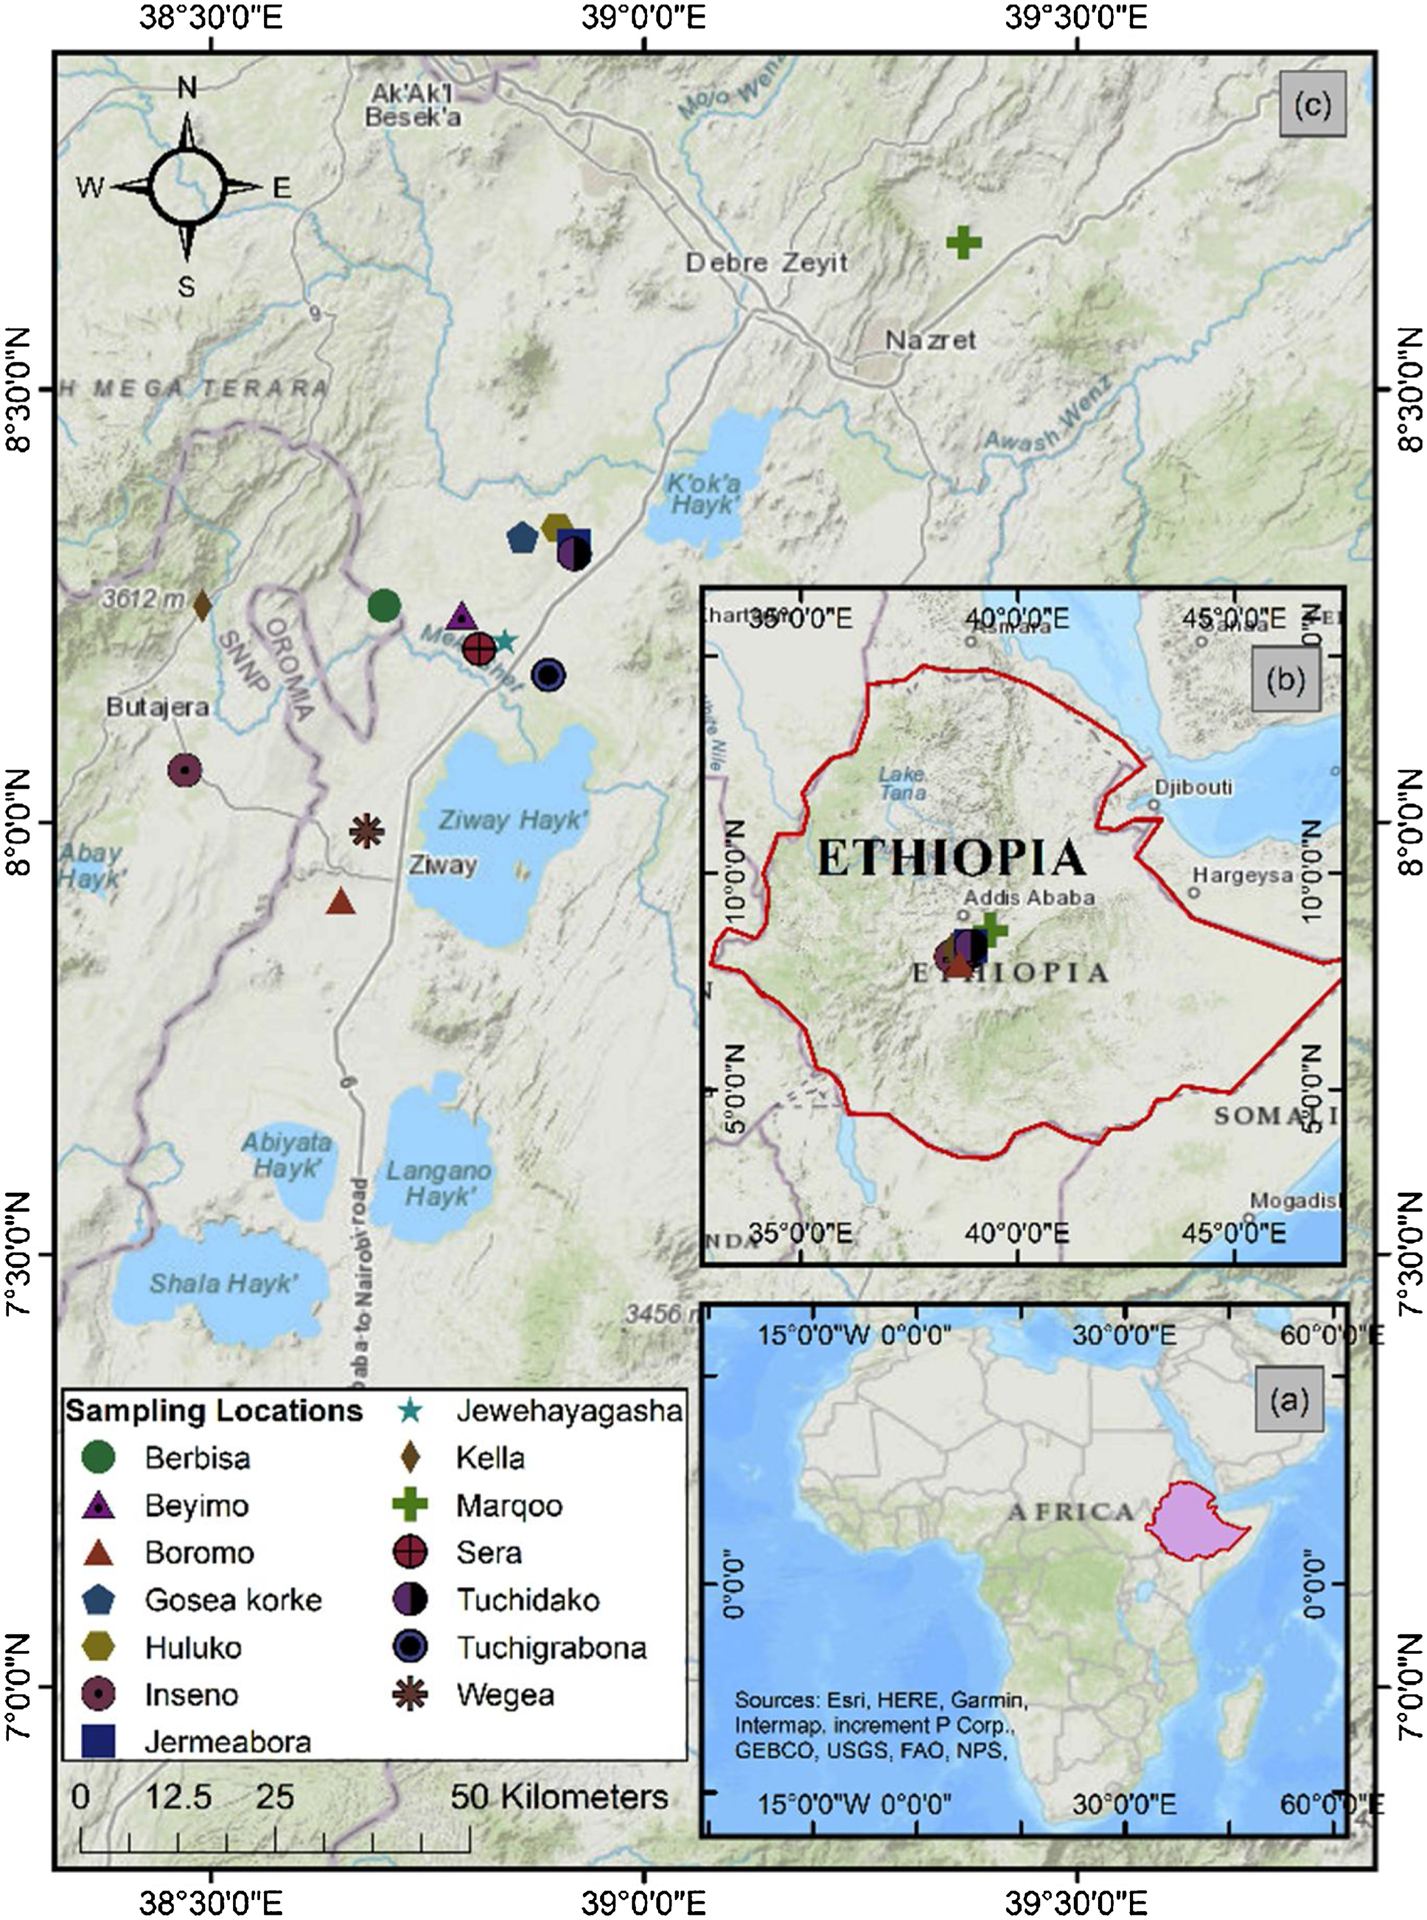
Sampling locations within the Main Ethiopian Rift Valley.
2.2. Collection of cereal samples
A total of 42 samples, consisting of 14 samples per cereal (teff, maize, and wheat) were collected from different households in 14 community sites of the MER. Each household provided the available cereals cultivated in their respective farms, which could either be teff, maize, and wheat or all the cereals. Two teff types (10 white and 4 red) samples were collected. The samples were kept in plastic bags until further analysis. Prior to the lab procedure, the raw cereal samples were rinsed with ultra-pure distilled water three times in a test tube to remove any external contamination such as soil. The cereals contain an outer protective layer (bran), which would limit loss of nutrients from the grains upon rinsing. The grains were allowed to dry in the oven at 80 °C for 3 h and then powdered using pestle and mortar.
2.3. Analysis of cereal sample
A modified wet sample digestion method of Akinyele and Shokunbi (2015) was adopted. Approximately 0.1–0.16 g of each sample was weighed in acid-washed Teflon® digestion vessels, and 3 ml of 67–69 % Optima™ nitric acid (Fisher Scientific) and 0.5 ml of 32–35 % Optima™ hydrochloric acid Fisher Scientific were added in the vessels. The mixtures were left at room temperature for 3 h then placed on a hotplate overnight at 75 °C. Following degassing, 0.5 ml of ultra pure H2O2 (VWR International Co.) was added to each and heat at 100 °C overnight. The samples were allowed to cool for approximately 2 h and degassed. Then, 0.5 ml ultra-pure distilled water was added to each sample and the samples were placed on the hot plate overnight at 100 °C. The samples were digested completely until a clear solution appeared; these fully digested sample solutions were used for elemental analyses. Concentrations of toxic and essential elements were measured using the Inductively Coupled Plasma Mass Spectrometry (7900 ICP-MS Agilent Technologies, Santa Clara, CA). Environmental calibration standards (ECS) were purchased from Agilent Technologies, Inc. The standards included 1000 mg/L (Ca, Fe, K, Mg, and Na) and 10 mg/L (Ag, As, Be, Ba, Cd, Co, Cr, Cu, Mn, Mo, Ni, Pb, Sb, Se, Th, Tl, U, V, and Zn) solutions. Additionally, individual 1000 mg/L stock solutions of Li and Sr were also purchased from Agilent Technologies, Inc. Intermediate solutions were prepared from the standard solutions with solution containing 1 % HNO3 and 0.5 % HCl. Working standards were prepared with final calibration standard concentrations of 1, 10, 50, and 100 μg/L for Ag, As, Be, Ba, Cd, Co, Cr, Cu, Mn, Mo, Ni, Pb, Sb, Se, Th, Tl, U, V, Zn, and Sr. Final calibration standard concentrations for Na, Mg, Fe, Ca, and K were 100, 1000, 5000, and 10,000 μg/L. Final calibration standards for Hg were 0.1, 1, 5, and 10 ppb and for B were 10, 100, 500 and 1000 μg/L. To improve precision of our analyses, internal standard solutions of Bi, Ge, ln, Li, Lu, Rh, Sc, and Tb purchased from Agilent Technologies were added to the samples, calibration standards, and blanks.
2.4. Quality control
Samples were carefully handled using sterile powder-free plastic gloves during the analytical procedures to avoid contamination. All samples were digested in acid-washed Teflon® vessels. The accuracy of the analytical procedures was verified based on the analysis of rice (1568b), spinach leaves (1570a), and water (1643f) Standard Reference Materials (SRMs) purchased from the National Institute of Standards and Technology (NIST) (Gaithersburg, MD, USA). The rice and spinach leaves SRMs were analyzed simultaneously with the samples using similar digestion and analytical methods. The mean recoveries of As, Cd, and Pb for the NIST 1568b were 96 %, 78 %, and 97 % respectively; recoveries for other metals were between 84–110 % (Table 1). Concentrations of B, Ni, and Sr recoveries were calculated based on the certified values of the spinach leaves showed recoveries of 82 %, 87 %, and 94 %, respectively. Since the recoveries of Tl, Ba, Sb, Cr, Ag, V, and Be are absent in the analyzed SRMs, certified values of water standard reference material (NIST 1643f) were used and showed values of 90 %, 102 %, 95 %, 101 %, 104 %, 97 %, and 85 %, respectively.
Table 1.
Mean concentrations of measured and certified reference element in NIST 1568b.
| Element | Measured Value, Rice (1568b) μg/kg) | Certified values μg/kg) | % Recovery |
|---|---|---|---|
| Pb | 8 | 8 | 97 |
| Cd | 18 | 22 | 78 |
| As | 272 | 285 | 95 |
| Ca | 102614 | 118400 | 87 |
| Mg | 478634 | 559000 | 86 |
| K | 1157252 | 1282000 | 90 |
| Na | 7393 | 6740 | 110 |
| Mn | 17814 | 19200 | 93 |
| Fe | 6809 | 7420 | 92 |
| Co | 17 | 18 | 94 |
| Cu | 2123 | 2350 | 90 |
| Zn | 16296 | 19420 | 84 |
| Se | 324 | 365 | 89 |
| Mo | 1371 | 1451 | 94 |
Recovery (%) = (Mean measured value/Mean Certified value)*100.
2.5. Statistical analysis
Descriptive analyses including mean, standard deviations and quartiles of quantitative variables were carried out on GraphPad Prism version 8.2.1. Also using this software, analysis of variance was carried out to compare mean concentrations of elements in the cereal grains. Wilcoxon test was also used to compare mean concentrations of the elements in red and white teff grain varieties.
3. Results
Toxic and essential element concentrations of teff, maize, and wheat are reported in Table 2 on a dry mass basis. A comparison of the elemental concentrations between white and red teff are presented in Table 3.
Table 2.
Toxic and essential elements concentrations (Mean ± SD) in teff, wheat, and maize locally grown in the Main Ethiopian Rift Valley.
| Teff | Wheat | Maize | |||||||||||||
|---|---|---|---|---|---|---|---|---|---|---|---|---|---|---|---|
| Toxic elements | Percentiles | Percentiles | Percentiles | ||||||||||||
| Pb | 10.8 – 362 | 69.9 ± 92 | 16.4 | 41.3 | 87.5 | 4.43 – 18.8 | 8.9 ± 3.8a | 6.58 | 7.7 | 10 | 4.4 – 28.9 | 8.9 ± 6.1a | 5.4 | 7.72 | 9.4 |
| Cd | 0.85 – 11.3 | 4.8 ± 3.4b | 2.16 | 3.22 | 7.18 | 3.33 – 8.34 | 5.4 ± 1.4b | 4.19 | 4.8 | 6.66 | 0.7 – 3.1 | 1.5 ± 0.8 | 0.75 | 1.16 | 2.02 |
| As | 4.4–128 | 24.7 ± 32 | 5.85 | 15.9 | 29.6 | 2.7 – 7.1 | 4.5 ± 1.5c | 3.25 | 4.1 | 6.02 | 2.4 – 6.3 | 4.4 ± 1.2c | 3.58 | 4.1 | 5.4 |
| Be | 1.21–45.3 | 9.99 ± 12 | 1.84 | 5.18 | 14.3 | 0.159 – 1.96 | 0.54 ± 0.5 | 0.34 | 0.43 | 0.59 | 0.091 – 0.4 | 0.19 ± 0.1 | 0.11 | 0.18 | 0.27 |
| Ag | 1.86 – 9.8 | 4.8 ± 2.2 | 3.2 | 4.67 | 6.27 | 0.63 – 2.8 | 1.5 ± 0.62d | 1.11 | 1.49 | 1.91 | 0.3 – 1.4 | 0.6 ± 0.28d | 0.56 | 0.74 | 0.92 |
| Sb | 0.33 – 6.27 | 1.96 ± 1.9e,f | 0.58 | 1.39 | 2.4 | 0.07 – 12.4 | 1.5 ± 3.2e,g | 0.22 | 0.39 | 0.92 | 0.3 – 2.9 | 0.9 ± 0.7f,g | 0.52 | 0.73 | 0.9 |
| Tl | 0.298 – 4.8 | 1.1 ± 1.20h | 0.36 | 0.56 | 1.61 | 0.07 – 0.34 | 0.2 ± 0.07* | 0.14 | 0.2 | 0.25 | 0.2 – 2.8 | 0.7 ± 0.7h,i | 0.3 | 0.43 | 0.78 |
| Th | 3.9 – 125 | 39.2 ± 41 | 6.76 | 22.3 | 67.8 | 0.96 – 7.03 | 2.2 ± 1.53 | 1.19 | 1.91 | 2.33 | 0.3 – 2.8 | 0.9 ± 0.63 | 0.51 | 0.8 | 1.15 |
| U | 0.3 – 18.2 | 4.5 ± 6.2 | 0.67 | 1.6 | 5.68 | 0.16 – 0.73 | 0.31 ± 0.18 | 0.2 | 0.23 | 0.34 | 0.05 – 0.3 | 0.14 ± 0.08 | 0.09 | 0.12 | 0.17 |
| in mg/Kg, dry weight | |||||||||||||||
| Ba | 5.8 – 12.3 | 9.6 ± 1.7 | 8.9 | 9.7 | 10.4 | 1.2 – 6.7 | 4.2 ± 1.5 | 3.2 | 4 | 5.1 | 0.03 – 0.15 | 0.073 ± 0.04 | 0.04 | 0.07 | 0.1 |
| Ni | 0.12 – 1.5 | 0.87 ± 0.31 | 0.75 | 0.94 | 1.01 | 0.2 – 0.7 | 0.38 ± 0.12 | 0.28 | 0.37 | 0.43 | 0.05 – 0.52 | 0.21 ± 0.12 | 0.13 | 0.17 | 0.28 |
| V | 0.030 – 1.3 | 0.22 ± 0.35 | 0.04 | 0.07 | 0.2 | 0.02 – 0.05 | 0.031 ± 0.007j | 0.027 | 0.029 | 0.03 | 0.009 – 0.035 | 0.02 ± 0.007j | 0.01 | 0.02 | 0.03 |
| Essential Elements | |||||||||||||||
| in mg/Kg, dry weight | Min - Max | Mean ± SD | 25th | 50th | 75th | Min - Max | Mean ± SD | 25th | 50th | 75th | Min- Max | Mean ± SD | 25th | 50th | 75th |
| K | 2900 – 4280 | 3670 ±320 | 3580 | 3690 | 3860 | 3800 – 5480 | 4390 ± 420 | 4090 | 4410 | 4500 | 1840 – 3990 | 3140 ± 530 | 2926 | 3167 | 3570 |
| Mg | 1200 – 1650 | 1397 ±120 | 1270 | 1410 | 1480 | 994 – 1430 | 1157 ±110 | 1090 | 1160 | 1190 | 630–1160 | 929 ±140 | 826 | 963 | 1007 |
| Ca | 1000 – 1400 | 1210 ±140 | 1080 | 1220 | 1350 | 240 – 440 | 344 ± 60 | 305 | 329 | 392 | 20 – 60 | 35 ± 12 | 25 | 35 | 44 |
| Na | 12.3 – 121 | 33 ± 27 | 20 | 26 | 32 | 8.3 – 29 | 14 ± 5 | 10.6 | 12 | 15.3 | 0.2 – 3.5 | 1.5 ± 1.0 | 0.9 | 1.3 | 2.1 |
| Fe | 34 – 624 | 159 ± 170 | 40 | 88 | 252 | 26 – 58 | 33 ± 8 | 28 | 31 | 36 | 7.6 – 19 | 13.0 ± 3.1 | 11 | 12.9 | 15.5 |
| Mn | 35 – 132 | 71 ± 26 | 50 | 67 | 89 | 34 – 51 | 43 ± 4 | 40 | 42 | 46 | 2.4 – 6.0 | 4.1 ± 1.1 | 3.2 | 4.2 | 4.8 |
| Cu | 2.9–5.9 | 4.8 ± 0.7 | 4.6 | 4.8 | 5.3 | 2.5 – 4.5 | 3.7 ± 0.6 | 3.3 | 3.6 | 4.4 | 0.8 – 2.3 | 1.3 ± 0.5 | 0.9 | 1.2 | 1.6 |
| Zn | 17 – 28 | 24 ± 2.9 | 22 | 24 | 26 | 24 – 39 | 31 ± 4 | 28 | 31 | 36 | 11.5–26 | 18.1 ± 3.5 | 15.4 | 18 | 20 |
| Mo | 0.65 – 2.96 | 1.55 ± 0.67k | 1.06 | 1.37 | 1.84 | 0.67 – 2.84 | 1.43 ± 0.59k | 1.01 | 1.23 | 1.67 | 0.3 – 1.2 | 0.8 ± 0.3 | 0.44 | 0.79 | 1.07 |
| Cr | 0.02 – 0.32 | 0.09 ± 0.08 | 0.03 | 0.06 | 0.11 | 0.01 – 0.05 | 0.02 ± 0.011 | 0.02 | 0.02 | 0.02 | 0.01 – 0.04 | 0.02 ± 0.011 | 0.01 | 0.02 | 0.03 |
| Se | 0.09 – 0.49 | 0.29 ± 0.12m | 0.16 | 0.31 | 0.41 | 0.10 – 0.81 | 0.4 ± 0.2m | 0.24 | 0.31 | 0.49 | 0.03 −0.33 | 0.14 ± 0.10 | 0.06 | 0.11 | 0.24 |
| Sr | 3.6 – 10.8 | 5.6 ± 1.8 | 4.6 | 4.9 | 6.6 | 1.43 – 4.21 | 2.51 ± 0.66 | 2.11 | 2.49 | 2.74 | 0.06 – 0.21 | 0.13 ± 0.05 | 0.08 | 0.12 | 0.17 |
| Co | 0.014 – 0.59 | 0.09 ± 0.15 | 0.03 | 0.05 | 0.07 | 0.007 – 0.02 | 0.01 ± 0.003 | 0.009 | 0.01 | 0.013 | 0.002 – 0.007 | 0.004 ± 0.001 | 0.003 | 0.004 | 0.005 |
Similar letters indicate that the means are not statistically significant (p > 0.05). For example mean concentrations of antimony were not statistically significant between teff and wheat, teff and maize as well as wheat and maize. Means with no letters were statistically significant at p < 0.05.
Table 3.
Range and mean concentrations of toxic and essential elements in white and red teff types grown in the Main Ethiopian Rift Valley.
| Toxic elements | White teff | Red Teff | ||
|---|---|---|---|---|
| in μg/Kg, dry weight | Min - Max | Mean ± SD | Min - Max | Mean ± SD |
| Pb | 10.8 – 361 | 73.7 ± 110 | 45 −80 | 60 ± 16 |
| Cd | 0.9 – 11.3 | 3.9 ± 3.5 | 5.5 – 10.4 | 7.0 ± 2.3 |
| As | 4.4 – 127 | 25.5 ± 38 | 16.1 – 29.4 | 22.7 ± 6.5 |
| Be | 1.20 – 45.3 | 9.79 ± 14 | 5.39 – 16.0 | 10.5 ± 5.16 |
| Ag | 1.9 – 9.8 | 4.8 ± 2.4 | 2.4 – 6.9 | 4.8 ± 2.0 |
| Tl | 0.3 – 4.78 | 1.06 ± 1.4 | 0.54 – 1.88 | 1.21 ± 0.62 |
| Th | 3.9 – 125 | 32 ± 44 | 28 – 95 | 58 ± 28 |
| in mg/Kg, dry weight | ||||
| Ba | 7.3 – 12.3 | 9.9 ± 1.5 | 5.8 – 10.5 | 8.9 ± 2.1 |
| Ni | 0.55 – 1.49 | 0.96 ± 0.23 | 0.12 – 1.05 | 0.66 ± 0.39 |
| V | 0.03 – 1.3 | 0.25 ± 0.41 | 0.05 – 0.25 | 0.13 ± 0.09 |
| U | 0.3 – 18 | 4.5 ± 7.3 | 2.0 – 7.9 | 4.6 ± 2.5 |
| Essential elements in mg/Kg, dry weight | ||||
| K | 3300–4280 | 3777 ± 250 | 2900 – 3690 | 3414 ± 360 |
| Mg | 1240–1650 | 1410 ±130 | 1200 – 1420 | 1360 ±100 |
| Ca | 1000 – 1360 | 1170 ±130 | 1150 – 1400 | 1320 ± 200 |
| Na | 12 – 120 | 33 ± 31 | 24 – 52 | 33 ± 13 |
| Fe | 34 – 624 | 163 ± 200 | 85 – 234 | 148 ± 68 |
| Mn | 35 – 132 | 67 ± 28 | 50 – 98 | 79 ± 20 |
| Cu | 4.3 – 5.94 | 4.9 ± 0.5 | 2.93 – 5.62 | 4.65 ± 1.21 |
| Zn | 16.9 – 26.6 | 23 ± 2.9 | 25 – 28 | 26 ± 1.7 |
| Mo | 0.65 – 1.74 | 1.28 ± 0.4 | 1.07 – 2.96 | 2.22 ± 0.85 |
| Cr | 0.02 – 0.32 | 0.08 ± 0.1 | 0.02 – 0.18 | 0.09 ± 0.07 |
| Se | 0.12 – 0.49 | 0.32 ± 0.12 | 0.09 – 0.33 | 0.21 ± 0.12 |
| Sr | 3.6 – 7.2 | 5.26 ± 1.22 | 4.60 – 10.8 | 6.43 ± 2.92 |
| Co | 0.03 – 0.59 | 0.10 ± 0.2 | 0.014 – 0.07 | 0.05 ± 0.02 |
Mean differences were not statistically significant at p < 0.05.
3.1. Toxic elements concentrations in the cereals
The mean and range of Pb concentrations (in μg/kg) was 69.9 ± 92 (10.8–362) for teff, 8.9 ± 3.8 (4.43–18.8) in wheat, and 8.9 ± 6.1 (4.4–28.9) in maize (Table 2). The wheat and teff samples had similar Cd concentrations (in μg/kg) of 5.4 ± 1.4 (3.33–8.34) and 4.8 ± 3.4 (0.85–11.3), respectively (Table 2). There was no significant difference between Cd levels in teff and wheat (Table 2). Maize samples showed Cd concentration of 1.5 ± 0.8 (0.7–3.1) μg/kg. Teff samples showed higher As concentration of 24.7 ± 32 (4.4–128) μg/kg. Maize had mean As concentration (in μg/kg) of 4.4 ± 1.2 (2.4–6.3), whereas wheat samples showed As levels of 4.5 ± 1.5 (2.7–7.1).
Other toxic elemental concentrations in the measured cereal samples decrease from teff to maize (Table 2). The most abundant toxic elements included Ba, Ni, and V (Table 2). The highest concentrations (in mg/kg) of Ba were determined in teff samples averaging at 9.6 ± 1.7 (5.8–12.3), 4.2 ± 1.5(1.2–6.7) in wheat, and 0.073 ± 0.04 (0.03–0.15) in maize. Nickel levels (in mg/kg) were averaging at 0.87 ± 0.31(0.12–1.5) in teff, 0.38 ± 0.12(0.20–0.7) in wheat, and 0.21 ± 0.12 (0.05–0.52) mg/kg in maize. Vanadium concentrations (in mg/kg) were significantly high in teff samples showing values of 0.22 ± 0.35 (0.03–1.30), compared to 0.031 ± 0.008 (0.02–0.05) in wheat, and 0.02 ± 0.007 (0.009–0.035) in maize. The least abundant elements were Be, Ag, Sb, Tl, Th, and U showing concentrations below 50 μg/kg in all the cereals. There was a significance difference in means of Be, Ni, Ba, Th and U in all the cereals (Table 2). However, there was no significance difference in the mean concentrations of V, Ag, and Sb, between maize and wheat samples (p > 0.05). Also there was no significant difference noted in the mean concentrations of Sb and Tl between maize and teff (Table 2). No significant difference was observed in concentrations of toxic elements between white and red teff types (p > 0.05) (Table 3).
3.2. Essential elements concentrations in the cereals
Teff samples showed significantly higher concentrations of Mg, Ca, Na, Fe, Cu, and Mn compared to wheat and maize (Table 2). Wheat samples had the highest K and Zn concentrations, whereas maize samples had the lowest concentration of all measured essential elements (Table 2). The most abundant essential elements in all analyzed cereals were K, Mg, Ca, and Na in the respective order. Wheat samples contained the highest level (in mg/kg) of K averaging at 4390 ± 420 (3800–5480), followed by teff, 3670 ± 320 (2900–4280), and maize 3140 ± 530 (1840–3990) (Table 2). Magnesium was the second most abundant element showing high average values (in mg/kg) of 1400 ± 120 (1200–1650) in teff, 1160 ± 110 (994–1430) in wheat, and 929 ± 140 (630–1160) in maize. Iron (Fe) and Mn concentrations decreased in the measured cereals in the order of teff > wheat > maize samples (Table 2). Both Cu and Zn concentrations were significantly low in maize compared to wheat and teff samples. However, Cu concentrations were higher in teff than wheat (p < 0.05) whereas Zn concentrations were significantly high in wheat than teff (p < 0.05) (Table 2). The least abundant essential elements were Mo, Cr, Se, and Co all showing mean concentrations below 2 mg/kg in all of the analyzed cereals (Table 2). There was a significant difference between the essential element concentrations in all the cereals, but was not statistically significant for Se and Mo between wheat and teff as well as Cr in maize and wheat (Table 2). White teff had higher concentrations of K, Mg, Fe, Se, and Co, whereas red teff had high concentrations of Ca, Zn, Mn, Sr, and Mo, but the differences were not significant (Table 3).
4. Discussion
4.1. Toxic elements in the cereals
Elements in the earth’s geologic materials can be distributed to the environmental media such as soils after weathering processes, or by direct deposition of volcanic ash materials in the soil. The composition of the parent material determines the concentrations of these elements in soils. In addition, anthropogenic activities such as mining, land use practices including fertilizer application and irrigation with industrial effluents can contribute these toxic metals to soils (Minase et al., 2016). Growing crops on contaminated soils incorporate these toxic metals into the food web and could result in adverse health effects in humans. These toxic elements (such as Pb, Cd, and As) mimic the activities of essential macronutrients by binding to cellular components (e.g. proteins and enzymes) thus affecting their functioning. We focus on Pb, Cd, and As because these metals are of high toxicity and could damage several body organs even at minute levels (Tchounwou et al., 2012).
4.1.1. Lead (Pb)
Lead toxicity is associated with neurocognitive, kidney disease, reproductive and cardiovascular system disorders (Jaishankar et al., 2014). While Pb concentrations in wheat and maize samples were not significantly different (p > 0.05), teff samples showed the highest average Pb content of 70 μg/kg (Table 2). There was no significant difference observed between Pb concentrations (in μg/kg) in white teff (73.7) and red teff (60) of this study (Table 3). Consistent with our findings, Dame (2018) reported concentrations (in μg/kg) of 40 and 50 in white and red teff, respectively. Similarly, Koubová et al. (2018) measured concentrations (in μg/kg) <10 in white and red teff grains from USA (0.84–1.42), Bolivia (0.63–1.63), and EU (1.0). On the other hand, Kibatu et al. (2017) reported high mean Pb concentrations of 500 μg/kg in white and red teff collected from Ethiopian households. In Ethiopia teff is mainly grown in the highlands during the dry season (United States Department of Agriculture (USDA, 2008); available data shows low concentrations of Pb in soils (Addis and Abebaw, 2017). Therefore, discrepancies in data of this study with those reported in the literature could be explained by the differences in geographic locations. Previous studies have shown that variation in plant genetics and mineral bioavailability from soils can affect composition of food crops (Ketema, 1997; Gebremariam et al., 2014; Glenske et al., 2018). Our wheat samples measured much lower Pb concentrations (in μg/kg) (8.9) compared to Pb in wheat from USA (350), Yamen (260–370), Saudi Arabia (1770–3520), Bangladesh (260), and Ethiopia (50) (AL-Gahri and Almussali, 2008; Ali and Al-Qahtani, 2012; Islam et al., 2014; Tegegne, 2015). High values reported by Ali and Al-Qahtani (2012) and Islam et al. (2014) are attributed to water and atmospheric pollution. Lead concentrations in our maize samples are similar to values reported by Taiwo et al. (2019) for maize from southwestern Nigeria. Abebe and Chandravanshi (2017) reported Pb concentrations ranging from 1210 to 1500 μg/kg in maize from three regions of Ethiopia. Islam et al. (2014) reported Pb concentrations of 310 μg/kg in maize from urban areas of northern Bangladesh, which were attributed to using poorly treated wastewaters in the farms and atmospheric pollution. Lead concentration in our cereal samples did not exceed the Codex standards of 200 μg/kg in cereal grains (FAO/WHO, 2001), except for one white teff sample with 362 μg/kg.
4.1.2. Cadmium (Cd)
Effects of Cd on human health include bronchial and pulmonary irritation, liver damage, kidney stone, and disorder of the nervous and immune system (Jaishankar et al., 2014). No significant difference was observed between Cd concentrations of teff and wheat in this study (Table 2). Our red teff samples had higher Cd concentrations compared to white teff; however no significant difference was observed (Table 3). Cadmium concentrations (in μg/kg) in our teff samples are in agreement with values (<10) reported by Koubová et al. (2018) for teff samples from Bolivia (1.1–1.31) and EU (1.73) as well as Idaho, USA (3.12–3.83). Dame (2018) reported Cd concentrations ranging from 3 to 5 μg/kg in Ethiopian teff purchased from local markets. Wheat has previously been reported as a major Cd contributor in diet (Thielecke and Nugent, 2018). On the contrary, our measured Cd concentrations (in μg/kg) in wheat (5.4) are much lower than the values (250–300) reported in Yamen and 1320–1900 in Saudi Arabia (AL-Gahri and Almussali, 2008 and Ali and Al-Qahtani, 2012). These values exceed the Codex standard limit for Cd in wheat set at 200 μg/kg (FAO/WHO, 2001). High Cd levels in Saudi Arabian cereals were attributed to air pollution as a result of industrial activities. Maize had lower Cd concentrations compared to wheat and teff (Table 2). Consistent with our low measurements, Tegegne, 2015 did not detect Cd in Ethiopian maize. Such low concentrations could be attributed to unpolluted, low Cd soils, where crops are grown (Addis and Abebaw, 2017). On the other hand, Mohammed and Nkuba, 2017 reported Cd content of 2630 μg/kg in maize grown near a phosphate mining site in Tanzania; this value exceeds the Codex standards of 100 μg/kg in cereal grains. There are no Codex standard limits established for Cd and other metal concentrations in teff; however, Cd content in our samples were below the set limits in cereal grains.
4.1.3. Arsenic (As)
Arsenic in its inorganic form is carcinogenic and can cause skin, lung and bladder cancers (Hong et al., 2014). In this study, the highest average total As concentrations (in μg/kg) were measured in teff (24.7), but no significant difference (p > 0.05) was observed in As content of maize (4.4) and wheat (4.5) (Table 2). Dame (2018) reported higher As concentrations (in μg/kg) of 340 and 160 in white and red teff samples from Ethiopian markets, respectively. No significant difference was observed between white and red teff samples of this study (Table 3). Arsenic levels in our teff are consistent with values (20–70 μg/kg) reported for white and red teff from USA, Bolivia, and EU (Koubová et al., 2018). Maize is one of the cereal grains that can accumulate high As levels (Azam et al., 2017). Maize grown on soils irrigated with contaminated water in Pakistan and Pb/Zn mine spills in China showed values (in μg/kg) ranging from 130 to 290 and 120–1150, respectively (Liu et al., 2005; Arain et al., 2009). In Bangladesh, maize showed As concentrations of 640 μg/kg (Islam et al., 2014). Rosas-Castor et al. (2014) recently reviewed total As concentrations in maize from the USA, Chile, Mexico, and China; As levels range from 20–550 μg/kg. Data on As levels in Ethiopian maize is scarce; however, we report concentrations of 4.4 μg/kg that is lower than concentrations reported in other studies. Literature on As accumulation, distribution, and speciation in wheat is limited (Azam et al., 2017). However, available data shows that wheat can accumulate high arsenic content due to cultivation on contaminated soils (Liu et al., 2012; Brackhage et al., 2014). We report As concentrations of 4.5 μg/kg in Ethiopian wheat (Table 2); these values are much lower than As concentrations of 570 μg/kg in wheat sampled from urban areas of northern Bangladesh (Islam et al., 2014). Studies from West Bengal India, indicate that wheat grains can accumulate As concentrations ranging from 7–360 μg/kg in As polluted areas (Roychowdhury et al., 2003; Bhattacharya et al., 2010). Concentrations of As in Ethiopian wheat from this study are consistent with average As levels (9 μg/kg) of Italian wheat grains (Cubadda et al., 2010).
4.2. Essential elements in the cereal grains
Essential elements are required for various biological functions in the human body (Fraga, 2005). Depending on the quantities required by the body, essential elements could be grouped as macronutrients or micronutrients. Macronutrients such as Ca, Mg, Na, and K are required in large quantities and are involved in bone regeneration, enzyme reactions and synthesis of proteins, and muscle and nerve functioning (Glenske et al., 2018). Micronutrients such as Fe, Cu, and Zn are required in trace amounts and aid in the functioning of proteins (e.g. hemoglobin) and enzyme activities (Fraga, 2005).
4.2.1. Macronutrients in cereals
4.2.1.1. Calcium (Ca).
Calcium concentrations in teff samples were 3.5 and 34 times higher than concentrations in wheat and maize, respectively (Table 2). Our data is in agreement with previous studies that have reported high Ca (in mg/kg) in red and white teff grains from Ethiopia (839–1550), USA (2420–2650), Bolivia (1650–2090), and EU (2310) (Abebe et al., 2007; Kibatu et al., 2017; Koubová et al., 2018). On the contrary, Baye et al. (2014); Dame (2018), and Zhu (2018) have reported lower Ca concentrations (in mg/kg) of 788.4, 315–444, and 180, respectively. Both Kibatu et al. (2017) and Dame (2018) sampled teff flours/grains from households and markets in Addis Ababa respectively, therefore discrepancies in calcium concentrations could be associated with varying original sources of teff (in terms of soils where teff was grown, and its genetics). On the other hand, Baye et al. (2014) reported that poor calcareous soils in Wollo region, Ethiopia accounts for the low Ca concentrations in their study. Hailu et al. (2015) on the other hand found high exchangeable Ca in soils of central Ethiopia and subsequent high Ca in plant tissues. Calcium concentration (344 mg/kg) in wheat samples of this study were twice as high as values (150 mg/kg) reported in wheat from Ethiopia (Baye et al., 2014). Calcium content in our maize samples (35 mg/kg) is lowr than Ca concentrations (160 mg/kg) reported in maize from Ethiopia (Abebe et al., 2007).
4.2.1.2. Magnesium (Mg).
Magnesium in foods is less widely studied (Joy et al., 2013). In this study, high Mg concentrations (in mg/kg) were reported in teff samples (1397), followed by wheat (1157) and lowest in maize (929) (Table 2). Our teff samples showed Mg concentrations (in mg/kg) consistent with those reported in red (2091) and white (1833) teff (Kibatu et al., 2017). However, Dame (2018) reported much lower Mg content (in mg/kg) in white (543) and red (473) teff samples purchased from markets in Addis Abba, Ethiopia. Magnesium concentration in our wheat samples is in the range of values reported for wheat species from Poland, German and the USA (1440–1670 mg/kg) (Suchowilska et al., 2012).
4.2.1.3. Potassium (K).
Ethiopian soils are low on K and its availability to plants depends on K/Mg or K/Ca ratios (Hailu et al., 2015). Wheat samples accumulated more K content (4390 mg/kg) compared to teff and maize (Table 2). Our K content in wheat agrees well with K values (4200–5000 mg/kg) reported for wheat species from Poland, German and the USA (Suchowilska et al., 2012). Such high K concentrations in wheat show the importance of substituting teff for other grains such as wheat because it provides nutrients that are insufficient in teff. No significant difference was observed between red (3414 mg/kg) and white (3777 mg/kg) teff of this study (Table 3); however, our K concentrations (in mg/kg) in teff are consistent with those of Kibatu et al. (2017) who reported (4868 mg/kg) in red and (3837 mg/kg) in white teff. Similar range of K values (in mg/kg) have been shown for teff from the USA (2750–3190), Bolivia (2790–4730), and EU (2980) (Koubová et al., 2018). Dame (2018) on the other hand, reported lower K concentrations (in mg/kg) in white (1289) and red (1147) teff from Ethiopia. Data on K concentration in maize grain is scarce; we report K concentrations of 3140 mg/kg in maize from Ethiopia.
4.2.1.4. Sodium (Na).
Concentrations of Na in analyzed cereals were much lower compared to other macronutrients (Table 2). Though teff samples had higher Na concentration compared to maize and wheat, these values are lower than those (115–220 mg/kg) reported in other red and white teff from Ethiopia (Mengesha, 1966; Dame, 2018; Zhu, 2018). The Na levels measured in this study are consistent with the findings of Kibatu et al. (2017) who reported levels ranging from 23–29 mg/kg in Ethiopian teff. We did not find much information on Na contents in wheat and maize from Ethiopia in the literature; however, Na concentrations (14 mg/kg) in wheat of this study is close to Na values (7–12 mg/kg) in wheat species from Poland, German and the USA (Suchowilska et al., 2012)
4.2.2. Essential micronutrients in cereals
4.2.2.1. Iron (Fe).
We report high average Fe concentrations (in mg/kg) of 159 in teff compared to maize (13) and wheat (33) in this study (Table 2). High iron content in teff from Ethiopia has previously been reported with ranges (in mg/kg) of 115–196, 377- >1500, 316–800, and 161–226 by Mengesha (1966); Abebe et al. (2007), (Baye et al., 2014), and Kibatu et al. (2017), respectively. Iron concentration in teff was not only been associated with soil or processing contamination (Baye et al., 2014), but also inherent factors based on the teff species (Mengesha, 1966). Baye et al. (2014) reported a significantly lower Fe concentration (316 mg/kg) in washed teff grains compared to unwashed teff grains (800 mg/kg) indicating possible soil contamination in teff grains. Our teff samples measured lower Fe content compared to the values reported by Baye et al. (2014) probably due to differences in soil chemistry. Wheat contains significant amounts of Fe among other essential elements (Ahmed et al., 2014). However, phytate in the wheat grains forms insoluble complexes with Fe in the body thus lowering its bioavailability. Iron content (in mg/kg) in our rinse washed wheat (33) is consistent with Fe content reported for washed Ethiopian wheat (36.5) (Baye et al., 2014). Both of which are lower than 46 mg/kg, the iron content in wheat grown on unpolluted soils (Rosentrater and Evers, 2018). Wheat from Yamen (51–53), Australia (57.6) and the USA (60.54) has higher Fe content (in mg/kg) compared to wheat from Ethiopia (AL-Gahri and Almussali, 2008). Iron accumulation in wheat is species dependent, Suchowilska et al. (2012) reported values ranging from 37.5 to 50 mg/kg for different wheat species originating from Poland, Australia, and the USA. Iron concentrations (in mg/kg) of 13 in our maize samples falls between Fe values of 0.4 and 44 in Ethiopian maize reported by Tegegne (2015) and Abebe et al. (2007), respectively. Other maize whole kernel analysis from the USA have shown Fe content ranging from 12.5 to 30.8 mg/kg (Glahn et al., 2019).The FAO/WHO limit for Fe in cereals is 425.50 mg/kg (Tegegne, 2015), which is greater than the Fe concentrations measured in all the cereals in this study.
4.2.2.2. Manganese (Mn).
We report higher average Mn content (in mg/kg) in teff (71) compared to maize (4.1) and wheat (43). Red teff has higher Mn content (79) compared to white teff (67) (Table 3). Manganese levels in teff of this study were higher than values (17–68 mg/kg) reported in red and white teff from the USA, Bolivia, and EU (Koubová et al., 2018). Our wheat samples showed higher Mn concentrations (in mg/kg) compared to values reported for wheat from Ethiopia (7.67, Tegegne, 2015) and Saudi Arabia (14–26, AL-Gahri and Almussali, 2008). On the other hand, Mn concentrations (in mg/kg) in wheat of this study showed range of values reported in other countries such as Yamen (35–50), Australia (26–44), and the USA (41)(AL-Gahri and Almussali, 2008; Suchowilska et al., 2012). Tegegne (2015) and Hongxing and Yu-Kui (2011) reported Mn concentrations of 0.42 and 0.34 mg/kg in maize, both of which are lower than Mn content of this study. Despite fertilizer applications, Behera and Shukla (2012) showed Mn concentrations of 3.47–4.73 mg/kg in maize from India, which were in agreement with our findings. The FAO/WHO limits for Mn in cereals is 500 mg/kg (Tegegne, 2015), which exceeds the Mn concentrations we measured in all of the cereals.
4.2.2.3. Copper (Cu).
Copper concentrations decrease in the order of teff > wheat > maize (Table 2). Our teff sample showed copper concentrations (in mg/kg) of 4.9 in white teff and 4.65 mg/kg in red teff (Table 3). Our values are consistent with those reported for red (3.9 mg/kg) and white (4.3 mg/kg) teff from Ethiopia (Kibatu et al., 2017). However, Dame (2018) reported lower Cu values (in mg/kg) for red (1.64) and white (1.65) teff while Koubová et al.(2018) showed higher Cu content (6.12–25.3) in red and white teff from the USA, Bolivia and EU compared to our values. Copper concentrations in our maize samples were higher (1.31 mg/kg) than those reported by Tegegne (2015) in maize from Ethiopia. The recommended limits for Cu by the FAO/WHO is 73.3 mg/kg (Tegegne, 2015). All the cereals in this study did not exceed this limit.
4.2.2.4. Zinc (Zn).
Zinc deficiency in soils as well as field crops is a global concern (Behera and Shukla, 2012). In Ethiopia, soils of the central highland are depleted of Zn among other elements, compelling farmers to apply Zn fertilizers to increase crop yield (Haileselassie et al., 2011; Hailu et al., 2015). Despite soil deficiency in Zn, Phytic acid in cereal grains has decreased its bioavailability leading to Zn malnutrition if animal products are poorly consumed (Umeta et al., 2005). Zinc concentrations in our samples decrease in the order of wheat- > teff > maize. Our Zn levels (in mg/kg) in wheat are higher than those reported in similar grains from Ethiopia (8.54 and 16.8) Bangladesh (2.9), Nigeria (11.32), Yamen (10–17), Australia (11.5), the USA (17.1), and Saudi Arabia (24–29) (AL-Gahri and Almussali, 2008; Ali and Al-Qahtani, 2012; Baye et al., 2014; Islam et al., 2014; Tegegne, 2015; Sulyman et al., 2015). Abebe et al. (2007) reported higher Zn concentrations (in mg/kg) in red teff (40.2) compared to white teff (28.6). Consistent with these findings, Kibatu et al. (2017) found high Zn content (in mg/kg) in red teff (33.5) as opposed to white teff (27). We did not observe a significant difference between red teff (26 mg/kg) and white teff (23 mg/kg), but our findings are similar to Zn content (in mg/kg) reported for Bolivia in red (23.5–24.7) and white teff (21.5–23.5) (Koubová et al., 2018). Dame (2018) reported the lowest Zn concentrations (in mg/kg) in red (9.58) and white (8.71) teff from Ethiopia while Koubová et al. (2018) published higher Zn levels in red (68.5–75) and white (66.9–73) teff from the USA. Zinc concentrations in our maize sample (18) were in the range of values between 0.66 and 40.4 reported in Tegegne (2015) and Abebe et al. (2007) for maize from Ethiopia. On the contrary, Zn content (in mg/kg) in our maize samples is higher than that found in China (15), Bangladesh (3.6), and Nigeria (13) as published in Hongxing and Yu-Kui (2011); Islam et al. (2014), and Taiwo et al. (2019). Maize grown on soils near a Pb/Zn mine in china showed Zn concentrations between 41.7 and 88.8 mg/kg (Liu et al., 2005). Additionally, maize grown near a phosphate mine in Tanzania showed high concentrations of 56.7 mg/kg due to contamination (Mohammed and Nkuba, 2017). Zinc fertilization has been found to increase Zn concentrations in maize grains (Behera and Shukla, 2012). The recommended limits for Zn in food by the FAO/WHO is 99.4 mg/kg (Tegegne, 2015); all the cereals in this study did not exceed these limits.
Other micronutrients of health relevance measured in this study include Sr, Mo, Se, Co, and Cr (Table 2). Strontium concentrations in wheat samples were in the range of values reported in previous studies. For instance, Suchowilska et al. (2012) reported Sr concentrations ranging between 3.0–5.4 mg/kg in various species of wheat from Poland, Germany and the USA. Contrary to the low Sr levels reported in maize samples of this study, Hongxing and Yu-Kui (2011) reported high Sr concentrations of 6.02 mg/kg in corn from Beijing. Similar to Ca, Sr concentrations in teff samples of this study were higher than those reported in Dame (2018)(1.1–1.2 mg/kg) in Ethiopian teff, Koubová et al. (2018)(0.22–0.28, 0.28–0.53, and 0.43 mg/kg in teff from the USA, Bolivia, and EU respectively). Limited data is available on the concentration of Mo in cereals; however, our results show higher Mo concentrations in wheat than a study carried out by Suchowilska et al. (2012) who reported Mo content ranging 0.7–1.2 mg/kg in different species of wheat Maize samples showed Mo values similar to the works of Hongxing and Yu-Kui (2011), who reported Mo content of 0.76 mg/kg in Beijing maize. We report Mo concentrations in our teff samples ranging 1.28–2.22 mg/kg. Contrary to our findings, Mengesha (1966) and Dame (2018) measured Mo concentrations in Ethiopian teff ranging 0.74–0.78 mg/kg and 0.1–0.3 mg/kg, respectively. Selenium (Se), Cr, and Co showed low (<4 mg/kg) concentrations in all the studied cereals. No reported values on Se concentrations were found in literature however, we report a higher (0.14 mg/kg) Se content in maize than 0.03 mg/kg previously reported in Hongxing and Yu-Kui (2011).
5. Conclusion
Elemental concentrations of cereal grains provide information on their nutritional value and safety; however, such information is scarce in Ethiopia. In addition, there is limited knowledge about the nutritional and health benefits of teff, an indigenous gluten-free cereal from Ethiopia that could be an alternative for celiac patients. We determined concentrations of toxic and essential elements in teff, wheat, and maize grown in volcanic ash-rich soils of the MER valley. Teff had more As and Pb compared to wheat and maize, which had similar values of these elements. Teff and wheat had similar Cd concentrations compared to maize. Cadmium and Pb concentrations in the samples were below the Codex standard established for these elements in cereal grains except for one teff sample that exceeded the Codex standard established for Pb in cereal grains. Magnesium, Ca, Na, Fe, Mn, Sr, and Cu accumulated more in teff, while K and Zn were higher in wheat. Low concentrations of essential elements were observed in maize. Significant differences in essential elements concentrations among the cereals suggest that teff is nutritionally better over wheat and maize. However, higher concentrations of some elements such as K and Zn in wheat suggest that supplementing other cereals for teff in the daily diet provides essential nutrients, which could otherwise be limited in teff.
This work provides additional information on the elemental distribution of staple cereals consumed in Ethiopia, where such data are currently scarce. The data will be valuable for nutritional database of these cereals, and food safety in Ethiopia and other parts of the world. This study also adds more information particularly to teff, which is getting a growing interest in producing it outside Ethiopia due to its nutritional values with desirable health benefits as demonstrated in our current study and as gluten-free food source.
Acknowledgements
The study is part of a project with the goal of understanding the health impacts of fluoride and metals on Ethiopian Rift Valley populations. We are very grateful for the funding from the NIEHS’s career development grant (K99/R00 ES023472). We thank the local water bureaus for their assistance in guiding us during the fieldwork.
Footnotes
Declaration of Competing Interest
The authors report no declarations of interest.
References
- Abebe A, Chandravanshi BS, 2017. Levels of essential and non-essential metals in the raw seeds and processed food (roasted seeds and bread) of maize/corn (Zea mays L.) cultivated in selected areas of Ethiopia. Bull. Chem. Soc. Ethiop 31 (2) 10.4314/bcse.v31i2.1, 185–199– 199. [DOI] [Google Scholar]
- Abebe Y, Bogale A, Hambidge KM, Stoecker BJ, Bailey K, Gibson RS, 2007. Phytate, zinc, iron and calcium content of selected raw and prepared foods consumed in rural Sidama, Southern Ethiopia, and implications for bioavailability. J. Food Compos. Anal 20 (3), 161–168. 10.1016/j.jfca.2006.09.003. [DOI] [Google Scholar]
- Addis W, Abebaw A, 2017. Determination of heavy metal concentration in soils used for cultivation of Allium sativum L. (garlic) in East Gojjam Zone, Amhara Region, Ethiopia. Cogent Chem 3 (1), 1419422. 10.1080/23312009.2017.1419422. [DOI] [Google Scholar]
- Ahmed A, Randhawa MA, Sajid MW, 2014. Chapter 6—Bioavailability of calcium, iron, and zinc in whole wheat flour. In: Watson RR, Preedy VR, Zibadi S (Eds.), Wheat and Rice in Disease Prevention and Health. Academic Press, pp. 67–80. 10.1016/B978-0-12-401716-0.00006-4. [DOI] [Google Scholar]
- Akinyele IO, Shokunbi OS, 2015. Comparative analysis of dry ashing and wet digestion methods for the determination of trace and heavy metals in food samples. Food Chem. 173, 682–684. 10.1016/j.foodchem.2014.10.097. [DOI] [PubMed] [Google Scholar]
- Alemayehu K, Sheleme B, Schoenau J, 2016. Characterization of problem soils in and around the south central Ethiopian Rift Valley. J. Soil Sci. Environ. Manag 7 (11), 191–203. 10.5897/JSSEM2016.0593. [DOI] [Google Scholar]
- AL-Gahri MA, Almussali MS, 2008. Microelement contents of locally produced and imported wheat grains in Yemen. J. Chem 5 (4), 838–843. 10.1155/2008/308183. [DOI] [Google Scholar]
- Ali MHH, Al-Qahtani KM, 2012. Assessment of some heavy metals in vegetables, cereals and fruits in Saudi Arabian markets. Egypt. J. Aquat. Res 38 (1), 31–37. 10.1016/j.ejar.2012.08.002. [DOI] [Google Scholar]
- Arain MB, Kazi TG, Baig JA, Jamali MK, Afridi HI, Shah AQ, Jalbani N, Sarfraz RA, 2009. Determination of arsenic levels in lake water, sediment, and foodstuff from selected area of Sindh, Pakistan: estimation of daily dietary intake. Food Chem. Toxicol 47 (1), 242–248. [DOI] [PubMed] [Google Scholar]
- Azam SMGG, Afrin S, Naz S, 2017. Arsenic in cereals, their relation with human health risk, and possible mitigation strategies. Food Rev. Int 33 (6), 620–643. 10.1080/87559129.2016.1210633. [DOI] [Google Scholar]
- Baye K, Mouquet-Rivier C, Icard-Vernìere C, Picq C, Guyot J-P, 2014. Changes in mineral absorption inhibitors consequent to fermentation of Ethiopian injera: implications for predicted iron bioavailability and bioaccessibility. Int. J. Food Sci. Technol 49 (1), 174–180. 10.1111/ijfs.12295. [DOI] [Google Scholar]
- Behera SK, Shukla AK, 2012. Yield and zinc, copper, manganese and iron concentration in maize (Zea mays L.) grown on Vertisol as influenced by zinc application from various zinc fertilizers. J. Plant Nutr 38 (10), 1544–1557. [Google Scholar]
- Benvenuti M, Carnicelli S, Belluomini G, Dainelli N, Di Grazia S, Ferrari GA, Iasio C, Sagri M, Ventra D, Atnafu B, Kebede S, 2002. The Ziway–shala lake basin (main Ethiopian rift, Ethiopia): a revision of basin evolution with special reference to the Late Quaternary. J. Afr. Earth Sci 35 (2), 247–269. 10.1016/S0899-5362(02)00036-2. [DOI] [Google Scholar]
- Bhattacharya P, Samal AC, Majumdar J, Santra SC, 2010. Arsenic Contamination in rice, wheat, pulses, and vegetables: A Study in an Arsenic Affected Area of West Bengal, India. Water Air Soil Pollut. 213 (1), 3–13. 10.1007/s11270-010-0361-0369. [DOI] [Google Scholar]
- Brackhage C, Huang J-H, Schaller J, Elzinga EJ, Dudel EG, 2014. Readily available phosphorous and nitrogen counteract for arsenic uptake and distribution in wheat (Triticum aestivum L.). Sci. Rep 4 (1), 4944. 10.1038/srep04944. [DOI] [PMC free article] [PubMed] [Google Scholar]
- Chaudhary DP, Kumar S, Yadav OP, 2014. Nutritive value of maize: improvements, applications and constraints. In: Chaudhary Dharam Paul, Kumar S, Langyan S (Eds.), Maize: Nutrition Dynamics and Novel Uses. Springer, India, pp. 3–17. 10.1007/978-81-322-1623-0_1. [DOI] [Google Scholar]
- Chen Y, Wang M, Ouwerkerk PBF, 2012. Molecular and environmental factors determining grain quality in rice. Food Energy Secur. 1 (2), 111–132. 10.1002/fes3.11. [DOI] [Google Scholar]
- Cubadda F, Ciardullo S, D’Amato M, Raggi A, Aureli F, Carcea M, 2010. Arsenic contamination of the environment Food chain: a survey on wheat as a test plant to investigate phytoavailable arsenic in italian agricultural soils and as a source of inorganic arsenic in the diet. J. Agric. Food Chem 58 (18), 10176–10183. 10.1021/jf102084p. [DOI] [PubMed] [Google Scholar]
- Dame ZT, 2018. Analysis of major and trace elements in teff (Eragrostis tef). J. King Saud Univ. - Sci 10.1016/j.jksus.2018.03.020. [DOI] [Google Scholar]
- FAO/WHO, 2001. Food and Additive and Contaminants by the Joint FAO/WHO Food Codex Alimentarius. Commision Standard Program, ALINORM 01/12a, pp. 1–289. [Google Scholar]
- Fraga CG, 2005. Relevance, essentiality and toxicity of trace elements in human health. Mol. Aspects Med 26 (4–5), 235–244. 10.1016/j.mam.2005.07.013. [DOI] [PubMed] [Google Scholar]
- Fritzsche F, Zech W, Guggenberger G, 2007. Soils of the main ethiopian Rift Valley escarpment: a transect study. CATENA 70 (2), 209–219. 10.1016/j.catena.2006.09.005. [DOI] [Google Scholar]
- Gebremariam MM, Zarnkow M, Becker T, 2014. Teff (Eragrostis tef) as a raw material for malting, brewing and manufacturing of gluten-free foods and beverages: a review. J. Food Sci. Technol 51 (11), 2881–2895. 10.1007/s13197-012-0745-5. [DOI] [PMC free article] [PubMed] [Google Scholar]
- Glahn R, Tako E, Gore MA, 2019. The germ fraction inhibits Iron bioavailability of maize: identification of an approach to enhance maize nutritional quality via processing and breeding. Nutrients 11 (4). 10.3390/nu11040833. [DOI] [PMC free article] [PubMed] [Google Scholar]
- Glenske K, Donkiewicz P, Köwitsch A, Milosevic-Oljaca N, Rider P, Rofall S, Franke J, Jung O, Smeets R, Schnettler R, Wenisch S, Barbeck M, 2018. Applications of metals for bone regeneration. Int. J. Mol. Sci 19 (3) 10.3390/ijms19030826. [DOI] [PMC free article] [PubMed] [Google Scholar]
- Goldhaber SB, 2003. Trace element risk assessment: essentiality vs. Toxicity. Regul. Toxicol. Pharmacol 38 (2), 232–242. [DOI] [PubMed] [Google Scholar]
- Haileselassie B, Stomph T-J, Hoffland E, 2011. Teff (Eragrostis tef) production constraints on Vertisols in Ethiopia: farmers’ perceptions and evaluation of low soil zinc as yield-limiting factor. Soil Sci. Plant Nutr 57 (4), 587–596. 10.1080/00380768.2011.593482. [DOI] [Google Scholar]
- Hailu H, Mamo T, Keskinen R, Karltun E, Gebrekidan H, Bekele T, 2015. Soil fertility status and wheat nutrient content in Vertisol cropping systems of central highlands of Ethiopia. Agric. Food Secur 4 (1), 19. 10.1186/s40066-015-0038-0. [DOI] [Google Scholar]
- Hong Y-S, Song K-H, Chung J-Y, 2014. Health effects of chronic arsenic exposure. J. Prev. Med. Public Health 47 (5), 245–252. 10.3961/jpmph.14.035. [DOI] [PMC free article] [PubMed] [Google Scholar]
- Hongxing Z, Yu-Kui R, 2011. Determination of trace elements, heavy metals and rare earth elements in corn seeds from Beijing by ICP-MS simultaneously. J. Chem 8. 10.1155/2011/152713. [DOI] [Google Scholar]
- Hopman E, Dekking L, Blokland M-L, Wuisman M, Zuijderduin W, Koning F, Schweizer J, 2008. Tef in the diet of celiac patients in the Netherlands. Scand. J. Gastroenterol 43 (3), 277–282. 10.1080/00365520701714871. [DOI] [PubMed] [Google Scholar]
- Hussain A, Larsson H, Kuktaite R, Johansson E, 2010. Mineral composition of organically grown wheat genotypes: contribution to daily minerals intake. Int. J. Environ. Res. Public Health 7 (9), 3442–3456. 10.3390/ijerph7093442. [DOI] [PMC free article] [PubMed] [Google Scholar]
- Islam Md.S., Ahmed Md.K., Habibullah-Al-Mamun Md., 2014. Heavy metals in cereals and pulses: health implications in Bangladesh. J. Agric. Food Chem 62 (44), 10828–10835. 10.1021/jf502486q. [DOI] [PubMed] [Google Scholar]
- Jaishankar M, Tseten T, Anbalagan N, Mathew BB, Beeregowda KN, 2014. Toxicity, mechanism and health effects of some heavy metals. Interdiscip. Toxicol 7 (2), 60–72. 10.2478/intox-2014-0009. [DOI] [PMC free article] [PubMed] [Google Scholar]
- Joy EJM, Young SD, Black CR, Ander EL, Watts MJ, Broadley MR, 2013. Risk of dietary magnesium deficiency is low in most African countries based on food supply data. Plant Soil 368 (1/2), 129–137. JSTOR. https://www.jstor.org/stable/42952553. [Google Scholar]
- Ketema S, 1997. Eragrostis tef (Zucc.) Trotter. Promoting the conservation and use of underutilized and neglected crops. Bioversity International Publication No. 12. Gatersleben/International Plant Genetic Resources Institute, Rome, Italy. [Google Scholar]
- Kibatu G, Chacha R, Kiende R, 2017. Determination of major, minor and trace elements in tef using portable total X-Ray fluorescence (TXRF) spectrometer. EC Nutrition 9 (1), 51–59. [Google Scholar]
- Knowling M, 2015. Planting maize, beans, wheat and teff in Ethiopia. Nuru International. https://nuruinternational.org/blog/agriculture/planting-maize-beans-wheat-and-teff-in-ethiopia/. [Google Scholar]
- Koubová E, Sumczynski D, Šenkárová L, Orsavová J, Fišera M, 2018. Dietary intakes of minerals, essential and toxic trace elements for adults from Eragrostis tef L.: a nutritional assessment. Nutrients 10 (4), 479. 10.3390/nu10040479. [DOI] [PMC free article] [PubMed] [Google Scholar]
- Laekemariam F, Kibret K, 2020. Explaining soil fertility heterogeneity in smallholder farms of Southern Ethiopia. Appl. Environ. Soil Sc i 1–16. Hindawi ID. 616059. 10.1155/2020/6161059. [DOI] [Google Scholar]
- Laekemariam F, Kibret K, Shiferaw H, 2018. Potassium (K)-to-magnesium (Mg) ratio, its spatial variability and implications to potential Mg-induced K deficiency in Nitisols of Southern Ethiopia. Agric. Food Secur 7 (1), 13. 10.1186/s40066-018-0165-5. [DOI] [Google Scholar]
- Le Turdu C, Tiercelin J-J, Gilbert E, 1999. The Ziway-Shala lake basin system, Main Ethiopian Rift: influence of Volcanism, tectonics, and climate forcing on basin formation and sedimentation. Paleogeogr. Paleoclimatol. Paleoecol 150 (3–4), 135–177. [Google Scholar]
- Liu H, Probst A, Liao B, 2005. Metal contamination of soils and crops affected by the Chenzhou lead/zinc mine spill (Hunan, China). Sci. Total Environ 339 (1–3), 153–166. 10.1016/j.scitotenv.2004.07.030. [DOI] [PubMed] [Google Scholar]
- Liu Q, Zheng C, Hu CX, Tan Q, Sun XC, Su JJ, 2012. Effects of high concentrations of soil arsenic on the growth of winter wheat (Triticum aestivum L) and rape (Brassica napus). Plant Soil Environ 58 (1), 22–27. 10.17221/311/2011-PSE. [DOI] [Google Scholar]
- Lundin KEA, Nilsen EM, Scott HG, Løberg EM, Gjøen A, Bratlie J, Skar V, Mendez E, Løvik A, Kett K, 2003. Oats induced villous atrophy in coeliac disease. Gut 52 (11), 1649–1652. 10.1136/gut.52.11.1649. [DOI] [PMC free article] [PubMed] [Google Scholar]
- Mengesha MH, 1966. Chemical composition of teff (Eragrostis tef) compared with that of wheat, barley and grain sorghum. Econ. Bot 20 (3), 268–273. 10.1007/BF02904277. [DOI] [Google Scholar]
- Minase NA, Masafu MM, Geda AE, Wolde AT, 2016. Heavy metals in agricultural soils of Central Ethiopia: the contribution of land use types and organic sources to their variability. Open J. Soil Sci 6 (6), 99–112. 10.4236/ojss.2016.66011. [DOI] [Google Scholar]
- Mohammed N, Nkuba L, 2017. Concentration levels and the associated health risks of elements in food crops grown in the neighbourhood of minjingu phosphate mine, tanzania. Chem. Sci. Int. J 18, 1–9. 10.9734/CSIJ/2017/31476. [DOI] [Google Scholar]
- Moor C, Lymberopouloo T, Dietrich V, 2001. Determination of heavy metals in soils, sediments and geologic materials by ICP-AES and ICP-MS. Mikrochim. Acta 136, 123–128. [Google Scholar]
- Nuss ET, Tanumihardjo SA, 2010. Maize: a paramount staple crop in the context of global nutrition. Compr. Rev. Food Sci. Food Saf 9 (4), 417–436. 10.1111/j.1541-4337.2010.00117.x. [DOI] [PubMed] [Google Scholar]
- Peccerillo A, Donati C, Santo AP, Orlando A, Yirgu G, Ayalew D, 2007. Petrogenesis of silicic peralkaline rocks in the Ethiopian rift: geochemical evidence and volcanological implications. J. Afr. Earth Sci 48 (2–3), 161–173. 10.1016/j.jafrearsci.2006.06.010. [DOI] [Google Scholar]
- Radlowski EC, Johnson RW, 2013. Perinatal iron deficiency and neurocognitive development. Front. Hum. Neurosci 7 10.3389/fnhum.2013.00585. [DOI] [PMC free article] [PubMed] [Google Scholar]
- Rosas-Castor JM, Guzmán-Mar JL, Hernández-Ramírez A, Garza-González MT, Hinojosa-Reyes L, 2014. Arsenic accumulation in maize crop (Zea mays): a review. Sci. Total Environ 488–489, 176–187. 10.1016/j.scitotenv.2014.04.075. [DOI] [PubMed] [Google Scholar]
- Rosentrater KA, Evers AD, 2018. Chapter 4—Chemical components and nutrition. In: Rosentrater KA, Evers AD (Eds.), Kent’S Technology of Cereals (Fifth Edition). Woodhead Publishing, pp. 267–368. 10.1016/B978-0-08-100529-3.00004-00009.. [DOI] [Google Scholar]
- Roychowdhury T, Tokunaga H, Ando M, 2003. Survey of arsenic and other heavy metals in food composites and drinking water and estimation of dietary intake by the villagers from an arsenic-affected area of West Bengal, India. Sci. Total Environ 308 (1–3), 15–35. 10.1016/S0048-9697(02)00612-00615. [DOI] [PubMed] [Google Scholar]
- Sharma AK, Chauhan ES, 2018. Nutritional composition, physical characteristics and health benefits of teff grain for human consumption: a review. The Pharma Innovation Journal 7 (10), 03–07. [Google Scholar]
- Suchowilska E, Wiwart M, Kandler W, Krska R, 2012. A comparison of macro- and microelement concentrations in the whole grain of four Triticum species. Plant Soil Environ 58 (3), 141–147. 10.17221/688/2011-PSE. [DOI] [Google Scholar]
- Sulyman YI, Abdulrazak S, Oniwapele YA, Ahmad A, 2015. Concentration of heavy metals in some selected cereals sourced within Kaduna state, Nigeria. IOSR J. Environ. Sci. Toxicol. Food Technol 9 (10), 17–19. 10.6084/m9.figshare.1574055.v1. [DOI] [Google Scholar]
- Taiwo AM, Oyeleye OF, Majekodunmi BJ, Anuobi VE, Afolabi SA, Idowu OE, Ojekunle ZO, Taiwo OT, 2019. Evaluating the health risk of metals (Zn, Cr, Cd, Ni, Pb) in staple foods from Lagos and Ogun States, Southwestern Nigeria. Environ. Monit. Assess 191 (3), 167. 10.1007/s10661-019-7307-5. [DOI] [PubMed] [Google Scholar]
- Tchounwou PB, Yedjou CG, Patlolla AK, Sutton DJ, 2012. Heavy metals toxicity and the environment. EXS 101, 133–164. 10.1007/978-3-7643-8340-4_6. [DOI] [PMC free article] [PubMed] [Google Scholar]
- Tegegne WA, 2015. Assessment of some heavy metals concentration in selected cereals collected from local markets of Ambo City, Ethiopia. J. Cereals Oilseeds 6 (2), 8–13 10.5897/JCO15. [DOI] [Google Scholar]
- Teklíc T, Loňcaríc Z, Kovačevíc V, Singh BR, 2013. Metallic trace elements in cereal grain – a review: How much metal do we eat? Food Energy Secur. 2 (2), 81–95. 10.1002/fes3.24. [DOI] [Google Scholar]
- Thielecke F, Nugent AP, 2018. Contaminants in Grain—A Major Risk for Whole Grain Safety? Nutrients 10 (9), 1213. 10.3390/nu10091213. [DOI] [PMC free article] [PubMed] [Google Scholar]
- Ullah I, Ali M, Farooqi A, 2010. Chemical and Nutritional Properties of Some Maize (Zea mays L.) Varieties Grown in NWFP, Pakistan. Pak. J. Nutr 9 (11), 1113–1117. [Google Scholar]
- Umeta M, West CE, Fufa H, 2005. Content of zinc, iron, calcium and their absorption inhibitors in foods commonly consumed in Ethiopia. J. Food Compos. Anal 18 (8), 803–817 10.1016/j.jfca.2004.09.008. [DOI] [Google Scholar]
- United States Department of Agriculture (USDA), 2008. Ethiopia 2008 Crop Assessment Travel Report. https://ipad.fas.usda.gov/highlights/2008/11/eth_25nov2008/.
- Yitbarek T, Beyene S, Kibret K, 2016. Characterization and classification of soils of abobo area, Western Ethiopia [Research article]. Appl. Environ. Soil Sci 10.1155/2016/4708235. Hindawi December 19. [DOI] [Google Scholar]
- Zhu F, 2018. Chemical composition and food uses of teff (Eragrostis tef). Food Chem. 239, 402–415. 10.1016/j.foodchem.2017.06.101. [DOI] [PubMed] [Google Scholar]