Abstract
With the rapid advancement in multiplex tissue staining, computer hardware, and machine learning, computationally-based tools are becoming indispensable for the evaluation of digital histopathology. Historically, standard histochemical staining methods such as hematoxylin and eosin, periodic acid-Schiff, and trichrome have been the gold standard for microscopic tissue evaluation by pathologists, and therefore brightfield microscopy images derived from such stains are primarily used for developing computational pathology tools. However, these histochemical stains are nonspecific in terms of highlighting structures and cell types. In contrast, immunohistochemical stains use antibodies to specifically detect and quantify proteins, which can be used to specifically highlight structures and cell types of interest. Traditionally, such immunofluorescence-based methods are only able to simultaneously stain a limited number of target proteins/antigens, typically up to three channels. Fluorescence-based multiplex immunohistochemistry (mIHC) is a new technology that enables simultaneous localization and quantification of numerous proteins/antigens, allowing for the possibility to detect a wide range of histologic structures and cell types within tissue. However, this method is limited by cost, specialized equipment, technical expertise, and time. In this study, we implemented a deep learning-based pipeline to synthetically generate in silico mIHC images from brightfield images of tissue slides-stained with routinely used histochemical stains, in particular PAS. Our tool was trained using fluorescence-based mIHC images as the ground-truth. The proposed pipeline offers high contrast detection of structures in brightfield imaged tissue sections stained with standard histochemical stains. We demonstrate the performance of our pipeline by computationally detecting multiple compartments in kidney biopsies, including cell nuclei, collagen/fibrosis, distal tubules, proximal tubules, endothelial cells, and leukocytes, from PAS-stained tissue sections. Our work can be extended for other histologic structures and tissue types and can be used as a basis for future automated annotation of histologic structures and cell types without the added cost of actually generating mIHC slides.
Keywords: Multiplex IHC, fluorescence imaging, deep learning, segmentation, machine learning
1. INTRODUCTION
Immunofluorescence (IF) microscopy is a powerful technique used to assess the location and quantity of specific antigens on tissue sections. Typically, the tissue is first stained with a primary antibody targeting a specific protein of interest, followed by a secondary antibody tagged with a fluorophore. The secondary antibody specifically recognizes the primary antibody, and thus the fluorophore will be localized to the protein of interest. Detection of a fluorescence signal indicates the presence and location of that protein, and the intensity of the signal is an indicator of relative protein quantity.
Standard IF microscopy is limited by the number of antigens that can be detected simultaneously on the same tissue section. More recently, a number of multiplex immunohistochemistry (mIHC) techniques have been developed to allow for the simultaneous detection of numerous (in some systems >40) antigens. Such methods allow for the detection of specific structures and cell types within the same tissue section. However, the utility of such mIHC systems is primarily constrained by cost, specialized equipment, technical expertise, and time1.
Digital and computational pathology is an emerging area focusing on precise detection and quantification of histologic findings within digital whole slide images (WSIs). Typically, the WSIs consist of tissue sections stained with histochemical stains (e.g. hematoxylin, eosin, etc.) and imaged using brightfield microscopy. Often, the goal is to develop computer algorithms that can automate at least part of the pathologist’s assessment of tissue specimens. Given the subjective nature of visual evaluation by pathologists, the hope is that computational methodologies may offer enhanced precision and accuracy. At the crux of developing computational approaches to digital pathology is annotation of histologic structure within the WSIs. Being a tedious and time-consuming process, accurate and sufficient annotation is often the major bottleneck in developing such digital pathology tools.
In this study, we leveraged the specificity of molecular markers for histologic structures and cell types using mIHC to develop a deep learning-based image analysis pipeline to generate in silico/synthetic mIHC images from standard histochemically stained brightfield microscopy WSIs. The resulting in silico images offer specific labeling of structures and cell types within kidney tissue that can be used as a basis for future automated annotation without the added cost of actually generating mIHC slides. We demonstrate that our tool is able to generate in silico mIHC images that accurately label components of the renal cortex, including nuclei, collagen, distal tubules, proximal tubules, endothelial cells, and leukocytes from corresponding periodic acid-Schiff (PAS)-stained WSIs. Corresponding fluorescence-based mIHC WSIs were used as the ground-truth for training and testing the pipeline. The compartments detected in this example study have implications in renal pathology, and once our proposed tool is more developed with further performance analysis, the resulting method may have major impact in automating evaluation and morphometry of renal biopsies.
2. METHODS
Twenty kidney transplant biopsies showing a spectrum of histologic changes including various forms of rejection were used. Each tissue section was first stained and imaged using a fluorescence-based mIHC imaging system (Vectra 3 Automated Quantitative Pathology Imaging System, Akoya Biosciences, Hopkinton, MA). Subsequently, the same sections were stained using periodic acid-Schiff (PAS) and imaged using a whole slide brightfield microscope system (Aperio ImageScope, Leica Biosystems).
2.1. Tissue Staining & Imaging:
Preparation of formalin-fixed paraffin-embedded tissue sections was performed by following a previously described procedure2. We performed mIHC following a manufacturer’s protocol for Opal™ 7-color manual IHC kit (Akoya Bioscience) with additional steps to reduce autofluorescence2. The antibodies used for mIHC were anti-CD45 (clone GA751 from DAKO), anti-CD34 (clone IS632, DAKO), anti-type-III collagen (Abcam), anti-ASS1 (ThermoFisher), and anti-cytokeratins (clone AE1/AE3, Santa Cruz Biotechnology). The Opal fluorescence dye used for each marker was Opal690 (CD45), Opal620 (CD34), Opal570 (ASS1), Opal 540 (AE1/AE3), and Opal520 (type-III collagen). Slides stained for mIHC were scanned using multispectral imaging microscope (Vectra 3.0), and unmixed multispectral images were performed using inForm ver. 2.4.8. Tissue segmentation, cell segmentation, and phenotyping were performed as described previously3. Unmixed images were converted to multilayered-tag image file format (TIFF) files for further analysis. The tissues stained for mIHC were re-used for PAS staining (StatLab). PAS-stained tissue sections were scanned using Aperio ImageScope (Leica Biosystems), and digital images were viewed using the ImageScope application (Leica Biosystems).
2.2. Stitching:
The mIHC system generates data as several adjacent patches, and therefore the images patches were first stitched together in order to conduct analysis across a whole slide. The coordinate information for the patches was visually verified by loading the annotation eXtensible Markup Language (XML) file and the high-resolution TIFF patches in the whole slide contextual viewer Phenochart (Akoya). The stitched whole-slide images (WSI) were saved in .mat format for MATLAB processing. The high-resolution TIFF images were viewed using the bioformats plugin in MATLAB. Using this plugin, the patches were stitched based on the available annotations.
2.3. Image Registration:
The deep learning model used in this study consisted of a generative adversarial network (GAN), particularly, pix2pix network model, which performs image-to-image translation from the source domain to the target domain. This network is based on a conditioning image that is applied as input to the network. The network generates output images based on the condition applied to the source image. In other words, the network learns the mapping from source to target image. As a result, the dataset for network training should have corresponding images from the two domains in order to learn mapping from the source to the target domain. To accomplish this requirement for the training dataset, image registration between the fluorescence and brightfield (i.e. PAS) images needed to be addressed.
Registration enables a comparison of multiple images acquired from subjects at varying instances and different imaging modalities4. In this study, the stitched fluorescence WSI is registered against the corresponding PAS-stained tissue section. We implemented a semi-automated approach for registration where the control points were selected from the reference image (i.e., PAS-stained tissue image) and from the target image (i.e., fluorescence-stained tissue image). The points were manually selected based on structures in both images. These chosen control points identify the same feature or position in the images, which estimate a geometric transformation matrix. This mapping is then applied to the fluorescence image that is to be registered against the PAS image. The registration results were qualitatively judged by visual inspection using the MATLAB command ‘imshowpair’ which overlays the registered image on the reference image and highlights the areas of alignment and those that are misaligned. The results were also verified quantitatively by calculating the sensitivity, specificity, positive predictive value (PPV), and negative predictive value (NPV). To calculate these statistics, binary masks for both the PAS and fluorescence image were generated. True positive corresponded to regions overlapping between the PAS and fluorescence binary masks. Regions of the PAS mask that did not overlap with the fluorescence mask was defined as false negative, and regions of the fluorescence mask that did not overlap with the PAS mask was defined as false positive. The common background between the two masks was taken as true negative.
2.4. Computational Model:
As discussed in Section 2.3, the deep learning model pix2pix was used to learn the mapping of the brightfield PAS to fluorescence domain. The GAN architecture is comprised of two networks, a generator and a discriminator model. Each of these models has specific roles; the generator model outputs new plausible synthetic images, and the discriminator model classifies images as real versus synthetic.
The generator learns the mapping between the two domains through adversarial loss and L1 loss measured between the generated image and the expected output image. This network is based on U-Net architecture, which is built on two networks, the encoder and decoder. U-Net’s network incorporates skip connections between encoder layers and decoder layers5. The encoder network of the generator has seven convolutional blocks, each having a convolutional layer, followed by a Leaky ReLU activation function and batch normalization layer (except the first convolutional layer). The decoder network of the generator has seven upsampling convolutional blocks, each having an upsampling layer, followed by a convolutional layer, batch normalization layer, and a ReLU activation function5. The discriminator uses patchGAN architecture consisting of five convolutional blocks. The patchGAN network takes concatenated input images, and produces an output that of the same size as the input image5. To train the model to convert PAS to fluorescence image, we fed the network with input (PAS) and target (fluorescence) images. Thus, the network can be trained by iterating over the data set, inputting the images one by one or by batch to the pix2pix model.
2.5. Training Data Description:
Six WSIs were used for training the network model, and the training set consisted of 35312 paired patches of PAS-stained tissue sections and their corresponding fluorescence images. The six compartments in the fluorescence image were identified by six different colors based on the wavelength of light measured from each component. The image patch sizes were 256 × 256 pixels.
3. RESULTS
3.1. Stitching:
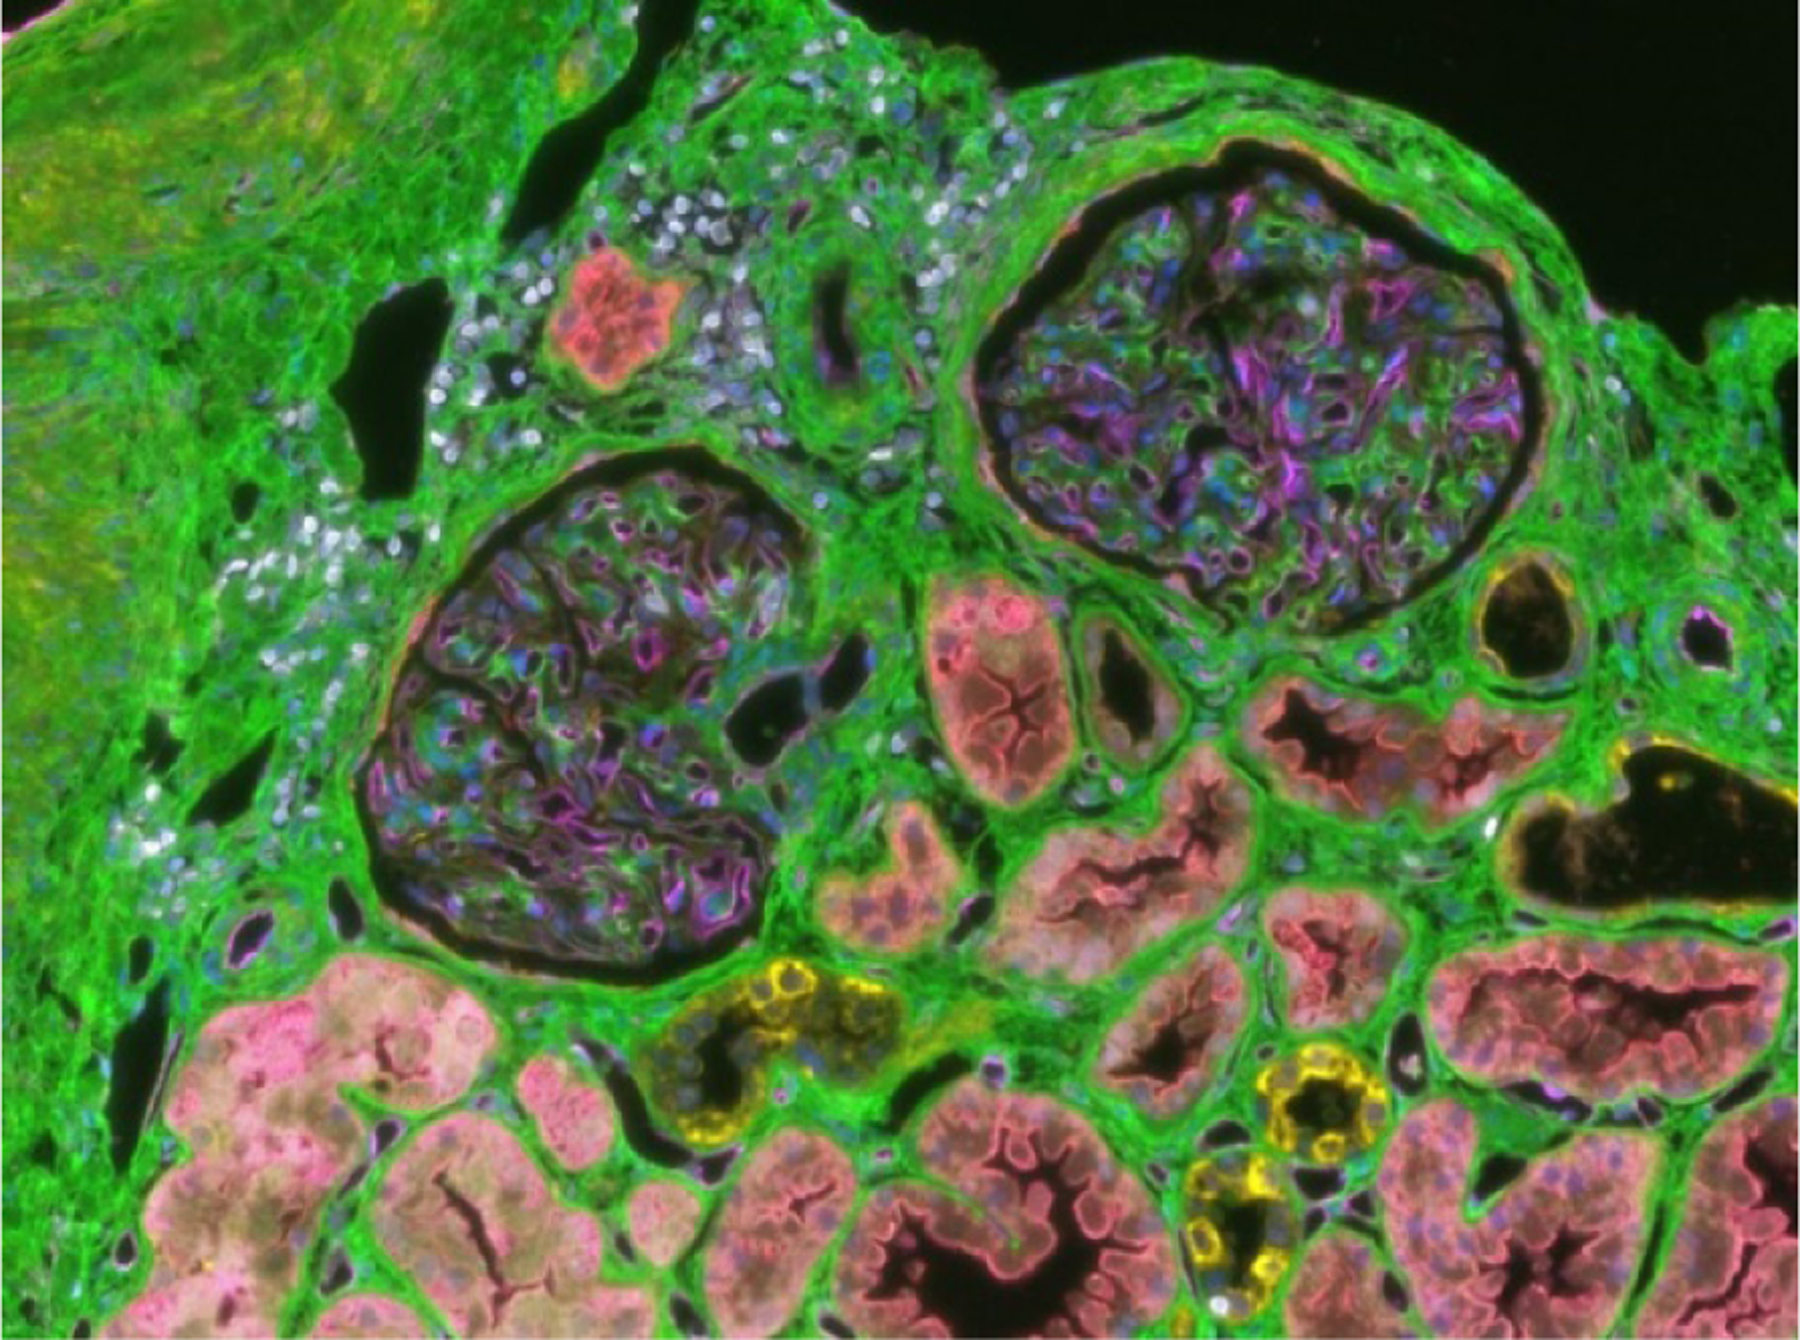
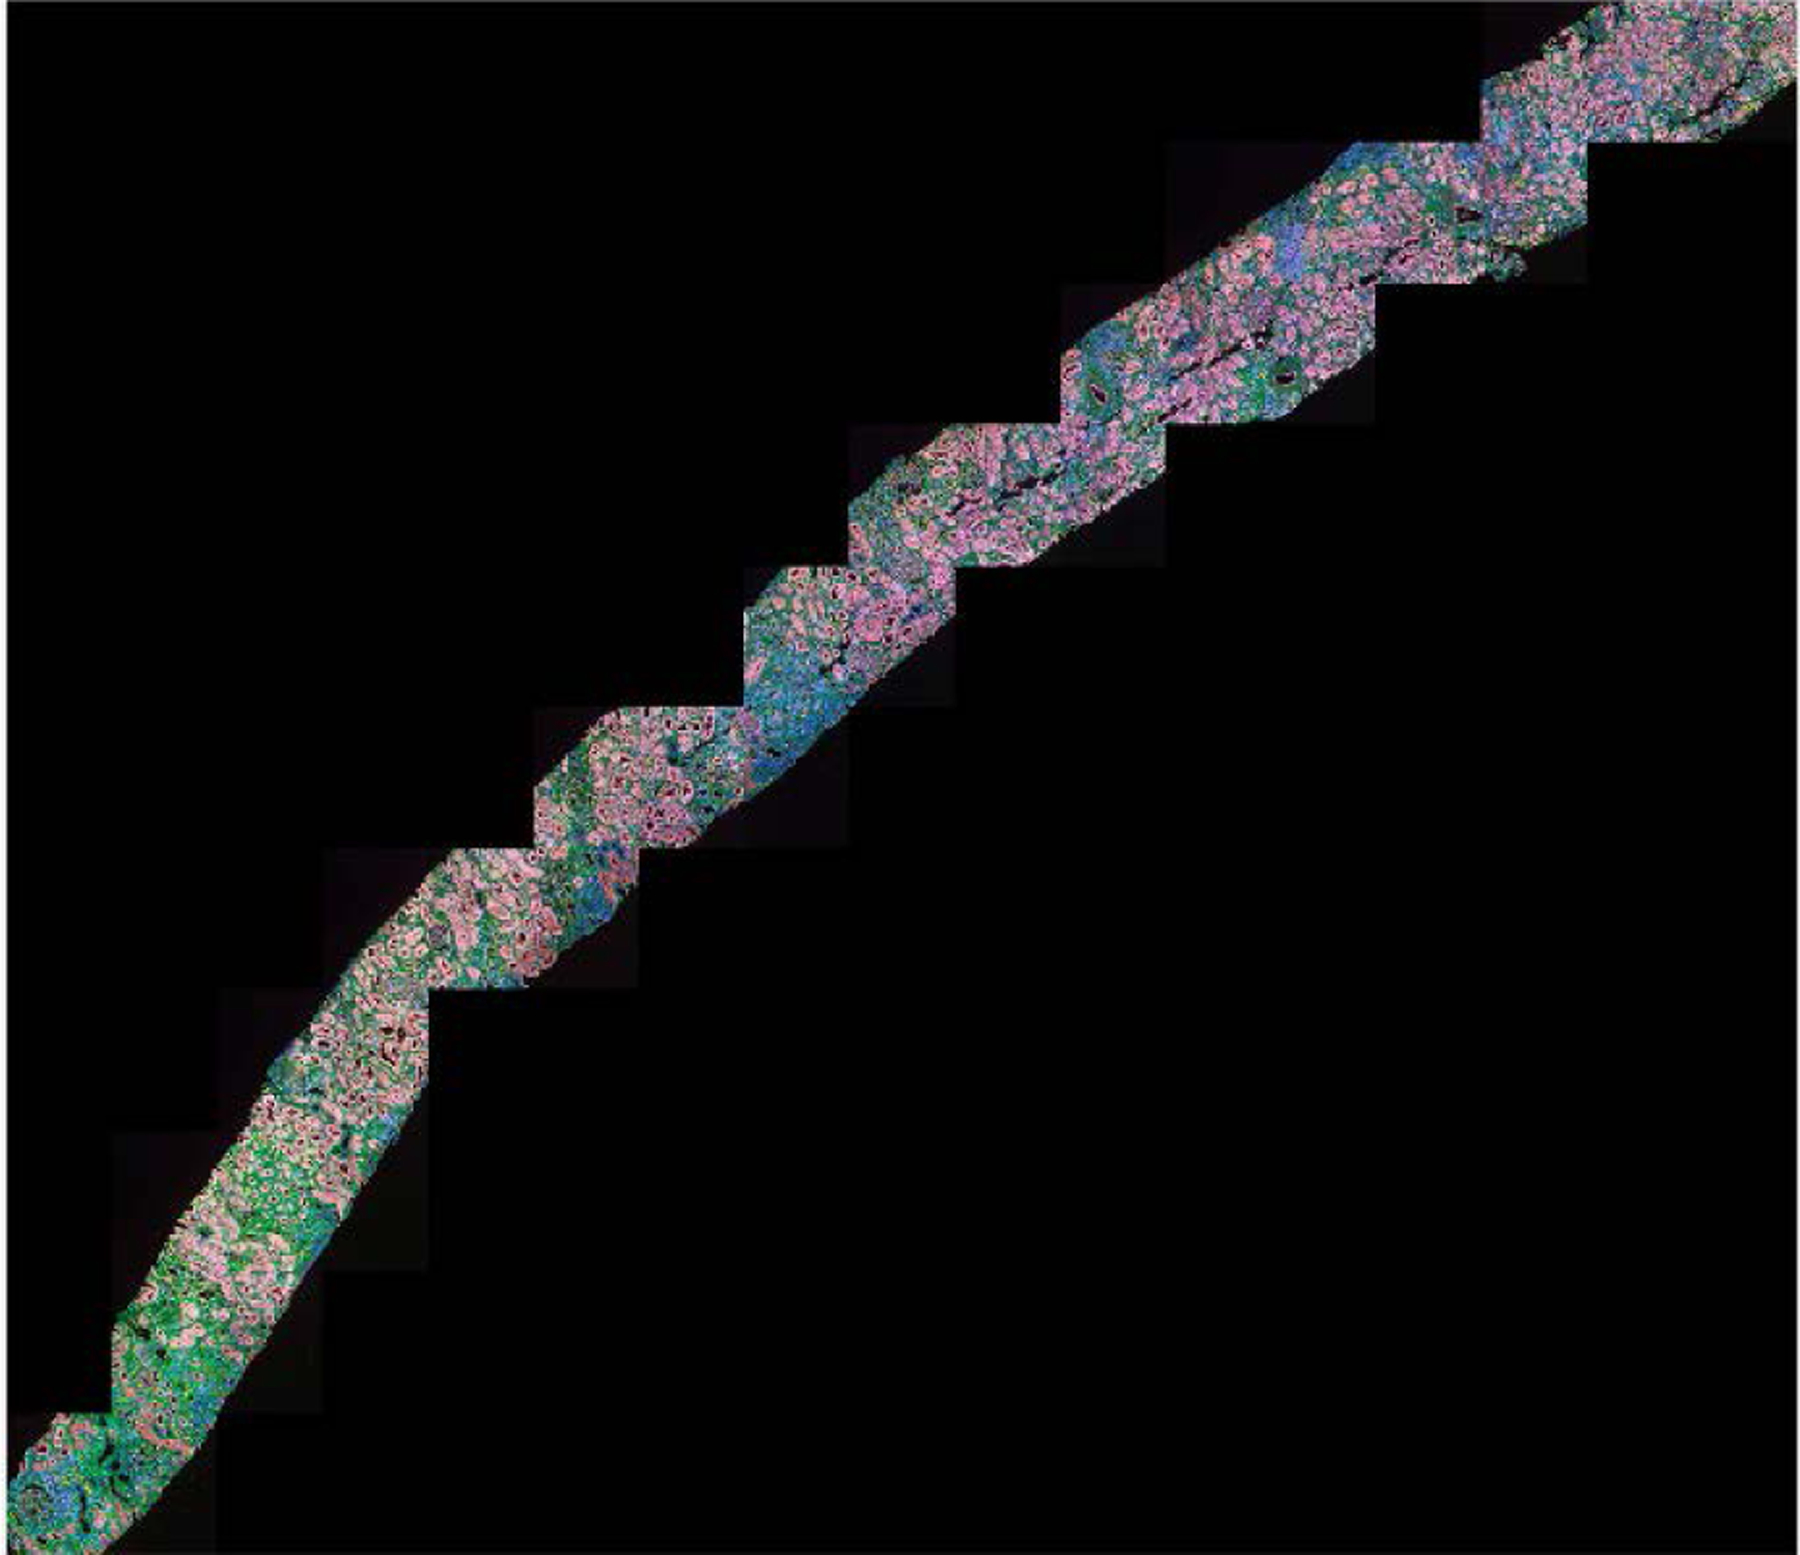
The first step toward preparing the data for training the pix2pix network is stitching. As discussed in Section 2.1, the fluorescence-stained image patches (Figure 1) of the transplant kidney biopsy tissue section were stitched together based on the available coordinates of each patch in order to generate a whole slide view of the tissue section. The coordinate locations were obtained from the imaging system. The results of this task (Figure 2) were evaluated based on the performance analysis of image registration of the fluorescence-stained images over the reference PAS-stained images, detailed below.
Figure 1: Fluorescence-based multiplex immunohistochemistry of six markers in renal cortex.

Type III collagen (green), leukocytes (white), endothelial cells (pink), distal tubules (yellow), proximal tubules (orange), and cell nuclei (blue) are shown.
Figure 2: Stitched fluorescence whole slide image.

Individual image patches from multiplex immunohistochemistry were stitched to create a whole slide image.
3.2. Image Registration:
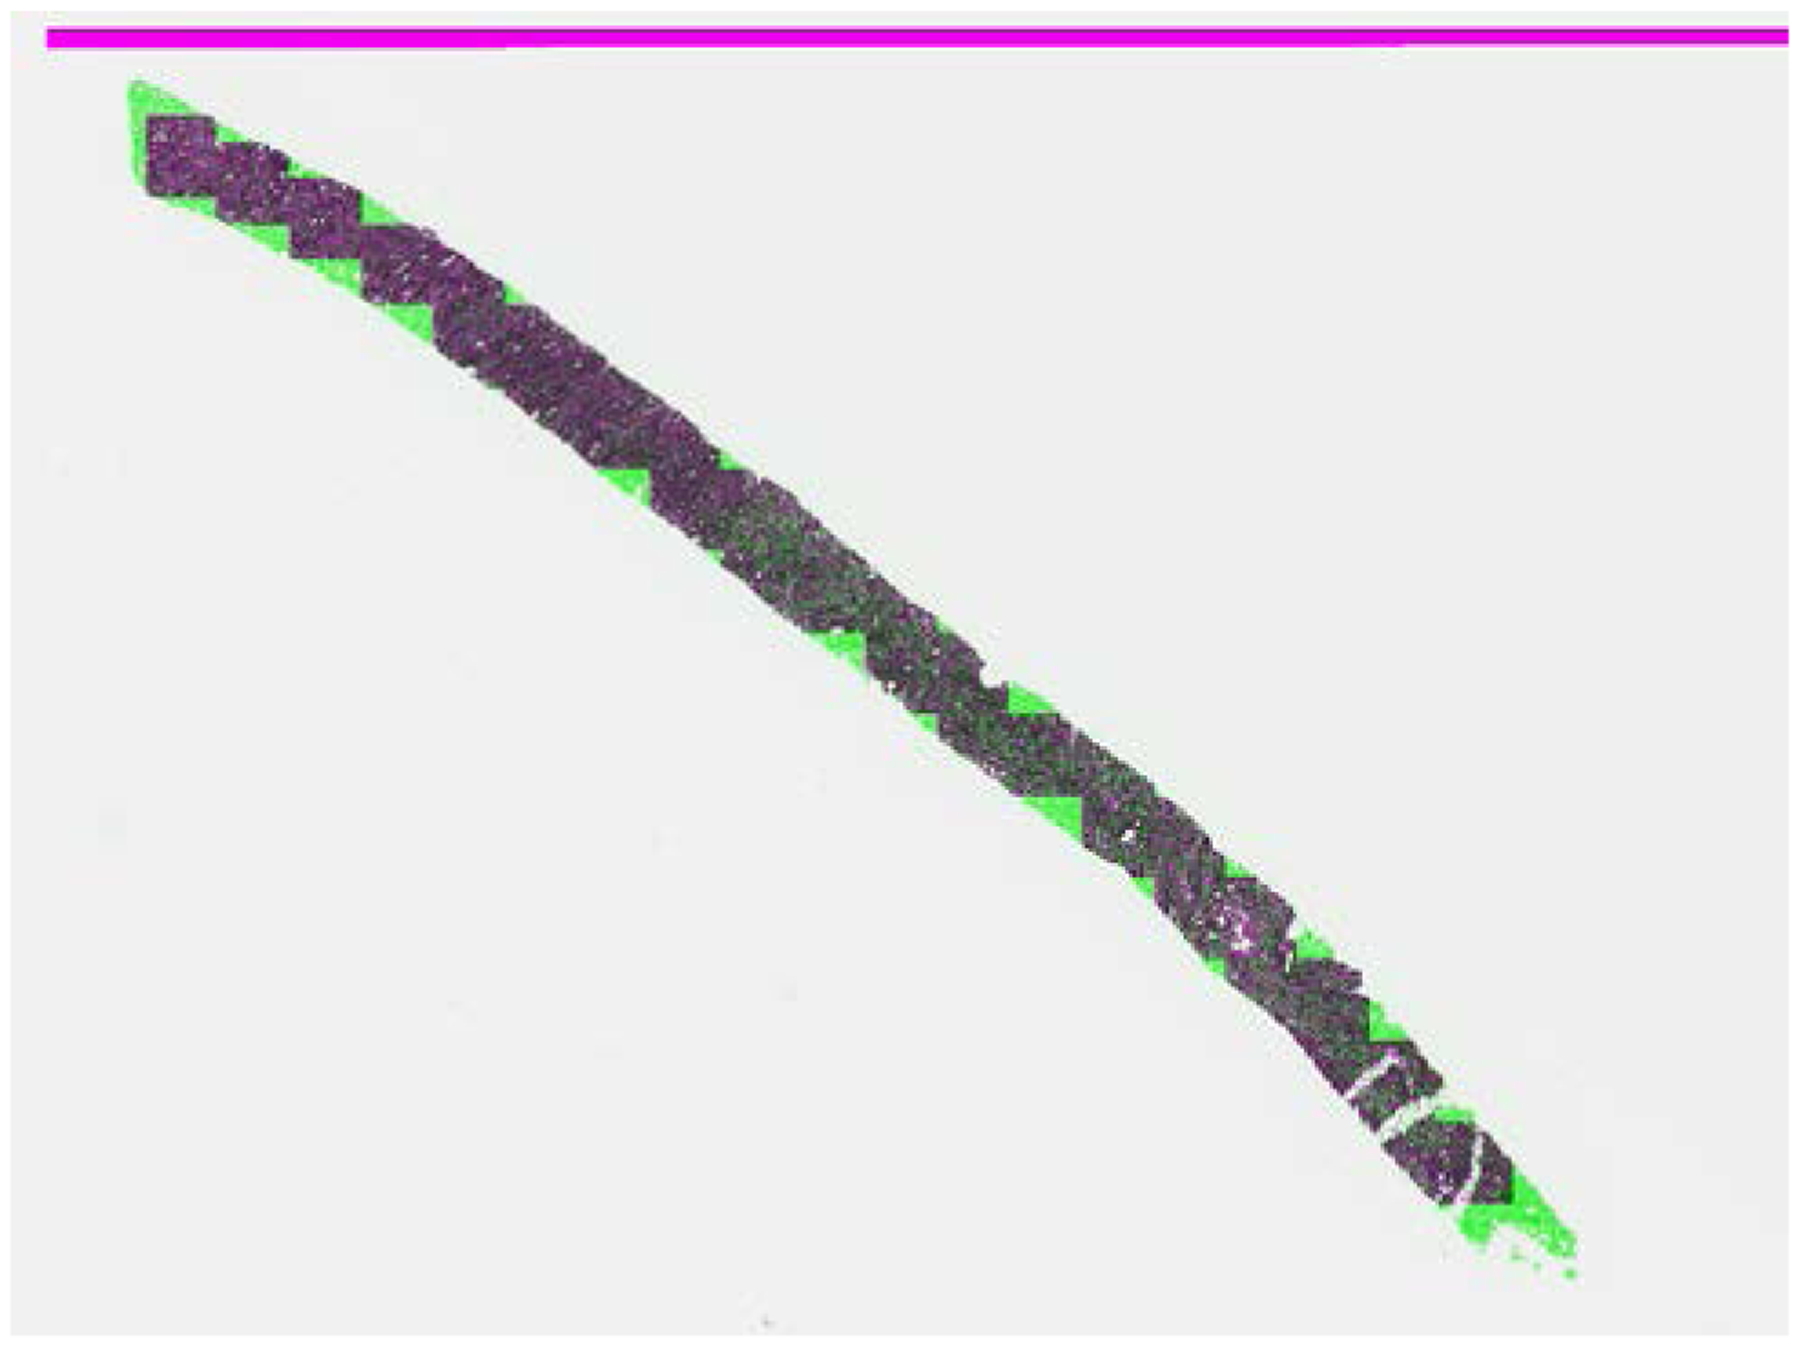
The stitching step was followed by image registration, where the control points from the reference image (PAS) and the image to be registered (fluorescence) were located, and the transformation matrix for warping was estimated. The registered image was qualitatively verified by overlaying it on the PAS reference image (Figure 3). The sensitivity, specificity, PPV, and NPV of the registration results are summarized in Table 1. Sensitivity ranged between approximately 80% to 92%, and specificity was more than 94%. These results indicate that the fluorescence WSI was well aligned/registered with respect to the reference PAS WSI.
Figure 3: Registered fluorescence-stained whole slide image overlaid on reference periodic acid-Schiff (PAS)-stained whole slide image.

The intensity differences are highlighted in green (PAS) and magenta (fluorescence).
TABLE 1:
Image registration performance analysis.
| Tissue case | Sensitivity | Specificity | PPV | NPV |
|---|---|---|---|---|
| 1 | 0.8837 | 0.9799 | 0.8061 | 0.9889 |
| 2 | 0.9166 | 0.9776 | 0.8084 | 0.9918 |
| 3 | 0.8644 | 0.9927 | 0.8011 | 0.9954 |
| 4 | 0.8633 | 0.9929 | 0.8608 | 0.9930 |
| 5 | 0.8127 | 0.9946 | 0.8893 | 0.9900 |
| 6 | 0.8512 | 0.9897 | 0.8547 | 0.9899 |
| 7 | 0.8743 | 0.9768 | 0.8868 | 0.9937 |
3.3. Image-to-image Translation:
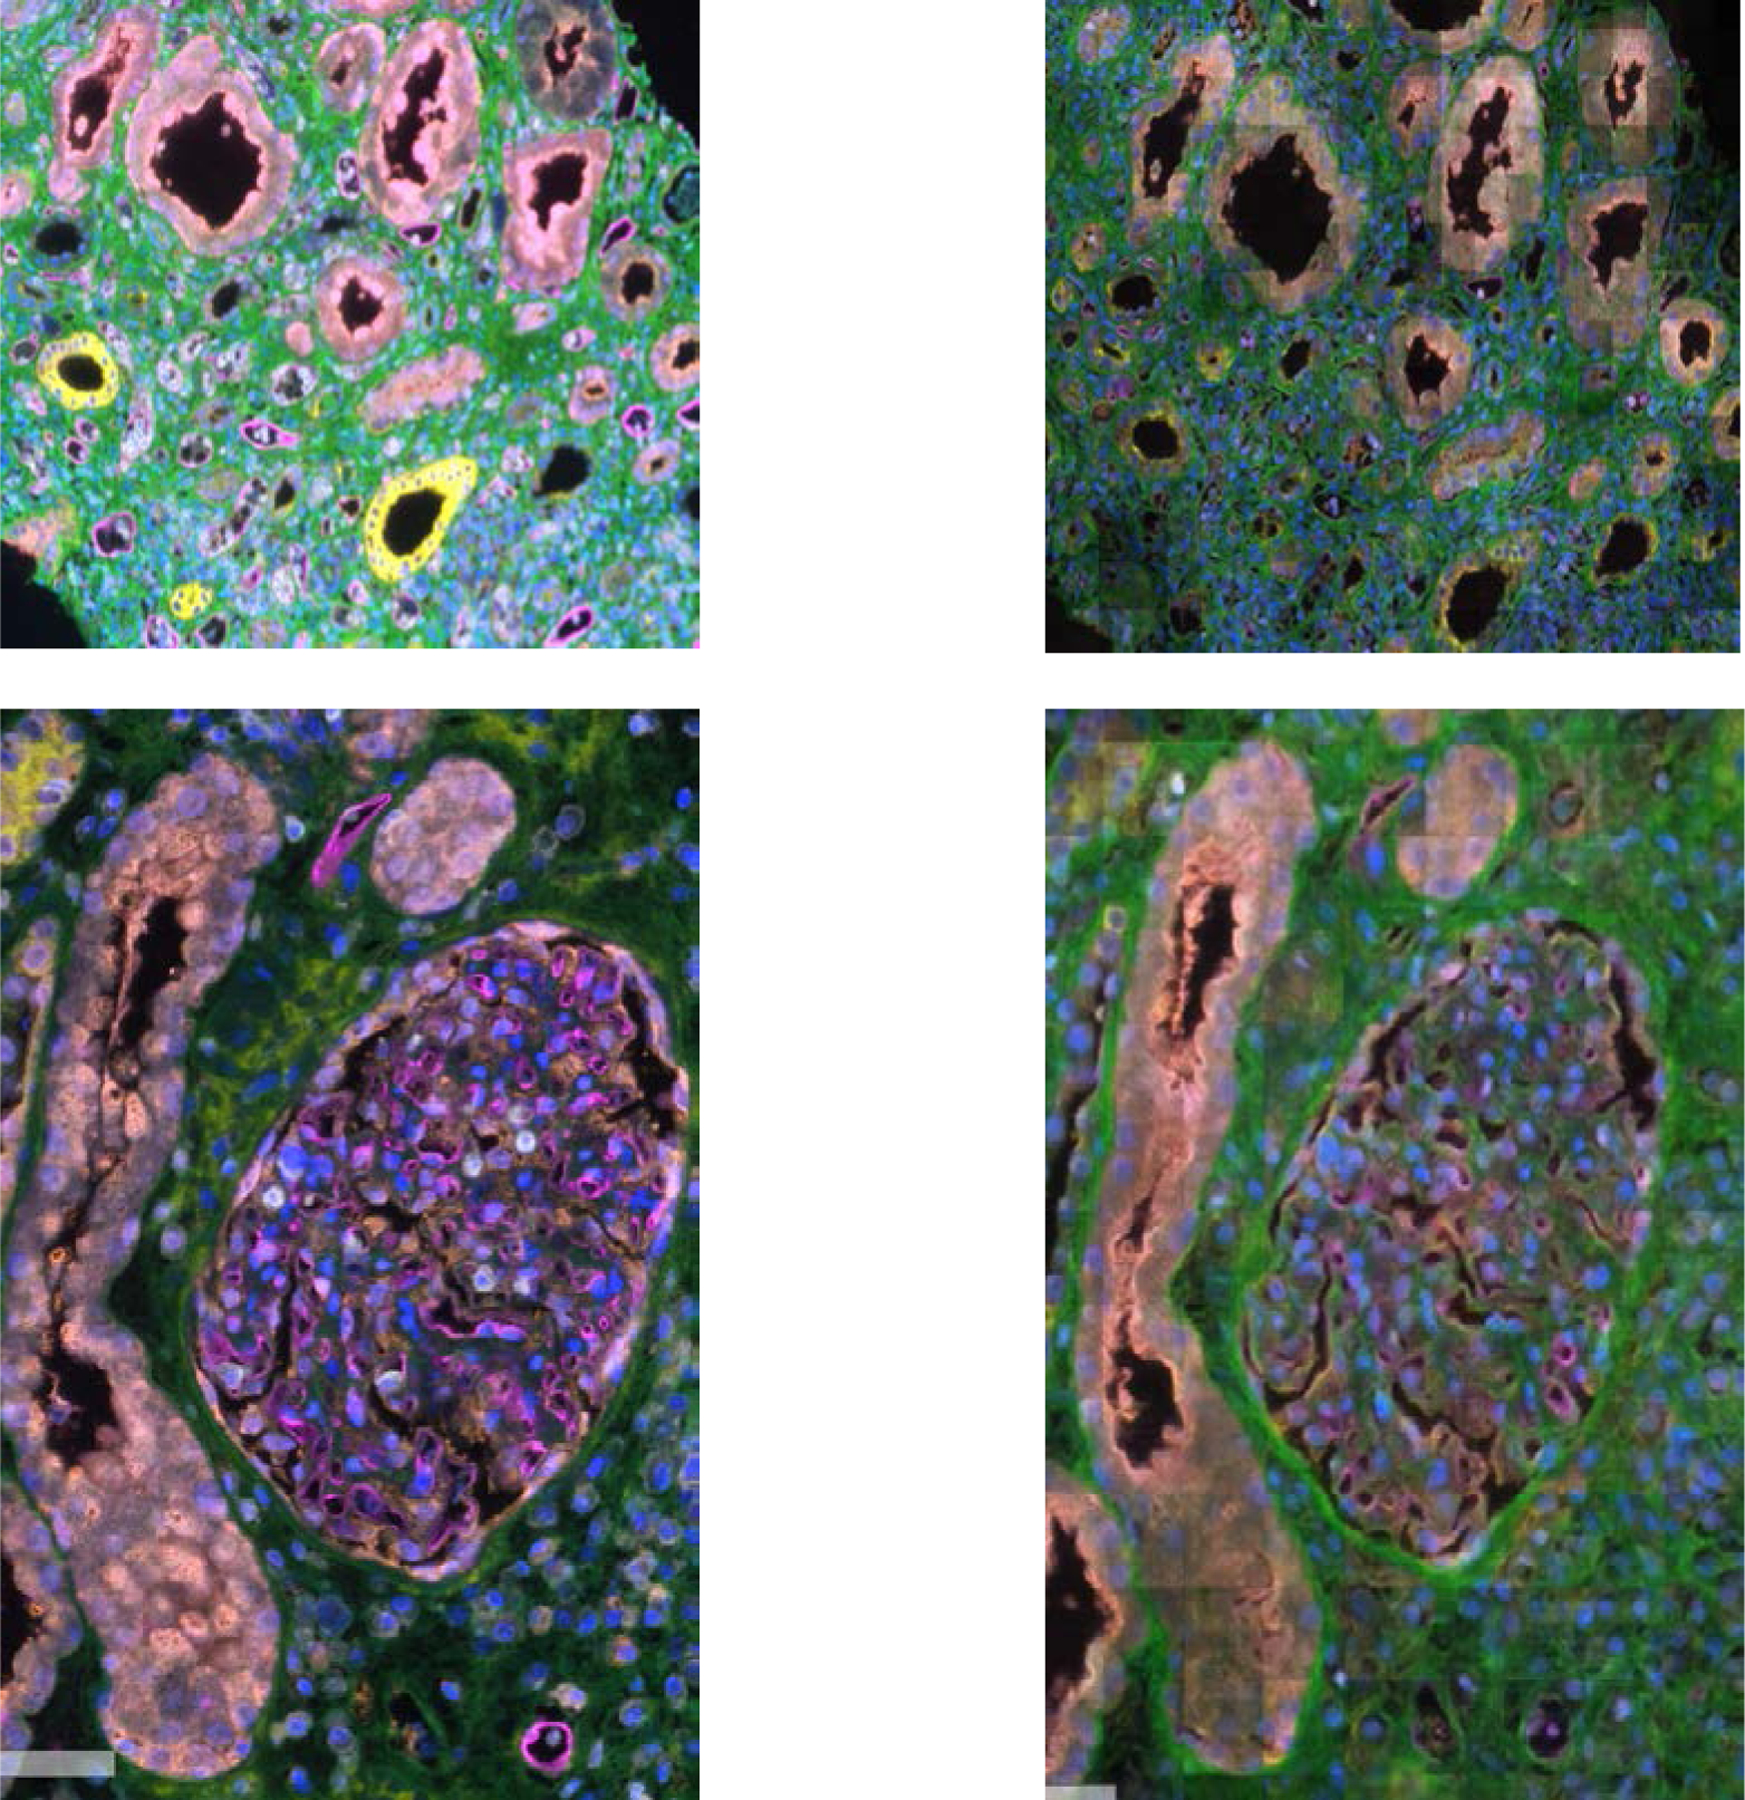
The network was trained with a set of 35312 paired patches that were extracted from PAS and fluorescence registered WSIs with a 50% overlap between each patch. The purpose of overlap was to expose the network to more variation in the edge, which makes the network learn better since the model is sensitive to the patch edges when training. Figure 4 shows generated in silico image patches from a test WSI, which mimics the original mIHC WSI.
Figure 4: In silico/synthetic multiplex immunohistochemistry (mIHC) images compared to their real counterparts.

The images on the left are from the real fluorescence mIHC WSI of test cases. The images on the right are the network predicted (i.e. in silico/synthetic) fluorescence mIHC images generated from PAS-stained WSI as network input.
4. CONCLUSION AND DISCUSSION
Our deep learning model appears to be able to faithfully generate in silico mIHC WSIs from PAS-stained WSIs, which ultimately indicates that the pipeline is able to detect histologic structures and cell types from PAS-stained WSIs. Further development and studies are required to translate the in silico mIHC images to annotations that can be used to specifically segment renal compartments and to recognize specific entities that are relevant to renal and transplant pathology in standard histochemically stained slides such as PAS-stained tissue sections.
REFERENCES
- 1.Tan WCC et al. Overview of multiplex immunohistochemistry/immunofluorescence techniques in the era of cancer immunotherapy. Cancer Commun (Lond) 40, 135–153, doi: 10.1002/cac2.12023 (2020). [DOI] [PMC free article] [PubMed] [Google Scholar]
- 2.Mori H & Cardiff RD Methods of Immunohistochemistry and Immunofluorescence: Converting Invisible to Visible. Methods Mol Biol 1458, 1–12, doi: 10.1007/978-1-4939-3801-8_1 (2016). [DOI] [PubMed] [Google Scholar]
- 3.Stack EC, Wang C, Roman KA & Hoyt CC Multiplexed immunohistochemistry, imaging, and quantitation: a review, with an assessment of Tyramide signal amplification, multispectral imaging and multiplex analysis. Methods 70, 46–58, doi: 10.1016/j.ymeth.2014.08.016 (2014). [DOI] [PubMed] [Google Scholar]
- 4.Mohammed HA “The Image Registration Techniques for Medical Imaging (MRI-CT)”. American Journal of Biomedical Engineering 6, 53–58, doi:doi: 10.5923/j.ajbe.20160602.02 (2016). [DOI] [Google Scholar]
- 5.Isola Phillip, Z. J-Y, Zhou Tinghui, Efros Alexei A.. in Proc. IEEE Conf. Computer Vision and Pattern Recognition 1125–1134 (2017). [DOI] [PMC free article] [PubMed] [Google Scholar]


