

Abstract
Background:
Pemphigus vulgaris (PV) is a rare autoimmune blistering disease characterized by intraepithelial and mucocutaneous blister formation and erosion. Numerous articles related to PV have been published. However, which articles have a tremendous influence is still unknown, and factors affecting article citation numbers remain unclear. We aimed to visualize the prominent entities using the top 100 most-cited articles on the topic of PV (T100PV), and investigate whether medical subject headings (i.e., MeSH terms) can be used to predict article citations.
Methods:
By searching the PubMed Central (PMC) database, the T100PV abstracts since 2011 were downloaded. Citation analysis was performed to compare the dominant entities in article topics, authors, and research institutes using social network analysis (SNA) and Kano diagrams. We examined the MeSH prediction power against article citations using correlation coefficients (CCs).
Results:
The most cited article (125 times) was authored by Ellebrecht from the University of Pennsylvania in the US. The most productive countries were Germany (28%) and the US (25%). Most articles were published in J Invest Dermatol (16%) and Br J Dermatol (10%). Kasperkiewicz (Germany) and the Normandie University (France) were the most cited authors and research institutes, respectively. The most frequently occurred MeSH terms were administration and dosage, immunology, and metabolism. MeSH terms were evident in the prediction power on the number of article citations (F = 19.77; P < .001).
Conclusion:
A breakthrough was achieved by developing dashboards to display the T100PV. MeSH terms can be used to predict the T100PV citations. These T100PV visualizations can be applied in future studies.
Keywords: bibliometric, citation analysis, correlation coefficient, medical subject heading, pemphigus vulgaris, social network analysis
1. Introduction
Pemphigus vulgaris (PV) is a rare autoimmune blistering skin disease characterized by flaccid blister formation and erosion of the skin and mucous membranes. It is the most common and severe type of pemphigus, accounting for 70% of all cases of pemphigus.[1] The incidence of PV is estimated to be between 0.1 and 0.5 per 100,000 people per year, with a higher incidence rate in some ethnic groups (Jewish ancestry, Middle East inhabitants).[2] Published guidelines for pemphigus therapy mainly rely on expert consensus. Systemic administration of corticosteroids is considered as the standard first-line therapy for pemphigus, and it can combine immunosuppressive drugs in moderate-to-severe patients or those who have an increased risk of prolonged corticosteroid use. Rituximab is a monoclonal anti-CD20 antibody that targets CD20 B cells, which has demonstrated efficacy in recalcitrant pemphigus. In recent years, the management of PV has been revolutionized with the development of novel biological agents, and this issue has been widely discussed.
Bibliometric method is a statistical tool that has been widely used to analyze published articles, offering an effective way to measure the scientific impact of publications by mathematical models and techniques in a particular field.[3] This type of analysis identifies countries, institutions, and authors who have the most prominent scientific contributions.[4,5] Citation counts usually indicate the interest of researchers in using articles referred to their own studies. Accordingly, bibliometric analysis can be used to demonstrate study hotspots and future trends in a specific disease or scientific field.[6,7]
Citation analysis has been used by many medical specialists to identify landmark literature in several medical fields, such as neurosurgery,[8,9] cardiovascular disease, urology,[10] and immune-related inflammatory diseases.[11] At present, bibliometric analysis has been applied to many fields in dermatology, such as rosacea[12] and psoriatic arthritis.[13] However, to our knowledge, no bibliometric analysis focusing on the topic of PV has been published. Through this study, we analyzed 100 top-cited articles on PV(T100PV) and aimed to visualize dominant entities with dynamic Google Maps dashboards, and investigate whether medical subject headings (MeSH terms) can be used to predict article citations.
2. Materials and methods
2.1. Data Source and Searching Strategy
A search of the PubMed Central (PMC) database on articles of PV published between 2011 and 2020 was performed on February 9, 2021. The search query was as follows: “pemphigus”[MeSH Terms] OR “pemphigus” OR (“pemphigus” AND “vulgaris”) OR “pemphigus vulgaris” (“2011”[Date - Publication]: “2020”[Date - Publication]) and (“pemphigus”[MeSH Terms] OR “pemphigus” OR (“pemphigus” AND “vulgaris”) OR “pemphigus vulgaris”). A total of 3078 abstracts were retrieved and downloaded, without limitations on languages or document types.
We reviewed the titles and abstracts of the articles to ensure that they were relevant to PV. Articles that focused on PV or research containing PV as the main component were included in this study. Articles that focused on other topics or only mentioned pemphigus as a small part were excluded.
On the basis of the article types with MeSH terms shown in PMC, we extracted the T100PV ranked by the number of citations in descending order.[14] Article titles, year of publication, journal of publication, total citation counts, author affiliated countries, article types, and topic categories were retrieved from the searching results. Figures and tables were used to demonstrate the above information and the predictive power of article citations related to MeSH terms. As all data were collected from a publicly available database, no ethical approval was required.
2.2. Data arrangement
We applied Visual Basic for Applications (VBA) modules in Microsoft Excel to arrange the downloaded abstracts and the T100PV articles. The contributors to the T100PV were examined using visual displays shown on the dashboards. The first authors affiliated countries/regions and journals were tabulated on publications and citations over the years from 2011 to 2020 with impact factors (IF = citations/publications in T100PV).
2.3. Visualization and dashboard
Social network analysis (SNA)[15,16] was applied to cluster different variables (including origin countries, journals, and MeSH terms) related to topic categories. Closer entities (e.g., MeSH terms) will appear in an identical subnetwork (or say cluster), while relevant MeSH terms are highlighted in the subnetwork.
In SNA, each MeSH term defined as an actor (or a vertex or node in SNA) earns the centrality degree (CD) computed by Equation (1):
| (1) |
where n denotes the number of articles and j is the number of MeSH terms in an article. For instance, if 6 MeSH terms are in an article, CD equals 0.83(=1/6∗(6–1)) when j (=total number of MeSH terms in an article) is 6. Similarly, CD = 0.5 when only 1 MeSH term exists; CD = 0.9 when 10 MeSH terms exist. The greater the number of cooccurrences that interact in a network, the higher the CD in the network.
In this study, citations were involved in CD to emphasize the dominant role determined by citations and cooccurrence frequency interacted with other MeSH terms using Eq. (2) with Ci denoted by the number of citations in article i.
| (2) |
The Kano model[16,17] was applied to draw diagrams including 3 parts based on an author-weighted scheme (AWS)[18] and author order in the article byline. The first earns the most credit (around 63%), followed by the corresponding authors (deemed as the last author with around 12% credit) and other middle authors with decreasing credits shared in the remaining weights. All summed weighted credits were equal to 1.0 in an article. Three parts in the Kano diagram are citation-oriented, neutral, and publication-oriented with bubbles in green, yellow, and red colors, respectively. All dashboards were designed on Google Maps, allowing our readers to manipulate the dashboard on their own to have a quick look for more detailed information in this study.
2.4. Prediction effect on article citations
The IFs of MeSH terms were computed based on equal-size proportions and citations in an article. The weighted scores yielded by MeSH weights (i.e., the number of citations per article) in each article were used to predict the original citations. The computation of the weighted MeSH citations is presented in Eq. (3).
| (3) |
2.5. Statistics
The correlation coefficient (CC) was used to determine the predictive power between the weighted MeSH terms and original article citations. The CC t-value was calculated using the following formula:=. A prediction equation was produced through simple regression analysis using the MedCalc statistical software, version 9.5.0.0 (MedCalc, New York, NY). The significance level was set at Type I error (0.05). The study process, data, and content are presented in Supplemental Digital Content 1.
3. Results
A total of 3078 publications were retrieved from the PubMed database between 2011 and 2020. The T100PV were listed with a link.[14] The total citation counts ranged from 14 to 125, as of February 9, 2021, in PMC, with a total of 2534 citations. The mean number of citations was 25.3 times.
3.1. The most productive countries/journals
The most productive countries in T100PV were Germany (28%), followed by the United States (25%). Most articles were published in J Invest Dermatol (16%) and Br J Dermatol (10%) (see Tables 1 and 2). The most cited countries and journals were France (=36.8) and PLos One (=29.6).
Table 1.
Distribution of publications and citations in T100.
| Country | 2011 | 2012 | 2013 | 2014 | 2015 | 2016 | 2017 | 2018 | 2019 | 2020 | n | Ci | IF | Rank |
| Africa | 1 | 1 | 15 | 15.00 | ||||||||||
| Egypt | 1 | 1 | 15 | 15.00 | ||||||||||
| Asia | 3 | 5 | 3 | 3 | 4 | 1 | 1 | 1 | 21 | 470 | 22.38 | |||
| Israel | 1 | 1 | 2 | 1 | 1 | 6 | 133 | 22.17 | ||||||
| Japan | 1 | 2 | 1 | 1 | 1 | 6 | 147 | 24.50 | ||||||
| China | 1 | 1 | 1 | 3 | 74 | 24.67 | ||||||||
| Taiwan | 1 | 1 | 2 | 40 | 20.00 | |||||||||
| Turkey | 1 | 1 | 2 | 44 | 22.00 | |||||||||
| India | 1 | 1 | 17 | 17.00 | ||||||||||
| Iran | 1 | 1 | 15 | 15.00 | ||||||||||
| Europe | 10 | 9 | 5 | 5 | 5 | 2 | 5 | 4 | 1 | 46 | 1213 | 26.37 | ||
| Germany | 8 | 5 | 2 | 2 | 4 | 1 | 3 | 2 | 1 | 28 | 725 | 25.89 | ||
| France | 1 | 1 | 1 | 1 | 1 | 5 | 184 | 36.80 | 1 | |||||
| Italy | 2 | 2 | 1 | 5 | 132 | 26.40 | 3 | |||||||
| Netherlands | 1 | 1 | 1 | 1 | 4 | 87 | 21.75 | |||||||
| U.K | 1 | 1 | 1 | 3 | 63 | 21.00 | ||||||||
| Switzerland | 1 | 1 | 22 | 22.00 | ||||||||||
| N. America | 2 | 5 | 3 | 5 | 4 | 5 | 1 | 1 | 26 | 707 | 27.19 | |||
| U.S | 2 | 5 | 3 | 4 | 4 | 5 | 1 | 1 | 25 | 691 | 27.64 | 2 | ||
| Canada | 1 | 1 | 16 | 16.00 | ||||||||||
| Oceania | 1 | 1 | 1 | 1 | 4 | 86 | 21.50 | |||||||
| Australia | 1 | 1 | 1 | 1 | 4 | 86 | 21.50 | |||||||
| S. America | 1 | 1 | 2 | 43 | 21.50 | |||||||||
| Brazil | 1 | 1 | 2 | 43 | 21.50 | |||||||||
| Total | 16 | 21 | 14 | 12 | 14 | 8 | 7 | 6 | 1 | 1 | 100 | 2534 | 25.34 |
Table 2.
Distribution of journals in publications and citations.
| Journal | 2011 | 2012 | 2013 | 2014 | 2015 | 2016 | 2017 | 2018 | 2019 | 2020 | n | Ci | IF |
| J Invest Dermatol | 2 | 4 | 3 | 3 | 2 | 1 | 1 | 16 | 383 | 23.94 | |||
| Br J Dermatol | 1 | 4 | 3 | 2 | 10 | 176 | 17.60 | ||||||
| Clin Dermatol | 1 | 3 | 2 | 6 | 116 | 19.33 | |||||||
| J Am Acad Dermatol | 2 | 1 | 1 | 1 | 5 | 117 | 23.40 | ||||||
| PLoS One | 2 | 2 | 1 | 5 | 148 | 29.60 | |||||||
| Front Immunol | 3 | 1 | 4 | 68 | 17.00 | ||||||||
| J Dtsch Dermatol Ges | 2 | 2 | 4 | 105 | 26.25 | ||||||||
| Am J Pathol | 2 | 1 | 3 | 52 | 17.33 | ||||||||
| Autoimmun Rev | 1 | 2 | 3 | 68 | 22.67 | ||||||||
| J Biol Chem | 1 | 1 | 1 | 3 | 79 | 26.33 | |||||||
| Others | 4 | 7 | 8 | 5 | 5 | 6 | 4 | 2 | 0 | 0 | 41 | 1222 | 29.80 |
| Total | 16 | 21 | 14 | 12 | 14 | 8 | 7 | 6 | 1 | 1 | 100 | 2534 | 25.34 |
3.2. The most cited article and authors
The most cited article with 125 citations was authored by Ellebrecht from the Department of Dermatology, University of Pennsylvania, Philadelphia, PA.[19] The most cited authors and research institutions were Kasperkiewicz (Germany), Joly (France), and Normandie University (France), Keio University School of Medicine (Japan) (see Figs. 1 and 2). Bubbles were sized by the mean weighted citations (=citations/citable articles=impact factor). Three colors in the Kano diagrams include green, yellow, and red, representing citation-oriented, neutral, and publication-oriented, respectively.
Figure 1.
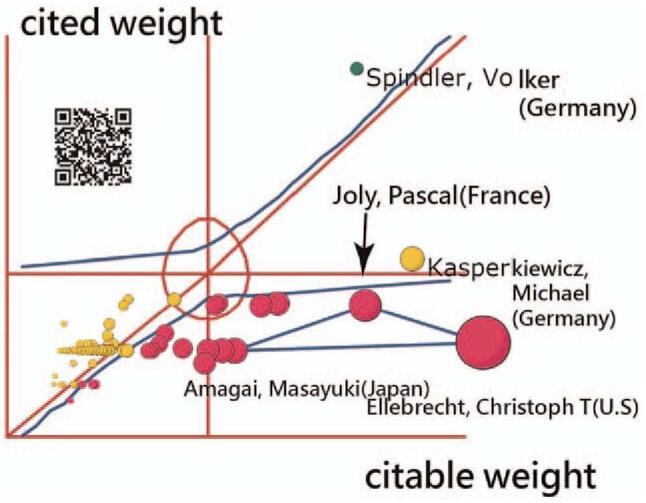
The 100 top-cited authors on a Kano diagram displayed on Google Map. Note. bubbles size simplifies the impact factor (=citations/ citable articles).
Figure 2.
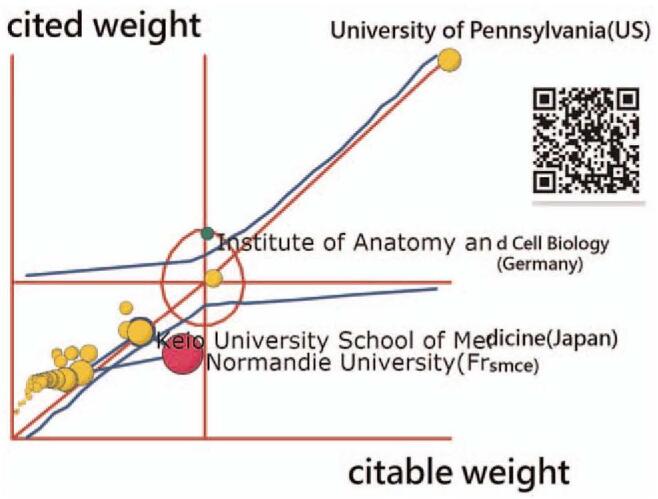
The 100 top-cited research institutes on the topic of PV shown on a dashboard. Note. bubbles size denotes the impact factor (=citations/ citable articles).
3.3. The most cited MeSH terms and the prediction power on T100PV
Through the citation analysis, 5 topic categories with MeSH terms were clustered, as shown in Figure 3. The top 3 topics with the highest number of MeSH weights for predicting article citations were administration and dosage (30.5), followed by immunology (27.87) and metabolism (20.83), as shown in Figure 3.
Figure 3.

Cluster analysis of MeSH terms. Note. Five topic categories with MeSH terms were clustered. The top 3 with higher number of MeSH weights linked by three red triangular lines.
After using the MeSH weights to associate with article citations based on the scheme of equal weight in article (i.e., different AWS based on author order[18]), MeSH terms are evident in the predictive power of the number of article citations (CC = 0.41, t = 4.45; n = 100 (Fig. 4). The regression equation is defined as article citation (y) = y = -5.4479 + 1.2996 × weight (x) of MeSH terms. The slope coefficient was statistically significant (F = 19.77; P < .001), as shown in Figure 4.
Figure 4.
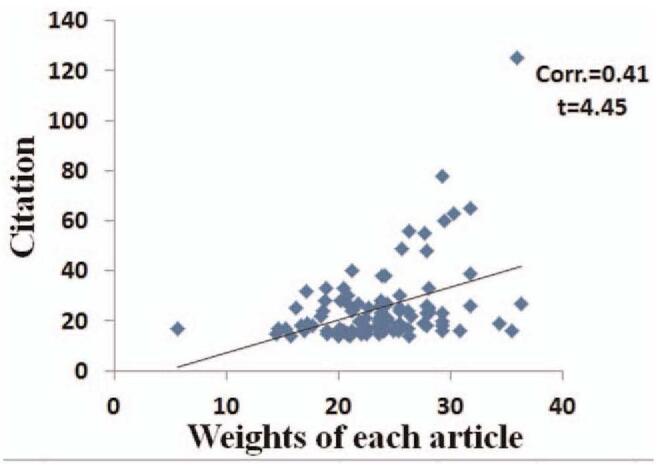
Using MeSH weights to predict article citations. Note. the number of citations in the 100 top-cited articles are predicted by the weights of MeSH terms with the equation: y = -5.4479 + 1.2996 × weight (x), F = 19.77; p < 0.001, The CC is 0.41, t = 4.45.
3.4. Online dashboards shown on Google maps
All dashboards in the figures would appear once the QR code is clicked on the links.[20–22] Readers are advised to examine the details of each entity's information.
4. Discussion
Bibliometric analysis explores the characteristics of previously published articles based on specific and reliable parameters, which provides physicians with important quantitative information for analyzing trends and primary research concern in certain fields.[23,24] In this study, we conducted a bibliometric analysis and identified the T100PV, focusing on PV and related subtopics published between 2011 and 2020 in PMC. Our study establishes a prediction model using MeSH terms to predict the number of citations based on the 100 top-cited articles downloaded from the PMC. We found that the prediction model can provide information about which MeSH terms with higher weights (i.e., the prediction power) related to the article receiving the most citation counts. Such a model offers a way to recognize the influence of recent work and the value of the articles.
4.1. Dominant countries and journals on PV
According to our study results, the majority of articles included originated from Europe(n = 46) and there was one quarter of articles from the United States(n = 25). This is in accordance with previous bibliometric studies, where Europe and the United States dominate the production of scientific publications.
Previous studies clearly indicated that the incidence of PV varies by region, which is more common in Jews and people of Mediterranean descent. Therefore, it was not surprising that European countries had the largest literature and share of publications on the topic of PV. In addition, the United States ranked second. The United States is indeed the leading country in terms of medical research productivity. It has a strong influence on research in the health sciences; this can be attributed to the substantial financial support given to research in that country and a vast number of research institutions in the United States.[25]
In our bibliometric analysis, we discovered that the majority of 100 top-cited articles on PV were published in the Journal of Investigative Dermatology (16%), followed by the British Journal of Dermatology (10%). These journals are generally the top journals in the field of dermatology. This could be explained by the inherent bias that researchers tended to select articles in high-impact factor journals for citation in their research.[13]
4.2. Three most-cited articles
The top-ranked article entitled “Reengineering chimeric antigen receptor T cells for targeted therapy of autoimmune disease” was authored by Ellebrecht et al,[19] which was published in 2016. It was cited 125 times. Due to the rarity of PV, there is no international consensus regarding the treatment strategy for PV. This article provides an innovative and effective therapeutic strategy for PV, which is called chimeric autoantibody receptor T cell or CAAR-T therapy. This novel target therapy demonstrated specific targeting of autoreactive B cells in antibody-mediated autoimmune disease, which further avoided the risks of generalized immunosuppression. This study sheds light on potential future treatment strategies for this disease, and thus frequently cited in many studies.
The second-ranked article was authored by Pascal Joly et al[26] and titled “First-line rituximab combined with short-term prednisone versus prednisone alone for the treatment of pemphigus (Ritux 3): a prospective, multicentre, parallel-group, open-label randomised trial,” which was published in 2017. It was cited 78 times. This article is the first trial comparing high doses of corticosteroids alone with Rituximab as well as low-dose and short-term corticosteroid use in patients with newly diagnosed moderate to severe pemphigus. It showed superior rates of complete remission off prednisone at month 24 in the Rituximab-treated group (89% vs 34%). This study was a pivotal clinical trial making Rituximab as the first biological agent approved by the U.S. Food and Drug Administration for moderate to severe PV patients. This is why this article had been cited in many studies.
The third-ranked article was authored by Michael Kasperkiewicz et al[27] and titled “Pemphigus,” which was published in 2017. It was cited 65 times. In this study, the pathophysiology, clinical features, and treatment options for PV were reviewed. This article provides an update on the basic clinical research and therapeutic aspects of this autoimmune mediated blistering disease.
4.3. Strengths and limitations
The strength of this study is that MeSH terms were classified into research topics using SNA displaying dashboards on Google Maps, which highlighted the most dominant entities in which the PV authors were interested. Readers can manipulate the links[20–22] independently to better understand the association between the entities the authors are concerned with in this study. In addition, applying MeSH terms to predict the number of article citations is a useful and viable way to identify the most dominant research topic in the field of PV, which will help future academic pursuits in the field of dermatology. The research approach used in this study has the potential to be applied to other topics or disciplines.
However, there are still some limitations in this study. First, we used only a single database to extract the top-100 articles. The results of this study might be different if the articles were retrieved from other major citation databases, such as Scopus, Web of Science, and Embase.
Second, the authors used total citations as the measurement of impact as of February 9, 2021. Total citation counts were significantly associated with the age of the article. The older the articles, the more citations they may receive from citing articles. The most recently published articles are at a disadvantage in terms of the number of citations owing to the time effect.
Third, citation count does not directly reflect the quality of an article, but enables a quantitative evaluation of the scientific impact of an article in a designated field.[28] Thus, although citation statistics have been frequently criticized, analyses of citation rates provide current academic development in a certain field and may offer a historical perspective on its scientific progress.
Fourth, the number of article citations might be affected by several extrinsic factors, such as journal impact factors and authors’ achievements. Using MeSH terms to predict future citation counts based on T100PV might have some limitations and bias. More factors should be considered to reach a more valid prediction in the future.
Fifth, there were only 3 articles having a huge number of citations described with possible reasons in Discussion section due to space limitations. Readers are invited to read other articles in detail on PubMed by clicking on the link[14] we collected in this study.
Finally, dashboards in Figures are shown on Google Maps.[20–22] These installments are not free of charge because the Google Maps application programming interface (API) requires a paid project key for the Google cloud platform. Thus, the limitations of the dashboard are that it is not publicly accessible, and it is difficult for other authors to mimic for use in a short period of time. Nonetheless, the process of making dashboards with MP4 video using Microsoft Excel[29] is provided in Supplemental Digital Content 1 that helps readers apply the procedures to other topics, not just limited to the PV as we did in this study.
5. Conclusion
Germany and the US occupied the dominant places on the PV topic between 2011 and 2020, accounting for 28% and 25%, respectively. Most articles were published in J Invest Dermatol (16%) and Br J Dermatol (10%). The most frequently occurred MeSH terms were administration and dosage, immunology, and metabolism. MeSH terms can be used for predicting the number of article citations (F = 19.77; P < .001).
Our study made a breakthrough to report the characteristics of the T100PV by using SNA displaying dashboards on Google Maps and provided a deep insight into the T100PV, in which most articles focused on the biological and immunopathogenesis of PV and thereby provided physicians with a better understanding of treatment targets on this autoantibody mediated skin disorder.
We suggest using similar approaches to identify the most dominant entities in article topics, authors, and research institutes using SNA and Kano diagrams. Researchers are encouraged to exploit the characteristics and spot bursts on other topics in the future using bibliometric analysis, not just limited to the PV in dermatology.
Acknowledgments
We thank Enago (www.enago.tw) for the English language revision.
Author contributions
TWC developed concept and design of the study. TYY, CHC analyzed and interpreted the data. FJL monitored the process of this study and helped in responding to the reviewers’ advice and comments. TYY, CHC drafted the manuscript, and all authors provided critical revisions for important intellectual content. The study was supervised by FJL. All authors have read and approved the final manuscript.
Methodology: Tsair-Wei Chien.
Writing – original draft: Ting-Ya Yang, Chieh-Hsun Chen.
Writing – review & editing: Chieh-Hsun Chen, Tsair-Wei Chien, Feng-Jie Lai.
Supplementary Material
Footnotes
Abbreviations: AWS = author-weighted scheme, CC = correlation coefficient, CD = centrality degree, MeSH = medical subject headings, PV = Pemphigus vulgaris, PMC = PubMed Central, SNA = social network analysis, T100PV = top 100 most-cited articles on the topic of pemphigus vulgaris, VBA = visual basic for application.
How to cite this article: Yang TY, Chen CH, Chien TW, Lai FJ. Predicting the number of article citations on the topic of pemphigus vulgaris with the 100 top-cited articles since 2011: a bibliometric analysis. Medicine. 2021;100:31(e26806).
This research received no external funding.
All data were deposited in Supplemental Digital Content 1.
The funders had no role of the study design; in the collection, analyses, or interpretation of data; in the writing of the manuscript, or in the decision to publish the results.
The authors have no conflicts of interest.
Resource of data, Excel modules, Pajek file, and MP4 videos involved in this study at https://osf.io/s9hcv/?view_only=3751313024c44351871368a81197556d
All data generated or analyzed during this study are included in this published article [and its supplementary information files]. The datasets generated during and/or analyzed during the current study are publicly available.
Supplemental digital content is available for this article.
Note. IF=Ci/n.
IF=Ci/n.
References
- [1].Porro AM, Hans Filho G, Santi CG. Consensus on the treatment of autoimmune bullous dermatoses: pemphigus vulgaris and pemphigus foliaceus - Brazilian Society of Dermatology. An Bras Dermatol 2019;94: 2 Suppl 1: 20–32. [DOI] [PMC free article] [PubMed] [Google Scholar]
- [2].Venugopal SS, Murrell DF. Diagnosis and clinical features of pemphigus vulgaris. Dermatol Clin 2011;29:373–80. [DOI] [PubMed] [Google Scholar]
- [3].lakeman K. Bibliometrics in a digital age: help or hindrance. Sci Prog 2018;101:293–310. [DOI] [PMC free article] [PubMed] [Google Scholar]
- [4].Hirsch JE. An index to quantify an individual's scientific research output. Proc Natl Acad Sci U S A 2005;102:16569–72. [DOI] [PMC free article] [PubMed] [Google Scholar]
- [5].Ahmad P, Dummer P, Noorani T, Asif J. The top 50 most-cited articles published in the International Endodontic Journal. Int Endod J 2019;52:803–18. [DOI] [PubMed] [Google Scholar]
- [6].Chen C, Hu Z, Liu S, Tseng H. Emerging trends in regenerative medicine: a scientometric analysis incitespace. Expert Opin Biol Ther 2012;12:593–608. [DOI] [PubMed] [Google Scholar]
- [7].Wang CY, Li BH, Ma LL, et al. The top-100 highly cited original articles on drug therapy for ventilator-associated pneumonia. Front Pharmacol 2019;10:108. [DOI] [PMC free article] [PubMed] [Google Scholar]
- [8].Almutairi O, Albakr A, Al-Habib A, Ajlan A. The top-100 most-cited articles on meningioma. World Neurosurg 2017;107:1025–32. e5. [DOI] [PubMed] [Google Scholar]
- [9].Nasir SAR, Gilani JA, Fatima K, Faheem U, Kazmi O, Siddiqi J, et al. Top 100 most-cited articles on spontaneous intracerebral hemorrhage: a bibliometric analysis. World Neurosurg 2018;110:445–9. e6. [DOI] [PubMed] [Google Scholar]
- [10].Nason GJ, Tareen F, Mortell AJCUAJ. The top 100 cited articles in urology: an update. Can Urol Assoc J 2013;7:E16. [DOI] [PMC free article] [PubMed] [Google Scholar]
- [11].Yin X, Cheng F, Wang X, Mu J, Ma C, Zhai C, et al. Top 100 cited articles on rheumatoid arthritis: a bibliometric analysis. Medicine (Baltimore) 2019;98:e14523. [DOI] [PMC free article] [PubMed] [Google Scholar]
- [12].Wang Y, Zhang H, Fang R, Tang K, Sun Q. The top 100 most cited articles in rosacea: a bibliometric analysis. J Eur Acad Dermatol Venereol 2020;34:2177–82. [DOI] [PubMed] [Google Scholar]
- [13].Berlinberg A, Bilal J, Riaz IB, Kurtzman DJB. The 100 top-cited publications in psoriatic arthritis: a bibliometric analysis. Int J Dermatol 2019;58:1023–34. [DOI] [PubMed] [Google Scholar]
- [14].Chien TW. Top 100 Articles in this Study. Available at: http://www.healthup.org.tw/html100/pemphigus100.htm. Accessed February 8, 2021. [Google Scholar]
- [15].Chien TW, Chang Y, Wang HY. Understanding the productive author who published papers in medicine using National Health Insurance Database: a systematic review and meta-analysis. Medicine (Baltimore) 2018;97:e9967. [DOI] [PMC free article] [PubMed] [Google Scholar]
- [16].Kan WC, Chou W, Chien TW, Yeh YT, Chou PH. The most-cited authors who published papers in JMIR mHealth and uHealth using the authorship-weighted scheme: bibliometric analysis. JMIR Mhealth Uhealth 2020;8:e11567. [DOI] [PMC free article] [PubMed] [Google Scholar]
- [17].Lin CH, Chou PH, Chou W, Chien TW. Using the Kano model to display the most cited authors and affiliated countries in schizophrenia research. Schizophr Res 2020;216:422–8. [DOI] [PubMed] [Google Scholar]
- [18].Chien TW, Wang HY, Lai FJ. Applying an author-weighted scheme to identify the most influential countries in research achievements on skin cancer: observational study. JMIR Dermatol 2019;2:e11015. [Google Scholar]
- [19].Ellebrecht CT, Bhoj VG, Nace A, et al. Reengineering chimeric antigen receptor T cells for targeted therapy of autoimmune disease. Science 2016;353:179–84. [DOI] [PMC free article] [PubMed] [Google Scholar]
- [20].Chien TW. Figure 1 in this study. Available at: http://www.healthup.org.tw/gps/PVskinkanoau.htm. Accessed July 8, 2021. [Google Scholar]
- [21].Chien TW. Figure 2 in this study. Available at: http://www.healthup.org.tw/gps/PVskinkanoins.htm. Accessed July 8, 2021 [Google Scholar]
- [22].Chien TW. Figure 3 in this study. Available at: http://www.healthup.org.tw/gps/PVskinmesh.htm. Accessed July 8, 2021 [Google Scholar]
- [23].Glänzel W, Moed HF. Journal impact measures in bibliometric research. Scientometrics 2002;53:171–93. [Google Scholar]
- [24].Mingers J, Leydesdorff L. A review of theory and practice in scientometrics. Eur J Oper Res 2015;246:01–19. [Google Scholar]
- [25].Pena-Cristóbal M, Diniz-Freitas M, Monteiro L, Diz Dios P, Warnakulasuriya S. The 100 most cited articles on oral cancer. J Oral Pathol Med 2018;47:333–44. [DOI] [PubMed] [Google Scholar]
- [26].Joly P, Maho-Vaillant M, Prost-Squarcioni C, et al. French study group on autoimmune bullous skin diseases. First-line rituximab combined with short-term prednisone versus prednisone alone for the treatment of pemphigus (Ritux 3): a prospective, multicentre, parallel-group, open-label randomised trial. Lancet 2017;389:2031–40. [DOI] [PubMed] [Google Scholar]
- [27].Kasperkiewicz M, Ellebrecht CT, Takahashi H, et al. Pemphigus. Nat Rev Dis Primers 2017;3:17026. [DOI] [PMC free article] [PubMed] [Google Scholar]
- [28].Zhu XP, Ban Z. Citation Count Prediction Based on Academic Network Features, in 2018 IEEE 32nd International Conference on Advanced Information Networking and Applications (AINA); 2018. 534–541, doi:10.1109/AINA.2018.00084. [Google Scholar]
- [29].Persson O. Analyzing bibliographic data to visualize representations. Available at: https://homepage.univie.ac.at/juan.gorraiz/bibexcel/index.html%3ffbclid=IwAR0FCL3Tjjmx2XyUI_ZKxfv12DYTGhGsStmU-MKzOECxQ2kJEglfouO_2aQ?fbclid=IwAR2SMJF-pnZ7dRDXzy8VgqPW0fzMZ0CIyGDNmtVPtsnDVOABx7WqfHTgyNE. Accessed December 20, 2021 [Google Scholar]
Associated Data
This section collects any data citations, data availability statements, or supplementary materials included in this article.