

Abstract
Pain sensitization leading to polyalgia can be observed during infectious diseases. The blood pressure cuff-evoked pain threshold (BPCEPT) has been used in previous studies as a screening tool for fibromyalgia.
We aimed to use the BPCEPT as a screening test for detecting pain sensitization in patients suffering from infectious diseases. We also investigated whether specific factors were associated with pain sensitization.
We performed a prospective comparative study including all patients of our infectious diseases center in a 1-year period. We created a positive control group of patients suffering from fibromyalgia and a negative control group of “apparently healthy” patients consulting for vaccination.
The blood pressure (BP) cuff was inflated until the patient signaled that they experienced pain, and this pressure value was noted.
A total of 2355 patients were included. The positive control group had significantly lower values of the BPCEPT than all other groups. Among hospitalized patients with infectious diseases, a low BPCEPT was significantly associated with high temperature (P < .0001), older age (P = .002), being a woman (P = .004), high serum glutamic-oxaloacetic transaminase (P = .007), and high C reactive protein levels (P = .02). Moreover, in multivariate analysis, respiratory infection, meningitis, urinary tract infection, febrile neutropenia, and Q fever were independently associated with a low BPCEPT. A significant negative dynamic correlation between the BPCEPT and temperature was also observed (P < .001).
We demonstrated for the first time in a large sample of patients that the BPCEPT method can be used to detect pain susceptibility. We observed a significant dynamic correlation between pain sensitization and temperature. Additionally, pain sensitization was associated with some diseases, suggesting that they trigger pain sensitivity.
Keywords: blood pressure cuff, fibromyalgia, infectious diseases, pain
1. Introduction
In the field of infectious diseases, pain can be observed because of organic injuries involving muscles, bones, and nerves. Additionally, recent studies (in vitro and in animal models) have shown that some bacteria, viruses, and fungi directly activated nociceptor neurons at the site of the infection[1,2] and that this phenomenon played a role in the host response. Another type of nonspecific pain is observed during the acute phase of infectious diseases, which mainly involves joints, muscles, or headaches and is frequently associated with fatigue.[1] During some acute infections, physicians have observed that nonspecific non-lesional pain presented by patients was comparable to that of fibromyalgia patients. This observation suggests that there are a similarities between polyalgia in acute infectious diseases and fibromyalgia, which is defined as chronic general musculoskeletal pain without identified lesions.[3] For infectious diseases, in 2014, Wegner et al[4] found that the injection of LPS in healthy volunteers resulted in an increase in cytokine levels, body temperature, pressure pain thresholds, mechanical pain sensitivity, and cold pain sensitivity compared with placebo. Musculoskeletal pain sensitization measures can be performed with a digital algometer that applies gradually increasing pressure on the skin with 1 kg of force per square centimeter. A simpler way to evaluate musculoskeletal pain sensitization is assessment with a sphygmomanometer or the blood pressure-cuff evoked pain threshold (BPCEPT), which does not require specific equipment.[5–8] This test involves inflating the cuff at a rate of 10 mm Hg per second to a maximum value (between 180 and 220 mm Hg) and asking the patient to state when the cuff pressure induces pain. This method has only been tested in patients with fibromyalgia to date. A significantly lower BPCEPT was found in fibromyalgia patients than patients with other causes of chronic rheumatologic pain and controls.[5–8]
Our aim was to use the BPCEPT to detect increased pain susceptibility in patients hospitalized for infectious diseases in “real-life conditions.” For this purpose, we created a positive control group composed of fibromyalgia patients and a negative control group composed of “apparently healthy” patients who were seen at our center for vaccination. We then tested patients who were seen or hospitalized at infectious diseases wards in the IHU Mediterrannée Infection. Additionally, we investigated whether specific risk factors were associated with increased pain susceptibility in patients hospitalized for infections.
2. Materials and methods
2.1. Infectious disease (ID) patients
This study was conducted by the “IHU Méditerrannée Infection” at La Timone Hospital in Marseille, France, between November 2018 and November 2019. We included all adults who were at least 18 years old who consulted or were hospitalized at our center. We included patients in 3 infectious disease departments: the acute infectious diseases unit (patients transferred from the emergency unit), the chronic infectious diseases unit, and the contagious infectious diseases unit. We also included patients from the consultation unit and the day hospital.
2.2. Positive and negative control groups
We included a positive control group composed of patients suffering from fibromyalgia hospitalized at la Phoceane, a private hospital located in Marseille, which specialized in the care of patients with chronic pain and fibromyalgia. We tested a negative control group composed of “apparently healthy” patients who were seen at the International Vaccination Center of the IHU Mediterranée Infection.
We excluded people without a good understanding of French or medical conditions that prevented the expression of verbal consent and/or pain. For each patient, the following variables were collected: age, sex, temperature, and diagnosis. Temperature data and the BPCEPT were collected each day of hospitalization. The following blood sample analyses were also performed at day 1 of hospitalization: C-reactive protein (CRP), lactate dehydrogenase (LDH), creatine phosphokinase (CPK); liver enzymes (serum glutamic-oxaloacetic transaminase [SGOT] and serum glutamate pyruvate transaminase [SGPT]), creatinine, hemoglobin, platelet counts, and WBC counts. Fever was defined as a body temperature ≥38 °C.
2.3. Ethical statement
This study was approved by a Committee for the protection of persons under file number CPP 2019T3-10.
2.4. Methods
The following question was asked to each patient as a part of routine care: “When I take your blood pressure, tell me when the cuff's pressure causes pain.” The blood pressure cuff was inflated until the patient signaled that they experienced pain. If no pain was reported or if pain was reported at the maximum pressure of 240 mm Hg, this value was noted. To assess the reproducibility of the BPCEPT method, the measurement was repeated at least 2 times for each patient by 2 different nurses. The BPCEPT was measured during each day of hospitalization for inpatients. For hospitalized patients, we collected age, sex, temperature, diagnosis class, and biological data (SGOT, SGPT, creatinine, lactate dehydrogenase, CPK, CRP, hemoglobin, platelet counts, and WBC counts).
2.5. Statistical analysis
Statistical analyses were performed using SPSS software 22 (IBM, Paris, France). For patients who had several BPCEPT measurements, the first measurement was chosen for comparative statistical analysis. We performed principal component analysis to explore the relationship between BPCET and other variables. BPCET means were compared between groups of patients using Analysis of variance (ANOVA) and post-hoc analysis. Then we performed univariate analysis and linear regression for multivariate analysis for quantitative variables in the group of hospitalized patients. Variables for which the significance of the correlation was <0.2 in univariate analysis were included in multivariate analysis. To study relationship between the BPCEPT and temperature (covariate), we performed multivariate mixed-effects model analysis using SPSS software 22.
3. Results
3.1. Description and comparison of the different groups of patients
A total of 2355 patients were included in this study (88 in the positive control group, 112 in the negative control group, 157 outpatients, 842 in the day hospital, and 1156 hospitalized patients). In the positive control group of patients suffering from fibromyalgia, patients had a mean duration of hospitalization of 7 days, resulting in a total of 704 measurements of the BPCEPT. The mean BPCEPT in the fibromyalgia group was 145.06 mm Hg (±31), with a maximum value of 200 mm Hg and a minimum value of 60 mm Hg (Fig. 1, Table 1); 112 people were included in the negative control group, resulting in 314 measurements. The mean BPCEPT was 239.19 (±6), with a maximum value of 240 mm Hg and a minimum value of 180 mm Hg (Fig. 1, Table 1); 157 outpatients were included, resulting in 314 measurements. The mean BPCEPT in this group was 237.9 mm Hg (±12), with a minimum value of 140 mm Hg and a maximum value of 240 mm Hg (Fig. 1); 842 patients (37% women, mean age 50) were included from the day hospital, resulting in 1037 measurements. The mean BPCEPT in this group was 237.3 mm Hg (±8.21), with a minimum value of 140 mm Hg and a maximum value of 240 mm Hg (Fig. 1).
Figure 1.
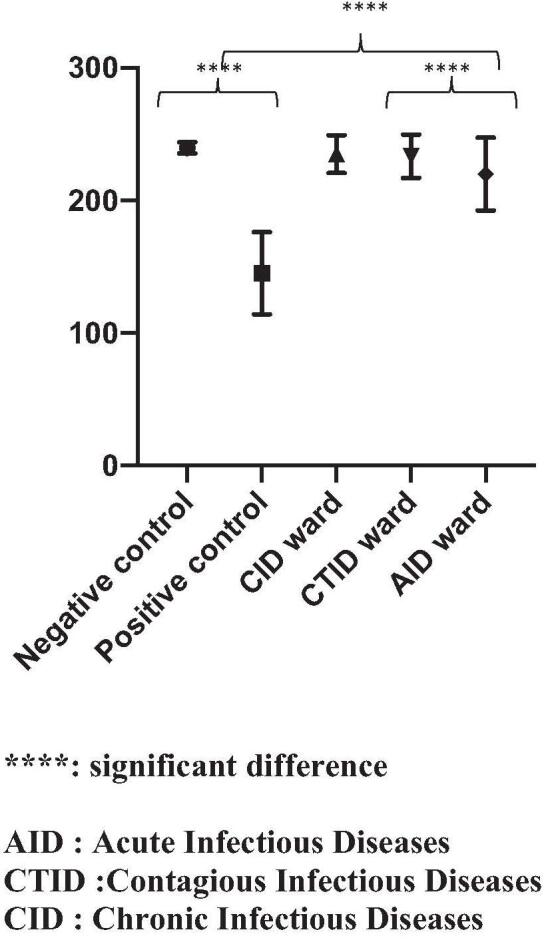
Comparison of the means of the BPCEPT between the different groups of patients. BPCEPT = blood pressure cuff-evoked pain threshold.
Table 1.
Comparison of the mean value of the BPCEPT in groups of patients (ANOVA and post hoc analysis).
| Group of patients | Mean of the BPCEPT | Std deviation | 95% confidence interval lower/upper | P∗ | ||
| Positive control (88) | 145 | 31 | 142–147 | P < .0001 | ||
| Negative control (112) | 239 | 4 | 239–240 | REF | ||
| Acute infectious diseases ward (642) | 228 | 25 | 226–230 | P < .0001 | ||
| Chronic infectious diseases ward (240) | 235 | 14 | 233–237 | P < .0001 | ||
| Contagious infectious diseases ward (274) | 234 | 16 | 232–236 | P = .5 |
| Sums of squares | df | Mean square | F | Sig | ||
| Between groups | 4,295,893.087 | 7 | 613,699.012 | 1,252.638 | 0.00 | |
| Within groups | 18,116,153.595 | 3.707 | 489.925 | |||
| Total | 6,112,046.683 | 3.714 |
A total of 240 patients (43% women, mean age 62) were included from the chronic infectious diseases ward, resulting in 1325 measurements of the BPCEPT. The mean BPCEPT in this group was 235 mm Hg (±12), with a minimum value of 140 mm Hg and a maximum value at 240 mm Hg (Fig. 1, Table 1); 642 (47% of women, mean age 61) were included from the acute infectious diseases ward, resulting in 2867 measures of BPCEPT. The mean BPCEPT in this group was 228 mm Hg (±25), with a minimum value of 110 mm Hg and a maximum value of 240 mm Hg (Fig. 1, Table 1); 274 patients (44% women, mean age 61) were included from the contagious infectious diseases ward, resulting in 1720 measurements. The mean BPCEPT in this group was 234 mm Hg (±15), with a minimum value of 150 mm Hg and a maximum value of 240 mm Hg (Fig. 1, Table 1).
The mean values of the BPCEPT of the different units were compared using a one-way ANOVA (P < .001). The positive and negative control groups were compared, and the difference was statistically significant (P < .0001) (Table 1, Fig. 1). Moreover, the BPCEPT of patients from the acute infectious diseases ward was significantly lower than that of the negative control group and chronic and contagious infectious diseases groups (P < .0001) (Fig. 1).
3.2. Variables associated with a lower BPCEPT
Among 1156 hospitalized patients, the most frequent diagnosis was sepsis (14%), followed by osteoarticular infections (13%) and respiratory infections (11%) (supplementary data 3, Supplemental Digital Content). Biological variables are listed in supplementary data 1, Supplemental Digital Content.
Forty-six percent of patients were women, with a mean age of 61, and 122 patients were febrile at least once during their stay in the hospital. The mean temperature in our sample of patients was 36.7 °C (±0.78), with a minimum value of 34 °C and a maximum value of 39.6 °C. For patients who had several BPCEPT measurements, the first measurement was chosen for comparative statistical analysis.
The mean BPCEPT was significantly lower in women (193 mm Hg vs 231 mm Hg, P = .005) and febrile patients (206 mm Hg vs 221 mm Hg, P < .001) (Fig. 2). We subsequently analyzed variables that could be associated with a low pain threshold in hospitalized patients.
Figure 2.

Comparison of mean values of BPCEPT between men and women and febrile and apyretic patients. BPCEPT = blood pressure cuff-evoked pain threshold.
We performed an exploratory analysis with principal component analysis (supplementary data 2, Supplemental Digital Content) that resulted in 3 dimensions, with the BPCEPT appearing to be more closely related to diagnosis class, temperature, and CPK levels.
In univariate analysis, a low BPCEPT was significantly correlated with high temperature (P < .0001), older age (P = .002), sex (P = .004), high SGOT and CRP levels (P = .007, P = .02), and diagnosis class (P = .004) (Table 2). When analyzing diagnosis class separately, a low BPCEPT was significantly correlated with respiratory infections (P < .0001), urinary tract infection (P = .025), meningitis (P = .001), febrile neutropenia (P = .036), and Q fever (P = .009) (Table 2). However, CPK levels were not significantly associated with a low BPCEPT (P = .8), so it was not included in multivariate analysis.
Table 2.
Univariate analysis of variables associated with a low BPCEPT.
| BPCEPT | ||
| Clinical data | B | P value |
| Temperature | −5.8 | <.0001 |
| Sex | −3.7 | .004 |
| Age | −0.1 | .002 |
| Diagnosis class | 0.5 | .004 |
| Respiratory infection | −12.1 | <.0001 |
| UTI | −4.8 | .03 |
| Meningitis | −18.6 | .001 |
| Febrile neutropenia | −14.6 | .04 |
| Q fever | −23.3 | .009 |
| Biological data | ||
| SGOT | −0.2 | .007 |
| SGPT | −0.006 | .4 |
| CPK | 0 | .8 |
| LDH | −0.006 | .2 |
| Creatinine | −0.008 | .4 |
| CRP | −0.016 | .02 |
| Hb | 0.054 | .06 |
| Platelets | −0.009 | .06 |
| WBC | −0.128 | .29 |
In multivariate linear regression analysis, the factors that were independently associated with a low BPCEPT were age, sex, temperature, SGOT levels, respiratory infection, meningitis, urinary tract infection, febrile neutropenia, and Q fever (Table 3).
Table 3.
Multivariate analysis of variables with linear regression.
| BPCEPT | ||||
| B | 95% CI | P value | ||
| Lower bound | Upper bound | |||
| Temperature | −6.12 | −7.9 | −4.3 | <.0001 |
| Age | −0.11 | −0.2 | −0.05 | .001 |
| Sex ∗1=man | −4 | −6 | −1 | .004 |
| SGOT | −0.014 | −0.03 | −0.004 | .007 |
| Respiratory infection ∗1=yes | −14.2 | −19.2 | −9.2 | <.0001 |
| Meningitis ∗1=yes | −23.6 | −34 | −6.7 | <.0001 |
| UTI∗1=yes | −5.8 | −10 | −1 | .013 |
| Febrile Neutropenia∗1=yes | −21 | −35 | −7 | .004 |
| Q fever∗1=yes | −23 | −40 | −6 | .012 |
| Diagnosis class∗∗ | −0.3 | −0.7 | 0.092 | .13 |
| CRP∗1=yes | −0.011 | −0.025 | 0.003 | .12 |
3.3. Kinetics of temperature and the BPCEPT
We used a longitudinal statistical method to account for repeated correlations in data in patients who were febrile during hospitalization. These data were available for 108 patients, with a mean number of measurements of 3.88. The mixed-effects model showed a significant negative correlation between the BPCEPT and temperature. The mean decrease in the BPCEPT was 2.33 units as the temperature increased by one unit (P < .001). Consequently, it is possible to predict the variation in the BPCEPT with the following equation: BPCEPT = 319.36 – (2.33∗temperature).
4. Discussion
To our knowledge, this is the first study investigating whether the BPCEPT can detect increased pain susceptibility in this important sample of patients (n = 2355). This tool was confirmed to be very discriminating in patients with fibromyalgia, as our fibromyalgia patients all had values under 200 mm Hg, which was very significantly different from negative controls and individuals in all other groups (Fig. 1, and Table 1). Additionally, for people who were seen at the vaccination ward who did not complain of any symptoms, values were all close to 240 mm Hg, showing that the test can very accurately detect the absence of pain sensitivity (Fig. 1 and Table 1). Thus, our results confirm our hypothesis that the BPCEPT is a very simple and efficient screening test for detecting increased pain susceptibility in patients hospitalized for infectious diseases in “real-life conditions.” We believe that this could become a new test that could be added to current clinical practices. The possible limitations of this method in clinical practice are mainly in elderly patients with cognitive impairment and communication disabilities who cannot understand the oral instructions of the test, and this population was not analyzed in our study.
Our second important result was that the lowest mean values of the BPCEPT (Fig. 1 and Table 1) were observed in acutely ill infection patients. This was the first clinical demonstration that some acute infectious diseases are associated with increased pain sensitivity, as is observed in fibromyalgia.[9] Conversely, the mean BPCEPT in the chronic infectious diseases ward was not significantly different from that in the controls. This may be explained by the fact that patients hospitalized in the chronic infectious diseases ward are mainly patients with osteoarticular infections and long-term prescriptions of pain killers, which may have increased their pain threshold.
We subsequently analyzed which factors were associated with a low BPCEPT. Being a woman was associated with a lower pain threshold. This association has already been described in a previous study of 98 healthy people (50 women) with cuff pressure pain detection.[10] Globally, several clinical and epidemiological studies have reported that women experience greater levels of pain than men and have higher rates of pain-related disorders.[11] However, the pathophysiological and sociocultural mechanisms of this phenomenon have not yet been elucidated. We also showed that age was associated with pain susceptibility in our study, and this result has already been reported in the literature regarding pressure hyperalgesia in patients with osteoarthritis, for example.[12]
Our third main result was that temperature and pain susceptibility were correlated. This correlation was observed in a transversal analysis but also in a longitudinal analysis with a clear dynamic correlation between temperature increases and pain susceptibility, as measured by the BPCEPT. To our knowledge, no other study has investigated this association before in patients in “real-life” conditions.
Additionally, some diagnoses were particularly associated with increased pain susceptibility, such as respiratory infections (including influenza, a disease characterized by arthromyalgia), urinary tract infections, meningitis, febrile neutropenia, and Q fever (Table 3). This result suggests that some infectious diseases trigger pain sensitivity. Moreover, the fact that the BPCEPT was not correlated with CPK levels illustrates that pain sensitization is not related to muscular lesions.
This observation should help clinicians and infectious disease teams to more effectively detect and prevent pain in similar clinical situations. Additionally, in the field of infectious diseases, some acute infections, such as EBV primary infection, Q fever,[13,14] or Lyme disease,[15] are associated with post-infectious chronic fatigue syndrome. Further studies could analyze whether acute infectious diseases leading to pain susceptibility during the acute phase are more likely to be followed by chronic fatigue syndrome, other functional disorders or prolonged convalescence. The BPCEPT could be a predictor of such phenomena in this setting.
In conclusion, we believe that the BPCEPT should become a part of routine clinical examinations, at least in the infectious diseases ward and that it may be a critical test for treating pain and predicting post-infectious syndromes.
Acknowledgments
The authors thank Marion Bechet and all the paramedical staff of the hospital who performed the BPCEPT.
Author contributions
Conceptualization: Didier Raoult.
Data curation: Christophe Soriano, Jean-Christophe Lagier, Frédérique Gouriet.
Formal analysis: Carole Eldin, Line Meddeb, Laurent Boyer.
Investigation: Sophia Boudjema, Christophe Soriano, Frédérique Gouriet.
Resources: Frédérique Gouriet.
Software: Laurent Boyer.
Supervision: Laurent Boyer, Philippe Parola, Jean-Christophe Lagier, Andreas Stein, Philippe Gautret, Matthieu Million.
Writing – original draft: Carole Eldin.
Writing – review & editing: Laurent Boyer, Jean-Christophe Lagier, Matthieu Million, Didier Raoult.
Supplementary Material
Footnotes
Abbreviations: BP = blood pressure, BPCEPT = blood pressure cuff-evoked pain threshold, CPK = creatine phosphokinase, CRP = C reactive protein, ID = infectious disease, LPS = lipopolysaccharide, SGOT = serum glutamic-oxaloacetic transaminase, WBC = white blood cell.
How to cite this article: Eldin C, Boudjema S, Meddeb L, Boyer L, Soriano C, Parola P, Lagier JC, Stein A, Gouriet F, Gautret P, Million M, Raoult D. Evaluation of pain susceptibility by taking blood pressure in patients with infections: a prospective comparative study. Medicine. 2021;100:31(e26511).
This study was supported by the IHU Méditerranée Infection, the National Research Agency under the programme “Investissements d’avenir” (Reference ANR-10-AHU-03) the Region Provence Alpes Côte d’Azur and European funding FEDER PIRMI.
The authors have no conflicts of interest to disclose.
The datasets generated during and/or analyzed during the current study are not publicly available, but are available from the corresponding author on reasonable request.
Supplemental digital content is available for this article.
BPCEPT = blood pressure cuff-evoked pain threshold.
Significant comparisons only are listed in Table 1.
BPCEPT = blood pressure cuff-evoked pain threshold, CPK = creatine phosphokinase, CRP = C reactive protein, Hb = hemoglobin, LDH = lactate dehydrogenase, SGOT = serum glutamic-oxaloacetic transaminase, SGPT = serum glutamate pyruvate transaminase, UTI = urinary tract infection, WBC = white blood cells.
Model formula: BPCEPT = 474.6 + Temperature∗(–6.12) + Age∗(–0.11) + Sex∗(–4) + SGOT∗(–0.014) + Respiratory Infection∗(–14.2) + Meningitis∗(–23.6) + UTI∗(–5.8) + Febrile Neutropenia∗(–21) + Q fever∗(–23).
BPCEPT = blood pressure cuff-evoked pain threshold, CRP = C reactive protein, SGOT = serum glutamic-oxaloacetic transaminase, UTI = urinary tract infection.
Diagnosis class was coded as a categorical variable with each diagnosis class coded from 0 to 16.
References
- [1].Baral P, Udit S, Chiu IM. Pain and immunity: implications for host defence. Nat Rev Immunol 2019;19:433–47. [DOI] [PMC free article] [PubMed] [Google Scholar]
- [2].Chiu IM, Pinho-Ribeiro FA, Woolf CJ. Pain and infection: pathogen detection by nociceptors. Pain 2016;157:1192–3. [DOI] [PMC free article] [PubMed] [Google Scholar]
- [3].Ranque-Garnier S, Eldin C, Sault C, Raoult D, Donnet A. Management of patients presenting with generalized musculoskeletal pain and a suspicion of Lyme disease. Med Mal Infect 2019;49:157–66. [DOI] [PubMed] [Google Scholar]
- [4].Wegner A, Elsenbruch S, Maluck J, et al. Inflammation-induced hyperalgesia: effects of timing, dosage, and negative affect on somatic pain sensitivity in human experimental endotoxemia. Brain Behav Immun 2014;41:46–54. [DOI] [PubMed] [Google Scholar]
- [5].Chandran AB, Coon CD, Martin SA, McLeod LD, Coles TM, Arnold LM. Sphygmomanometry-evoked allodynia in chronic pain patients with and without fibromyalgia. Nurs Res 2012;61:363–8. [DOI] [PubMed] [Google Scholar]
- [6].Eisinger J. [Clinical evaluation of fibromyalgia]. Rev Med Interne 2003;24:237–42. [DOI] [PubMed] [Google Scholar]
- [7].Vargas A, Vargas A, Hernández-Paz R, et al. Sphygmomanometry-evoked allodynia--a simple bedside test indicative of fibromyalgia: a multicenter developmental study. J Clin Rheumatol 2006;12:272–4. [DOI] [PubMed] [Google Scholar]
- [8].Jones KD, Aebischer JH, St John AW, Friend R, Bennett RM. A simple screening test to recognize fibromyalgia in primary care patients with chronic pain. J Eval Clin Pract 2018;24:173–9. [DOI] [PubMed] [Google Scholar]
- [9].Cagnie B, Coppieters I, Denecker S, Six J, Danneels L, Meeus M. Central sensitization in fibromyalgia? A systematic review on structural and functional brain MRI. Semin Arthritis Rheum 2014;44:68–75. [DOI] [PubMed] [Google Scholar]
- [10].Lemming D, Börsbo B, Sjörs A, et al. Cuff pressure pain detection is associated with both sex and physical activity level in nonathletic healthy subjects. Pain Med 2017;18:1573–81. [DOI] [PubMed] [Google Scholar]
- [11].Fullerton EF, Doyle HH, Murphy AZ. Impact of sex on pain and opioid analgesia: a review. Curr Opin Behav Sci 2018;23:183–90. [DOI] [PMC free article] [PubMed] [Google Scholar]
- [12].Petersen KK, Arendt-Nielsen L, Finocchietti S, et al. Age interactions on pain sensitization in patients with severe knee osteoarthritis and controls. Clin J Pain 2017;33:1081–7. [DOI] [PubMed] [Google Scholar]
- [13].Morroy G, Keijmel SP, Delsing CE, et al. Fatigue following acute Q-fever: a systematic literature review. PLoS ONE 2016;11:e0155884. [DOI] [PMC free article] [PubMed] [Google Scholar]
- [14].Raoult D. Q fever: confusion between chronic infection and chronic fatigue. Clin Infect Dis 2017;65:1054–5. [DOI] [PubMed] [Google Scholar]
- [15].Turk SP, Lumbard K, Liepshutz K, et al. Post-treatment Lyme disease symptoms score: developing a new tool for research. PLoS ONE 2019;14:e0225012. [DOI] [PMC free article] [PubMed] [Google Scholar]
Associated Data
This section collects any data citations, data availability statements, or supplementary materials included in this article.