Abstract
Ion mobility spectrometry coupled with mass spectrometry (IMS-MS) is a post-ionization separation technique that can be used for rapid multidimensional analyses of complex samples. IMS-MS offers untargeted analysis, including ion-specific conformational data derived as collisional cross section (CCS) values. Here, we combine nitrogen gas drift tube CCS (DTCCSN2) and Kendrick mass defect (KMD) analyses based on CH2 and H functional units to enable compositional analyses of petroleum substances. First, polycyclic aromatic compound standards were analyzed by IMS-MS to demonstrate how CCS assists the identification of isomeric species in homologous series. Next, we used case studies of a gasoline standard previously characterized for paraffin, isoparaffin, aromatic, naphthene, and olefinic (PIANO) compounds, and a crude oil sample to demonstrate the application of the KMD analyses and CCS filtering. Finally, we propose a workflow that enables confident molecular formula assignment to the IMS-MS-derived features in petroleum samples. Collectively, this work demonstrates how rapid untargeted IMS-MS analysis and the proposed data processing workflow can be used to provide confident compositional characterization of hydrocarbon-containing substances.
Graphical Abstract
Introduction.
Products of petroleum refining are substances classified as “unknown or variable chemical composition, complex reaction byproducts, or biological materials” (UVCB).1 The information on compositional characterization of petroleum substances is highly desired not only from a chemistry point of view, but is also required for hazard classification 2,3 and product registration.4 Conventional methods for compositional characterization of petroleum substances typically rely on physicochemical analyses (i.e., bulk composition, boiling point, flash point, metal content) or chemical separation methods (i.e., extraction, distillation, chromatography, mass spectrometry). 5 More recently, a number of high-resolution analytical methods and data analyses approaches, collectively referred to as “petroleomics,” were developed to enable a comprehensive characterization of these very complex substances.6–9 For example, two-dimensional (2D) gas chromatography (GC × GC) achieves orthogonal separation of molecules in petroleum substances based on volatility and polarity and can resolve nearly 10 times the number of features compared to one dimensional GC.10,11 GC × GC is often coupled with either fluorescence ionization detection (FID) or time-of-flight mass spectrometry (TOF-MS) detectors.12 Fourier transform ion cyclotron resonance mass spectrometry (FT-ICR MS) is a technique that offers ultrahigh resolving power and mass accuracy; however, the complexity of petroleum substances presents an analytical challenge to most mass spectrometry methods.13–15 Ion mobility spectrometry−mass spectrometry (IMS-MS) is an analytical technique that supplements separation of complex substances by mass and charge (m/z) with information on the spatial conformation, termed collisional cross section (CCS).16 CCS is an orthogonal parameter that can be used to distinguish between isomers and improve precision in structural assignments of the components in complex samples.17–19
High-resolution analytical methods used for the analysis of petroleum substances yield complex data matrices that require special handling, visualization, and statistical analyses.6 Typical approaches are Kendrick mass defect (KMD) analysis,20 as well as determinations of elemental composition and aromaticity.21,22 The traditional Kendrick scale is based on CH2 and normalizes the mass of CH2 (14.01565 Da) to its nearest integer (14.00000), sorting compounds with the same mass defect into homologous series.20,23 Alternative functional units can be used for KMD analysis of complex data matrices, such as hydrocarbon-containing samples (i.e., C6H6),24,25 polymers (C3H6SiO),26,27 and poly- and per-fluoroalkyl substances (CF2).28 Overall, while the data analysis methods in petroleomics benefit from the developments in data processing workflows and interactive visualizations,6 many challenges remain in the confident assignment of molecular formulas to the features identified by untargeted analytical methods.29
One approach to improve confidence in feature identification of untargeted analytical methods is to increase the dimensionality of classification without sacrificing the time needed to process each sample. Among many untargeted analysis methods for petroleum samples, IMS coupled with mass spectrometry (referred to here as IMS-MS) offers a number of benefits as it can separate complex samples into their various molecular ions in milliseconds.30–32 Indeed, IMSMS has been used for petroleomics analyses.33–37 The IMS based CCS value provides direct information about each ion’s size and shape, enabling filtering of potentially mis-assigned features in highly complex petroleum samples. The IMS-MS data output consists of m/z, drift time (used to calculate CCS), and abundance for thousands of features, allowing for prediction of molecular identities and the discrimination between isomeric species. Although these IMS-MS-derived data are amenable to traditional data processing methods such as KMD,34 a systematic workflow for processing of IMS-MS data for complex petroleum substances has not yet been proposed. In this study, we present such a workflow and demonstrate the benefit of including the IMS dimension into data analysis.
Specifically, we coupled analysis of the data from untargeted IMS-MS with KMD visualizations based on CH2 and H functional units for a workflow that can be used to characterize complex hydrocarbon-containing (i.e., petroleum) substances. First, we analyzed isomeric hydrocarbon standards to demonstrate IMS-MS-enabled separation and the utility of nitrogen gas drift tube CCS (DTCCSN2) for identifying structural isomers. We then analyzed a [n-paraffins (P), isoparaffins (I), aromatics (A), naphthenes (N), and olefins (O)] (PIANO) gasoline standard and a crude oil sample as representative complex samples to demonstrate the application of the proposed workflow. Finally, we illustrate that the DTCCSN2 enabled increased confidence in the evaluation of the chemical composition of the features in homologous series.
Experimental Section.
Materials.
Representative standards for αββ(20R)-cholestane (cat # 0602.27–100-IO, CAS # 69483–47-2, Chiron, Trondheim, Norway), αββ(20R,24S)-methylcholestane (cat # 0643.28–100-IO, CAS #71117–90-3, Chiron, Trondheim, Norway), αββ(20R,24RS)-ethylcholestane (cat # 0913.29–100-IO, CAS # 71117–92-5, Chiron, Trondheim, Norway), and βαα(20R,24R)-ethylcholestane (cat # 0610.29–100-IO, CAS # 4705–29-7, Chiron, Trondheim, Norway) were used as analytical standards. Each compound was diluted with high-performance liquid chromatography (HPLC)-grade toluene (CAS # 108–88-3, Product # 179418, Sigma-Aldrich, St. Louis, MO) and methanol (CAS # 67–56-1, Product # 34860, Sigma-Aldrich) 50:50 (v/v); see Supplemental Table 1 for final concentrations. A PIANO gasoline mix (part # PIANO, Lot No. 217101400, AccuStandard, New Haven, CT) was diluted 10× with toluene and methanol (50:50, v/v). A crude oil sample (1 mg) from Louisiana was diluted in 1 mL of a mixture (50:50, v/v) of toluene and methanol.
IMS-MS Instrumentation and Analysis.
A 6560A ion mobility (resolving power (RP) ≈ 25 000) Q-TOF-MS (RP ≈ 60) drift tube instrument with nitrogen gas (Agilent Technologies, Santa Clara, CA) was used for sample analysis. The instrument was calibrated prior to running samples according to the Agilent protocol, using the APCI-L low-concentration tuning mix solution (part # G1969–85010, Agilent). Direct infusion was then utilized to inject 150 μL of sample at a flow rate of 50 μL/min. This was conducted in triplicate, and an atmospheric pressure photoionization (APPI) source in positive-ion mode was used to facilitate the detection of aromatic compounds. Instrumental and source parameters were as follows: APPI positive mode, sample analysis time 1.5 min; source parameters: gas temperature 325 °C, vaporizer 350 °C, drying gas 10 L/min, nebulizer 30 psi, VCap 3000, fragment 400V, 110 RF Vpp 750. The following acquisition parameters were defined in each instrumental run: mass range 50−1700 m/z, frame rate 1 frame/s, IM transient rate 18 transients/frame, max drift time 60 ms, TOF transient rate 600 transients/IM transients, trap fill time 20 000 μs and trap release time 300 μs. QTOF parameters were as follows: firmware version 18.723, rough Vac 2.71 torr, Quad Vac 3.68 × (E-05) torr, TOF Vac 3.47 × (E-07) torr, drift tube pressure 3.940 torr, trap funnel pressure 3.790 torr, chamber voltage 5.96 μA, and capillary voltage 0.076 μA. Data was obtained using the Agilent MassHunter Acquisition software (Agilent, v.09.00).
Data Processing and Filtering.
IMS-MS raw data files for the samples evaluated in this study were processed using MassHunter Browser Acquisition data software (Agilent, B.08.00) to calculate individual DTCCSN2 values for all detected features.38 Data was then filtered using Agilent MassProfiler software (Agilent, B.08.00) with Q-score > 75 (Agilent MassHunter peak quality metric that ranges from 0 to 100, which is an algorithmic estimate of how likely a feature is an actual molecule) and abundance >5000 or >1000. Filtering parameters were selected based on the general consideration of the presence of 13C isotopic partner for individual features; however, alternative thresholds may be selected. The data matrix of detected features was then cross-referenced to a DTCCSN2 library.39 This was performed using Agilent MassHunter ID Browser (B.08.00) matched features with an m/z tolerance of ±5 ppm and ±2 mDa and DTCCSN2 tolerance of ±1%.
Kendrick Mass (KM) Defect Calculations.
KM was calculated for all features in the filtered data sets by multiplying their observed m/z by a factor unique to each functional unit evaluated (Table 1), representing a ratio of its nominal mass (NM) to exact mass (EM) (eq 1). KM was then rounded to the nearest integer to obtain the Kendrick nominal mass (KNM). KMD was calculated by subtracting KM from KNM, in parts per thousand (ppt) (eq 2).
Table 1.
Mass defect multiplication factors for each functional unit evaluated. Kendrick mass (KM) was calculated by multiplying the observed m/z of features in the data by a ratio of Nominal Mass/Exact Mass (NM/EM).
| Molecular Formula | Nominal Mass (Da) | Exact Mass (Da) |
|---|---|---|
| CH2 | 14.00000 | 14.01565 |
| H | 1.00000 | 1.00783 |
| C4H2 | 50.00000 | 50.01565 |
| C6H6 | 78.00000 | 78.04695 |
| C10H8 | 128.00000 | 128.06260 |
| (Eq. 1) |
| (Eq. 2) |
Homologous series in KMD-CH2 vs m/z plots were first defined as horizontal rows of features lying within a KMD- CH2 tolerance of ±1.00 ppt, based on the error calculated using APPI tuning mix (Supplemental Table 2). Features belonging to the series were confirmed based on m/z values differing by multiples of 14 Da in their nominal mass measurements. Features following this trend were thus assumed to have compositions varying only by the addition of one or more CH2 units.
Features that were given molecular formula assignments by DTCCSN2 library39 matching served as anchors to identify the elemental composition of other members of that homologous series. Elemental KMD shifts based on evaluated functional units (Table 1) were then used to navigate remaining homologous series and similarly assign molecular formulas. The molecular loss of a H atom resulted in a 6.6996 positive KMD shift, while the gain of a C resulted in 13.3993 negative KMD shift (Table 2).
Table 2.
Elemental KMD shifts (in parts per thousand, ppt) based on CH2 and H functional units. Elemental mass defects were calculated as the difference between the elemental nominal mass and its corresponding Kendrick mass (Table 1).
| Element | Exact Mass (Da) | Nominal Mass (Da) | KMD [CH2] (ppt) | KMD [H] (ppt) |
|---|---|---|---|---|
| 12C | 12.0000 | 12.00000 | 13.39931 | 93.17141 |
| 1H | 1.00783 | 1.00000 | −6.69969 | 0.00000 |
| 16O1 | 15.99491 | 16.00000 | 22.94506 | 129.27407 |
| 16O2 | 31.98983 | 32.00000 | 45.89113 | 258.54912 |
| 14N | 14.00307 | 14.00000 | 12.56196 | 105.64985 |
| 32S | 31.97207 | 32.00000 | 63.62630 | 276.16627 |
| 35Cl | 34.96885 | 35.00000 | 70.19253 | 302.65412 |
DTCCSN2 values for features within homologous series were then used to provide additional confidence of molecular formula assignment as well as identifications for isomeric features. Features within a homologous series followed a DTCCSN2 pattern differing by 4−6 Å2. Features not following the defined CCS shift were thus assumed to be structural outliers. These were verified as potential isomeric species using Agilent MassHunter Browser (B.08.00) where 2D IMS-MS spectra revealed the ions as having the same m/z with significant drift time differences. Such isomeric features maintained the same molecular composition as their original homologous series, but a different structural conformation.
KMD-H vs m/z plots were then used to corroborate CH2-based assigned molecular formulas. Here, features appearing as homologous series (±2.00 ppt KMD-H) were classified as having the same number of carbon atoms and as belonging to the same molecular class. Each feature in a series therefore differs only in its number of hydrogen atoms, and features within a series are organized in order of decreasing double-bond equivalence (left to right). Homologous series of molecules differing by 1C were separated by a shift of ±93.171 ppt KMD-H (Table 2). Elemental shifts calculated for KMD-H were again used to identify relationships between homologous series, here representing different carbon numbers, molecular classes, and species. These elemental shifts allowed us to further assign putative molecular formulas to individual features not within a homologous series (non-series features). Heteroatomic shifts including nitrogen, oxygen, and sulfur shown in Table 2 gave further insight into possible molecular formulas to assign to these otherwise unidentified features.
Results and Discussion.
The comprehensive characterization of UVCB substances is a critical gap in the regulatory evaluation of their potential to pose environmental and human health risks. We addressed this challenge through the application of IMS-MS and a petroleomic data analysis workflow that can be used to characterize the molecular composition of complex hydrocarbon- containing substances.
Combining DTCCSN2 and KMD for Isomer Identification.
Four hydrocarbon biomarkers were used for illustrative purpose to demonstrate the advantage of KMD visualization and isomeric discrimination using multidimensional IMS-MS data (m/z and DTCCSN2) (Figure 1). First, KMD (y-axis) plotted against m/z (x-axis) presents a homologous series composed of cholestane (C27H48), methylcholestane (C28H50), and ethylcholestane (C29H52) (Figure 1A). Incorporation of DTCCSN2 (z-axis) values for each homologue enabled the discrimination of stereoisomers otherwise indistinguishable by m/z or elemental composition alone (Figure 1A). IMS-MS analysis of both isomers (Figure 1B,C) identified ethylcholestane (m/z 400.4020). Isomeric peaks were also detected for β,α,α(20R,24R)-24-ethylcholestane at a drift time of 26.47 ms (Figure 1B) and for α,β,β(20R,24R)-24-ethylcholestane at a drift time of 26.26 ms (Figure 1C).
Figure 1.
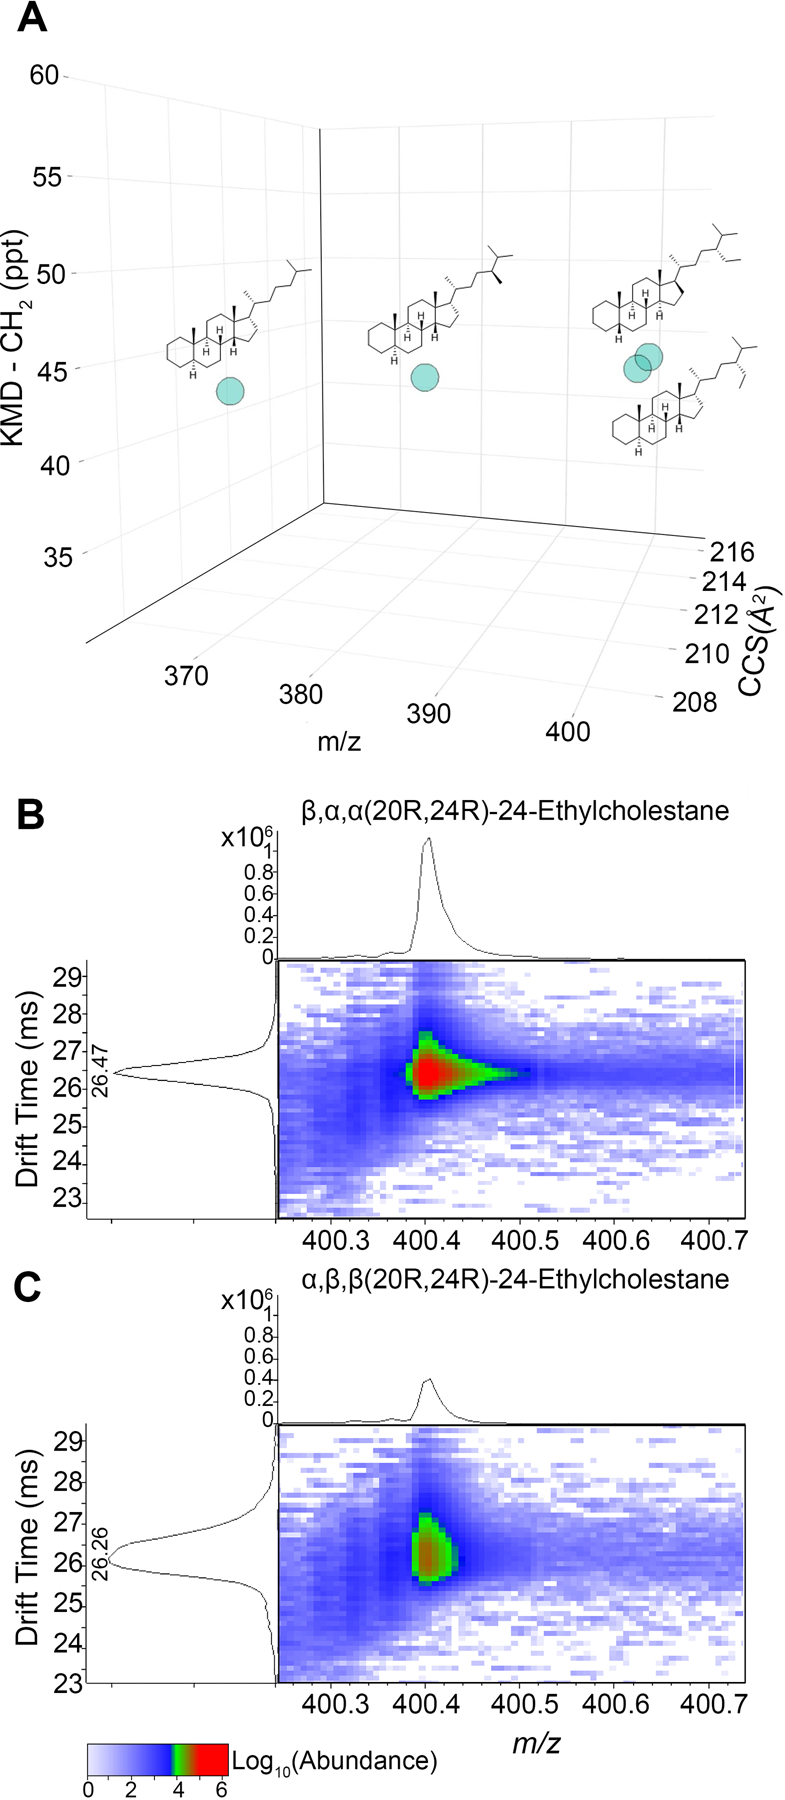
Analysis of stereoisomers using KMD coupled with m/z and DTCCSN2 (Å2) parameters. (A) Three-dimensional (3D) scatter plot showing cholestane homologous series, where x-axis is m/z, y-axis is KMD-CH2, and z-axis is DTCCSN2. (B−C) IMS-MS spectra and their respective drift times for stereoisomers β,α,α(20R,24R)-24-ethylcholestane (B) and α,β,β(20R,24R)-24-ethylcholestane (C).
Application of IMS-MS to a PIANO Gasoline Standard Sample.
To demonstrate our KMD and IMS-MS workflow, we first analyzed a PIANO gasoline standard, which is a representative sample that has been evaluated using traditional GC-MS methods. The nested two-dimensional IMS-MS spectra (Figure 2) illustrate the mass-mobility correlation of ions (a total of 7863, Supplemental Table 3) detected in the PIANO gasoline standard. Ions with higher m/z also have higher drift time, as expected, because larger ions take longer to travel through the drift tube. The drift time is directly proportional to DTCCSN2 (Å2), indicating that ions with higher m/z and drift time encounter more collisions with the stationary buffer gas, and are spatially larger. This study utilized APPI for selective ionization of polycyclic aromatic compounds (PACs). Analysis of the raw spectra (Figure 2, top and Supplemental Table 3) revealed that 13C isotopic partners for several ions with abundance <5000 and quality scores (Qscore) <75 were undetectable. Therefore, to increase confidence in feature characterization, the raw data was filtered based on these thresholds, yielding a filtered m/z range of 91− 450 and a DTCCSN2 range of 108−223 Å2 (Supplemental Table 4). Visual inspection highlighted the presence of one feature (m/z ∼150, drift time >30) that was later characterized as an outlier by our analysis.
Figure 2.
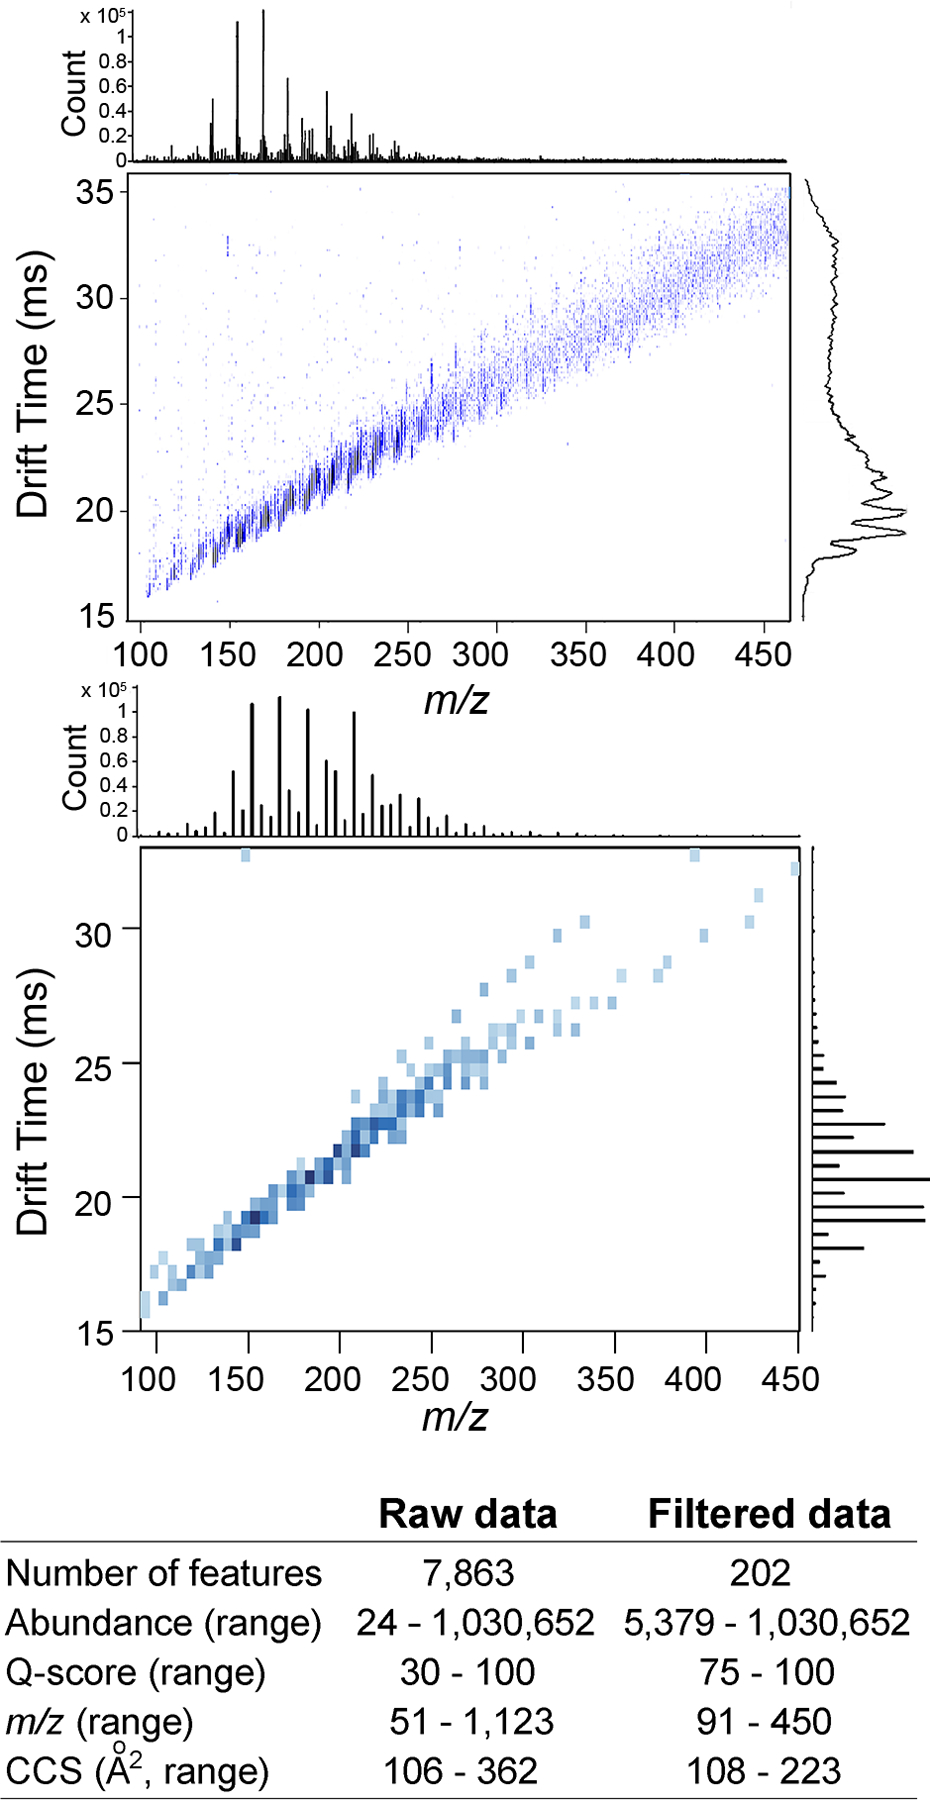
IMS-MS spectra for PIANO gasoline standard. Raw data (top, Supplemental Table 3) in APPI positive-ion mode and features filtered (bottom) by abundance >5000 and Q-score >75. X-axis is m/z, and Y-axis is drift time. Density plots for each parameter are shown. A summary table of the feature characteristics is shown for both raw and filtered data sets.
The filtered IMS-MS data (a total of 202 features, Supplemental Table 4) from the PIANO gasoline standard were visualized using KMD (Figure 3). Conventional KMD versus m/z plots (Figure 3A) derived using the CH2 scale show homologous series by their degree of similarity to a saturated alkane composed entirely of CH2 groups (KMD-CH2 ∼0). Features of the same molecular class and base unit differing only by multiples of CH2-alkyl units align into unique horizontal rows within ±1 ppt, with individual ions spaced by ∼14 Da. Increasing aromaticity and double-bond equivalence (DBE) within features of the same molecular class (i.e., loss of a C) exhibit a KMD-CH2 shift of +13.39931 ppt. Vertically shifted features with KMD-CH2 inconsistent with that shift belong to heteroatom classes (Table 2). Cross-referencing of these data with the DTCCSN2 library39 matched three features. These were used as “anchor features” to assign the molecular formulas to other features within the same and neighboring series were identified (181 features in homologous series). KMD-CH2 shifts were then applied to assign chemical identities to features not within homologous series (13 of features were not in homologous series).
Figure 3.
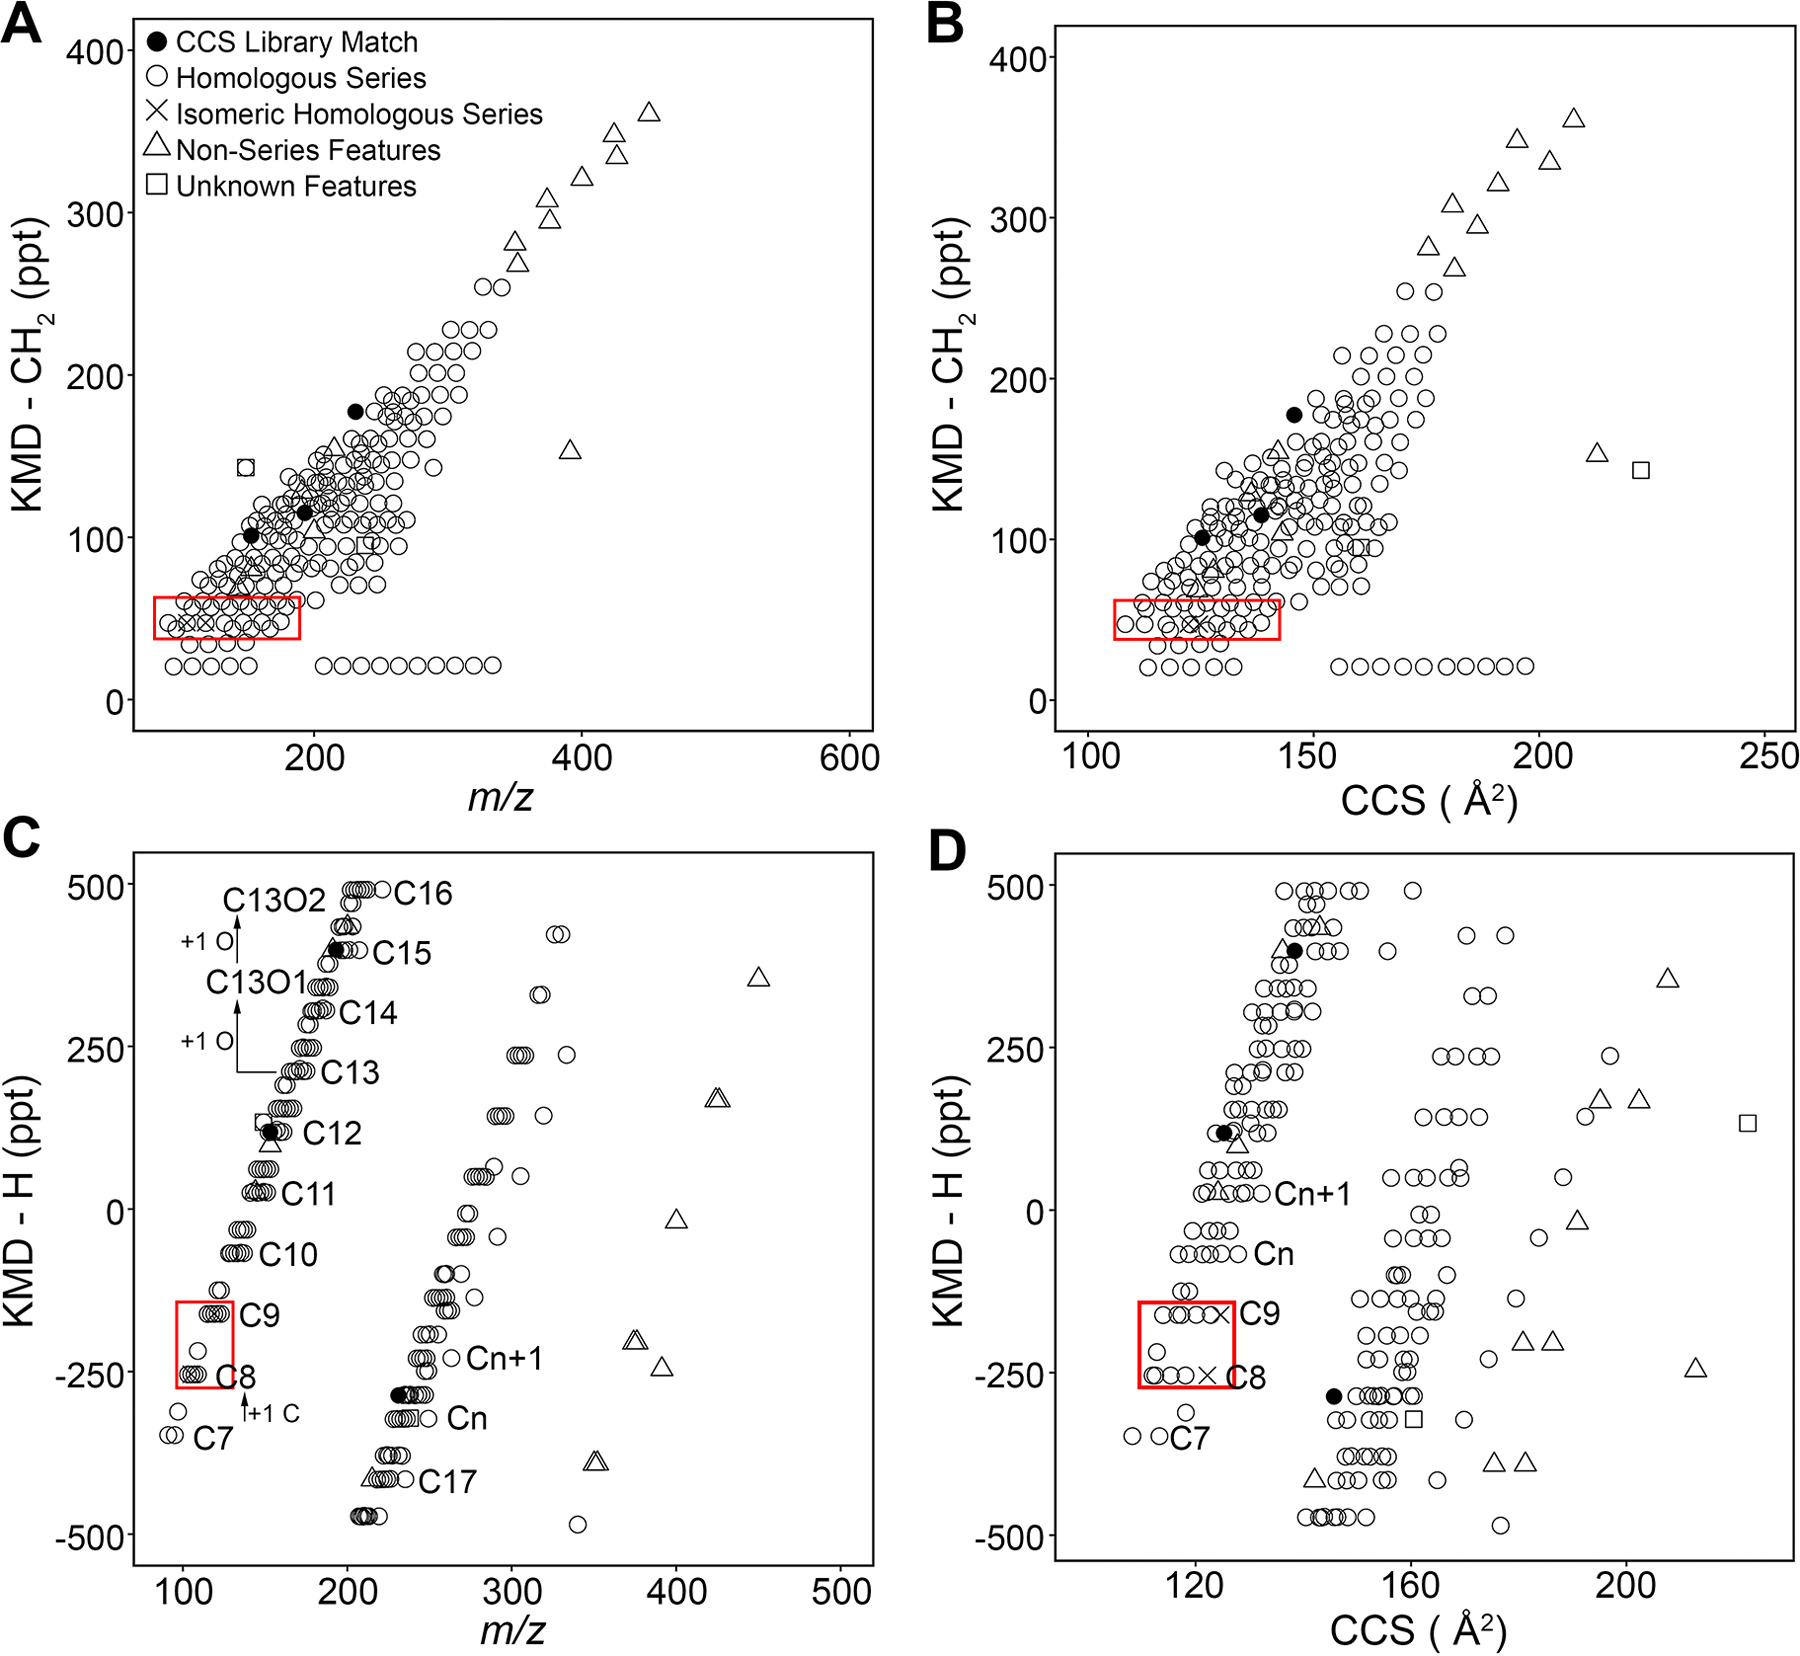
KMD analyses of IMS-MS data for PIANO gasoline standard. Filtered features (Supplemental Table 4) were plotted based on CH2 and H KMD analyses (Supplemental Tables 5–6). (A) The KMD-CH2 vs m/z plot shows homologous series as horizontal series of features (n = 202). (B) The KMD-CH2 vs DTCCSN2 plot with DTCCSN2 library-matched features (n = 3) shown as black circles. (C) KMD-H vs m/z plot showing homologous series based on the carbon number. (D) KMD-H vs DTCCSN2 plot identifies isomeric features (×) in their respective homologous series (red rectangles and Figure 4) based on DTCCSN2. Elemental shifts were used to assign formulas to homologous series (open circles) from nonseries features (open triangles). Features without molecular formula assignments are shown as open squares.
Figure 3B shows the application of KMD-CH2 analysis in combination with DTCCSN2 as an orthogonal parameter for the characterization of homologous series. Derived for each feature, DTCCSN2 measurements corroborated homologous series assignments (Figure 3A) and increased confidence in feature identification. When used in conjunction with traditional KMD vs m/z analysis, DTCCSN2 data enables identification of the features that are structurally incongruent with the features in m/z-based series. The aforementioned outlier feature with m/z ∼150 Da and DTCCSN2 ∼225 Å2 is one example. Thus, inclusion of KMD- DTCCSN2 analysis distinguished isomeric features that may be mis-assigned to the homologous series characterized with m/z alone (Figure 3B, red rectangle).
KMD calculations based on the hydrogen “unit” were also performed (Figure 3C,D). This analysis was based on the proposed use of the individual elements (e.g., C or H) for KMD data processing.27 Specifically, each feature’s location is based on the vertical separation of features of the same elemental composition and heteroatom class. Analogous to CH2 series, features align into horizontal rows of carbon number-based series, varying only by the number of hydrogen atoms. Carbon number series of the same molecular class have a KMD-H shift ±93.717 ppt along the KMD-H scale. This analysis was especially useful to corroborate the molecular formula assignments derived from KMD-CH2 and to inform additional assignments for features previously unidentifiable with KMD-CH2 alone. The combination of CH2- and H-based KMD analysis using m/z and DTCCSN2 provides additional evidence to support the putative molecular assignments of features in complex samples.
Two-dimensional KMD analysis with m/z and DTCCSN2 determined the presence of features with the same m/z and differing mobility parameters. This enabled discrimination of isomeric species that were formerly indistinguishable by the traditional KMD- vs m/z analysis (Figure 4). Figure 4A shows a KMD-CH2 vs m/z plot for a homologous series at 47 ppt, where two pairs of ions overlap at m/z of 105.0699 (arrows) and 119.0853 (arrowheads). Using DTCCSN2 values (Figure 4B) to plot these series, the shift of isomeric species allows for structural discrimination of the features with the same elemental composition but different spatial conformations. KMD-H analysis further corroborated findings from KMD-CH2, showing the overlap in isomeric pairs with m/z alone (Figure 4C). The KMD-H vs m/z plot also illustrates each isomeric pair within its respective carbon number series, increasing the confidence in molecular assignments with KMD-CH2. When plotting KMD-H vs DTCCSN2 (Figure 4D), the migration of features from each isomeric pair with DTCCSN2 again reveals structural discrepancies. Alignment of these features with their respective carbon number series of equal KMD-H provides additional confidence for molecular formula assignments. KMD-H with m/z and DTCCSN2 analyses also show different ion types within the same carbon number group, namely, [M]+ and [M + H]+. Ions of the same carbon number but different ionization have different KMD-CH2 values and can be difficult to distinguish based on the KMD-CH2 scale. KMD-H analysis aligns features of the same carbon number into series, regardless of ionization type, and increases confidence in assignments.
Figure 4.
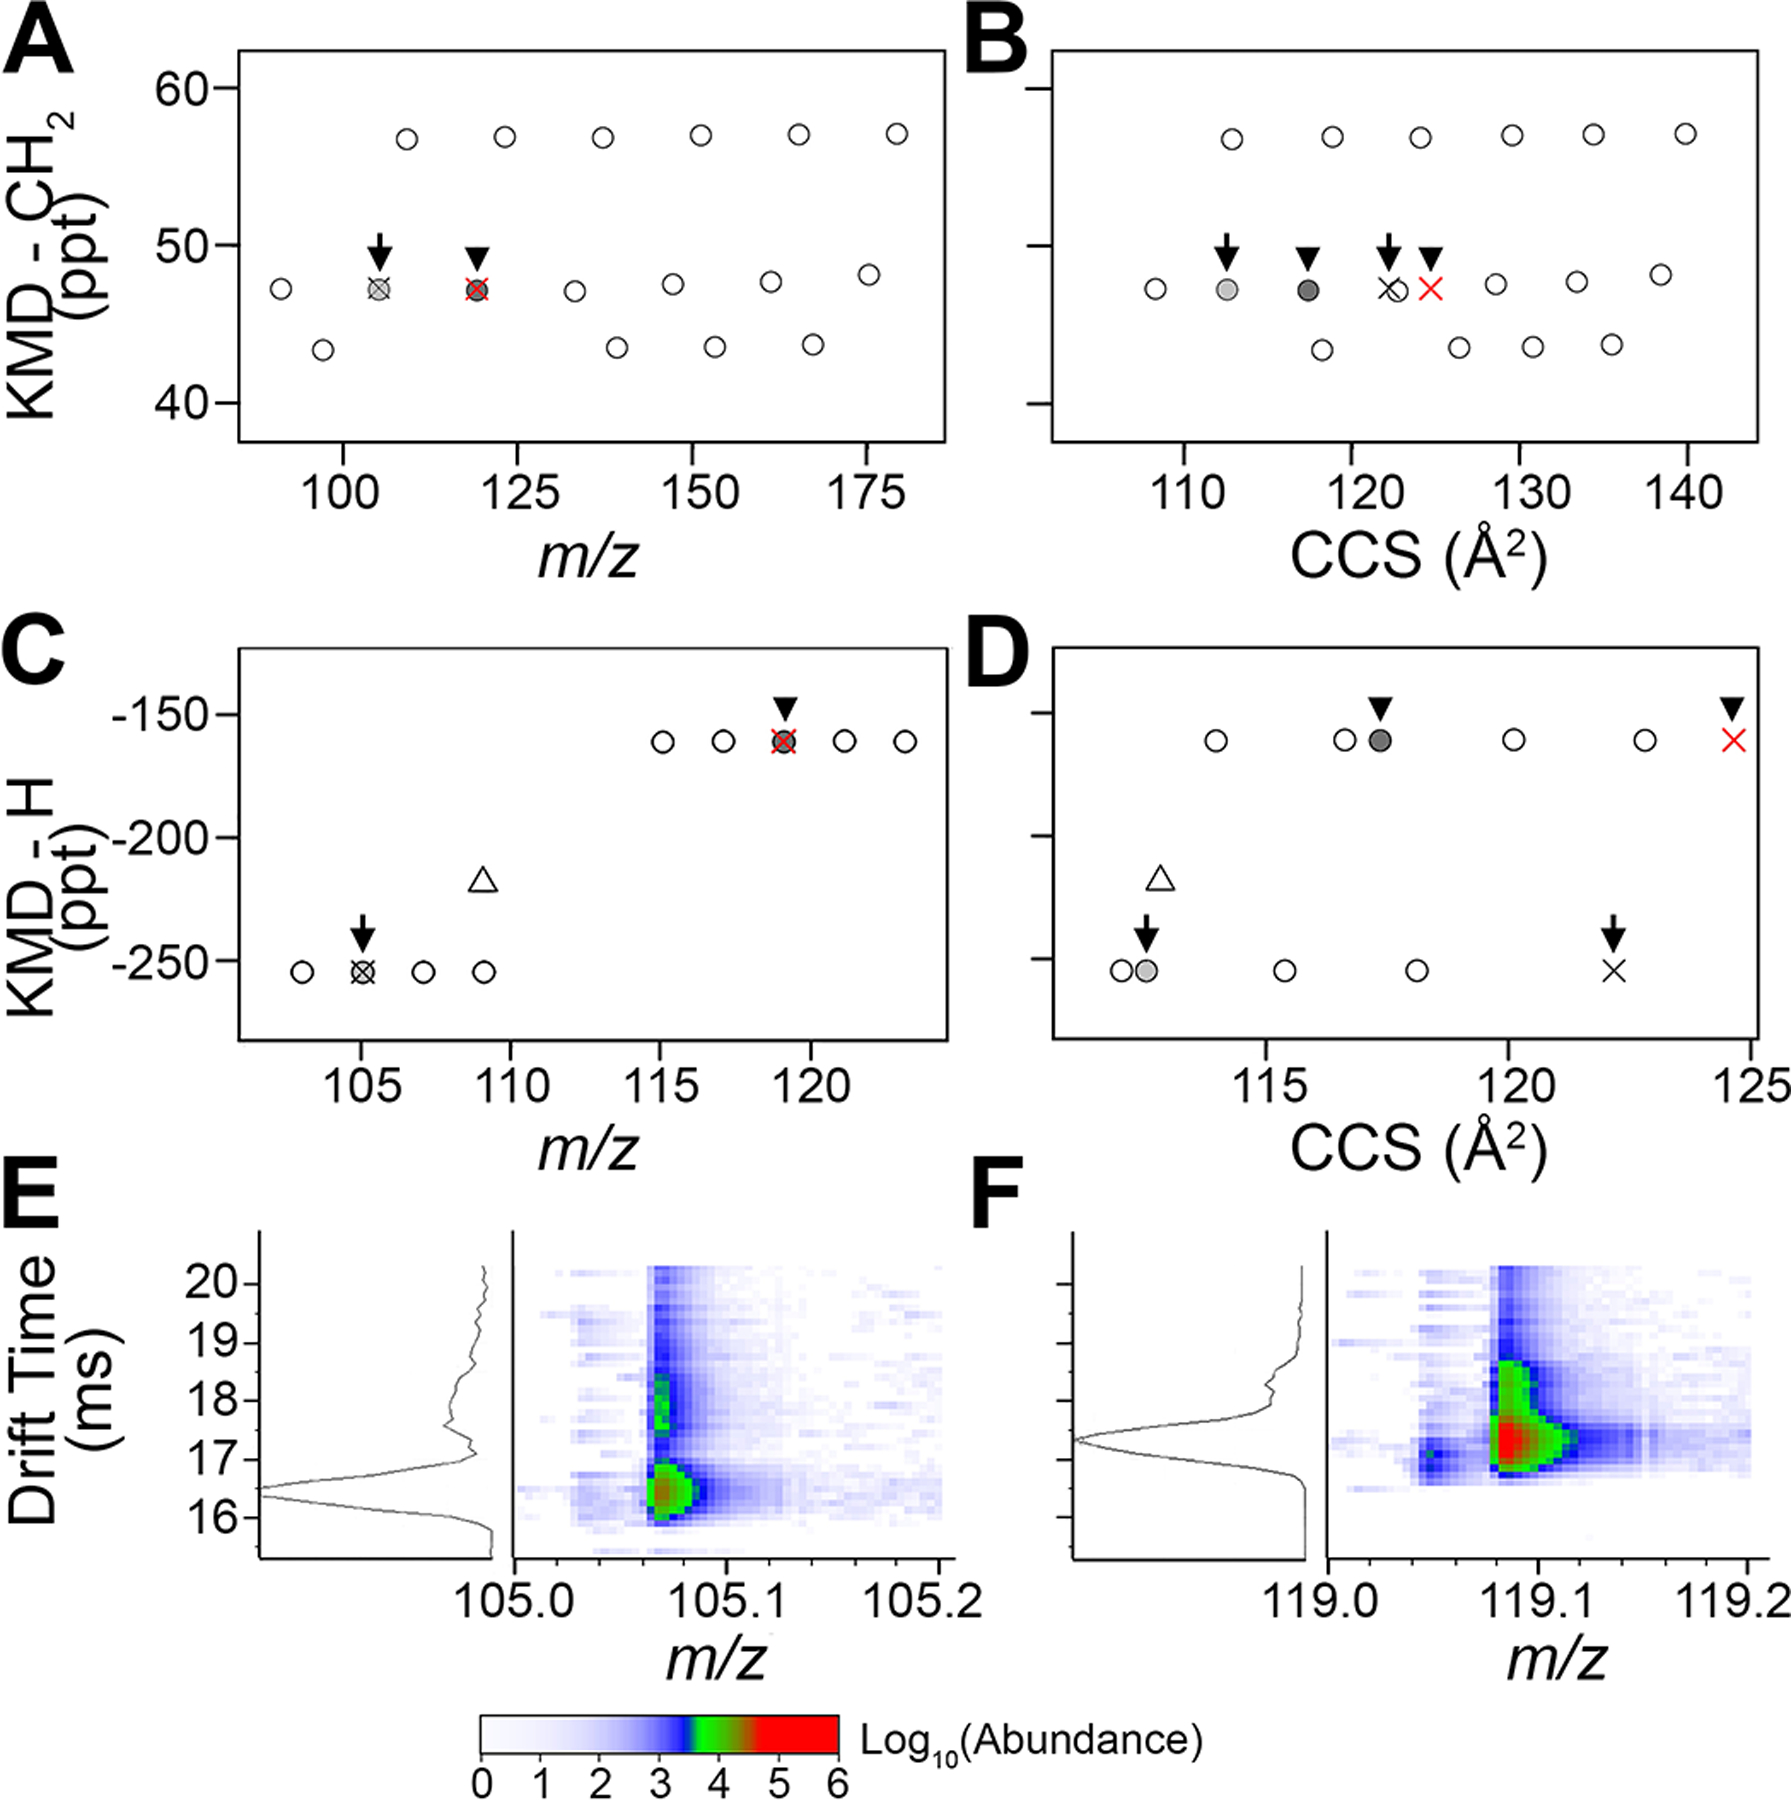
Verification of the molecular formula assignments for the isomeric species in PIANO gasoline standard using DTCCSN2. A close inspection of data from Figure 3 (red rectangles) illustrates two pairs of isomers: arrows (m/z 105.0699) and arrowheads (m/z 119.0853). (A) Traditional KMD-CH2 vs m/z plot shows a homologous series of hydrocarbons with isomers. (B) The KMD-CH2 vs DTCCSN2 plot separates isomers and (C) the KMD-H vs m/z plots of ions based on a carbon group, showing the overlap of isomers. (D) KMD-H vs DTCCSN2 plot illustrates discrimination between isomers, [M]+, and [M + H]+. (E, F) 2D IMS-MS plots confirm the detection of isomers exhibiting the same m/z but varying drift times (ms). (E) DTCCSN2 - dimension separation of features with m/z 105.0699 identified with an arrow in (A−D): the light gray circle (drift time 16.45 ms) and its isomer (black ×, drift time 17.78 ms). (F) The second isomeric pair (arrowheads, m/z 119.0853): the dark gray circle (drift time 17.31 ms) and its isomer (drift time 18.26 ms).
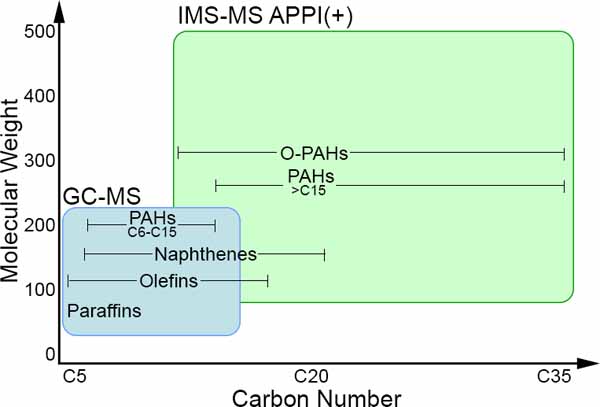
The workflow was applied to the PIANO gasoline standard using data filtered as shown in Figure 2. Out of 202 total features used for the analysis, 195 were assigned a molecular formula with confidence using CH2 and H base unit analysis, 6 were without assignment, and 1 was a structural outlier (in terms of m/z− DTCCSN2 relationship). The PIANO gasoline standard is an informative case study because detailed GC-MS analyses are available on this sample; in this standard, 214 low mass compounds (MW 56−212) out of the 263 compounds detected by GC-MS were identified (https://www.accustandard.com/piano). Compared to GC-MS, the IMS-MS analysis enabled characterization of a broader mass range, up to m/z∼450. Therefore, while both techniques detect the C6−C15 hydrocarbons, IMS-MS identified additional substances in the C15−C36 range. While the GC-MS analysis of the PIANO gasoline standard identified 42 unique molecular formulas, IMS-MS analysis coupled with the data analysis workflow yielded 195 unique molecular formulas; 10 were in common to both analyses (Supplemental Table 10). Furthermore, the APPI ionization used in the IMS-MS analysis enabled identification of additional aromatic hydrocarbon compounds that are difficult to resolve using gas chromatography, providing an additional benefit with respect to the fingerprinting of the molecules that are of concerns with respect to human health.42
In addition, we note that lowering data processing thresholds will yield many additional features that can be also evaluated through the data analysis workflow. For example, when an abundance threshold was lowered to 1000 in the data from the IMS-MS analysis of the PIANO gasoline standard, a total of 921 features passed the criteria. Of these, 726 (79%) could be assigned molecular formulas and 141 are potential multimers or isomers (Supplemental Table 11). Depending on the goals of the data analysis, lower thresholds and larger data matrices may be appropriate; however, care needs to be taken to maintain confidence in feature quality through isotope pattern verification and other analyses.
Evaluation of Different Functional Units for KMD Analysis of Hydrocarbon Substances.
KMD analysis of high-resolution petroleomics data may be performed with a variety of functional units.20,24,43 Because previously detailed analysis (Figure 5) of the PIANO gasoline standard failed to assign a molecular formula to 6 features, we tested whether other functional units can be more informative for the KMD part of the data analysis workflow (Figure 6).
Figure 5.
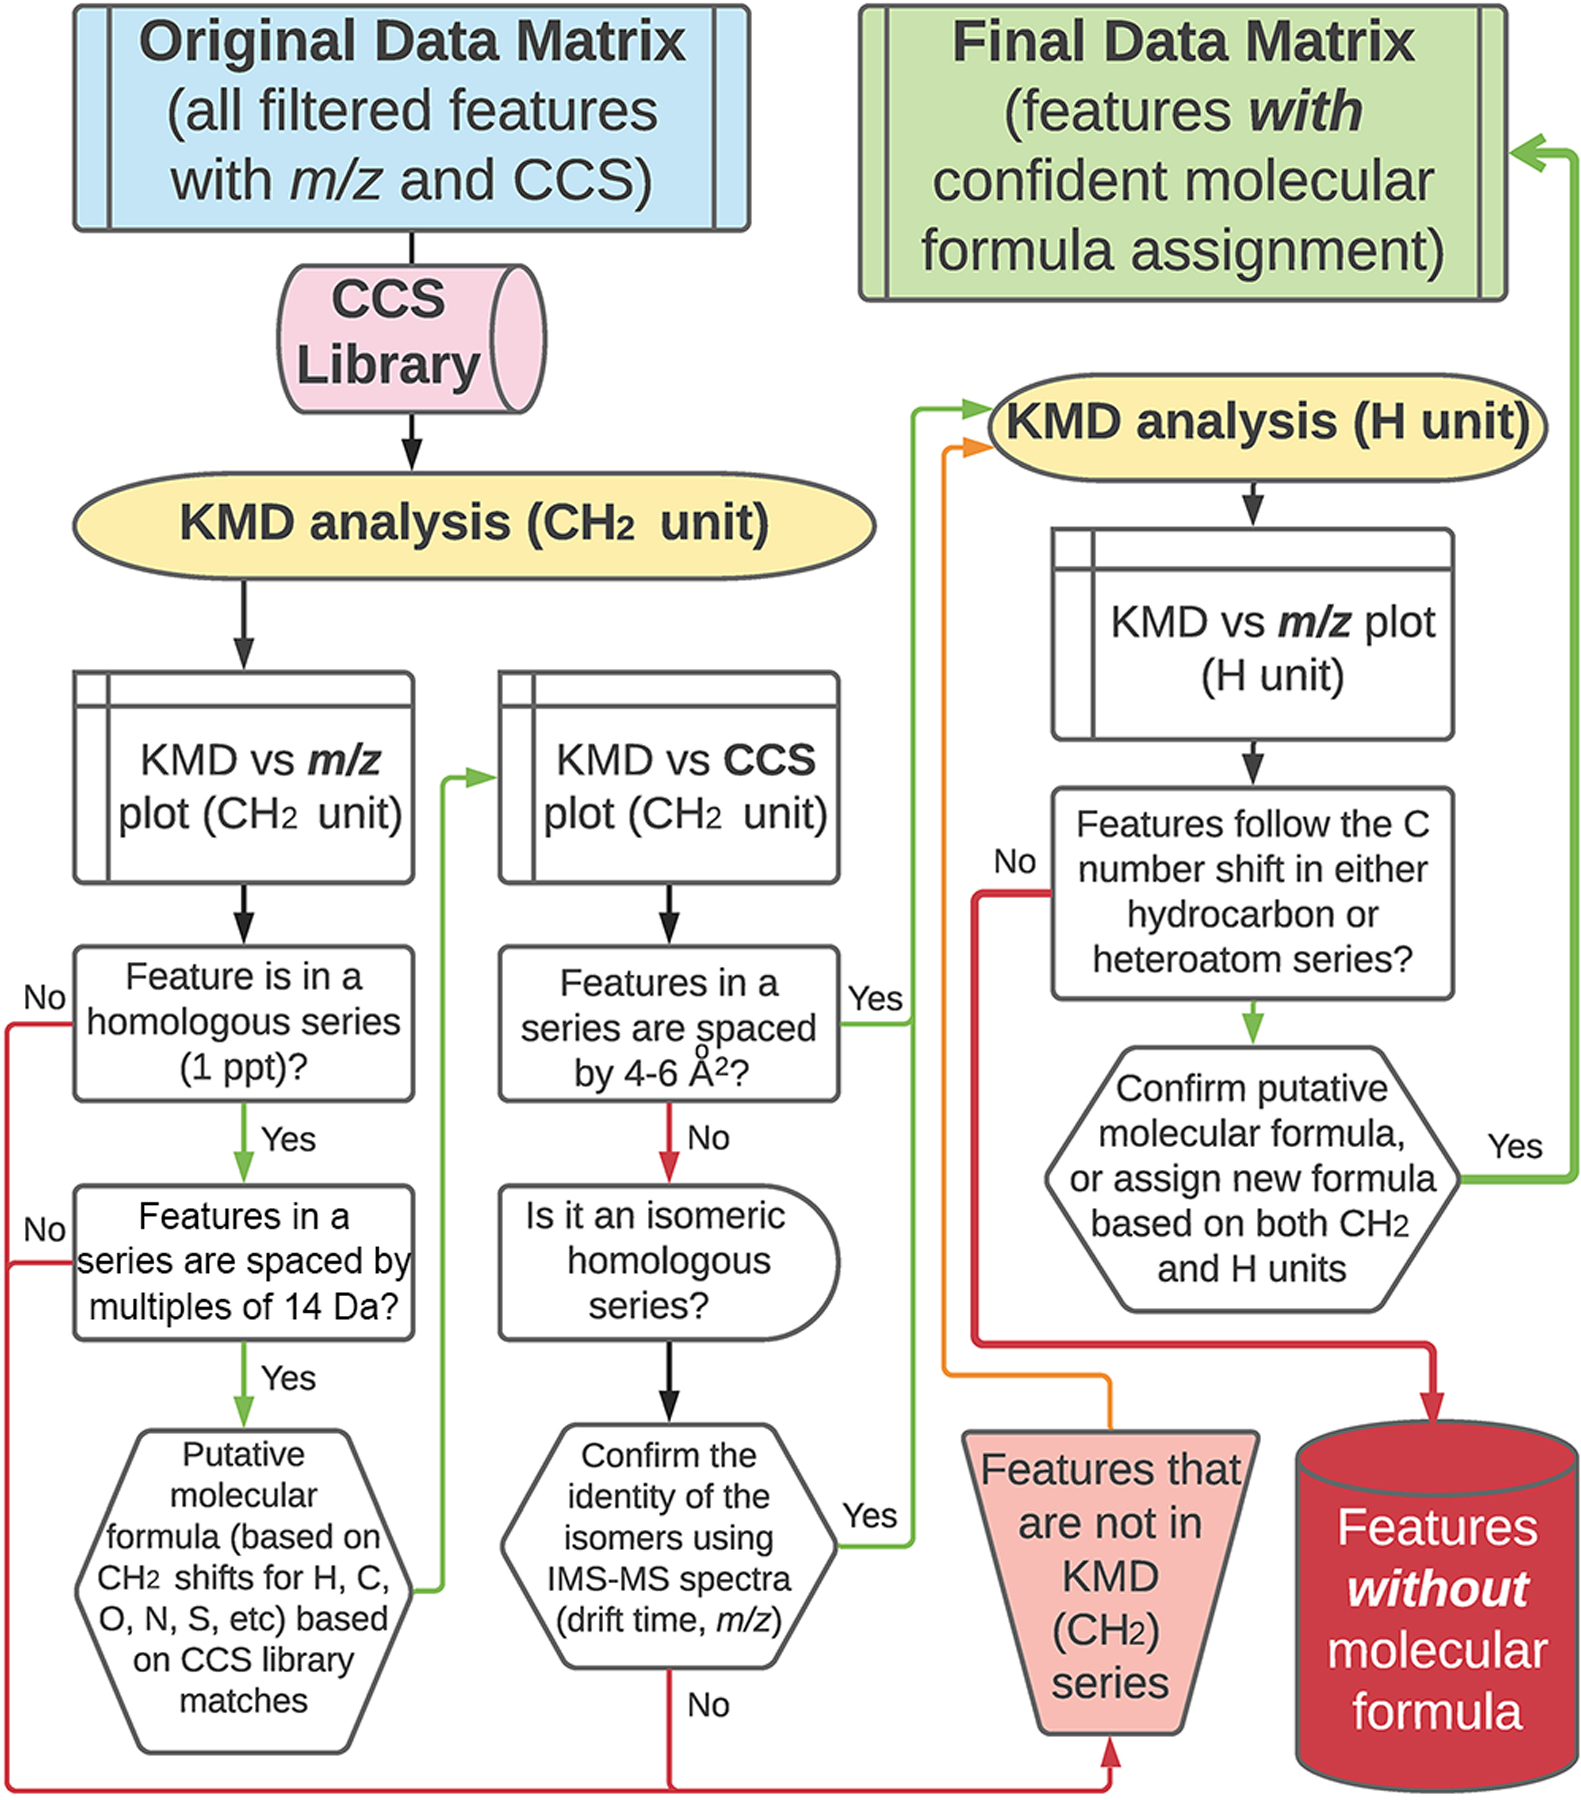
Data processing workflow for complex hydrocarbon-containing samples using IMS-MS data followed by CH2 and H KMD analyses.
Figure 6.
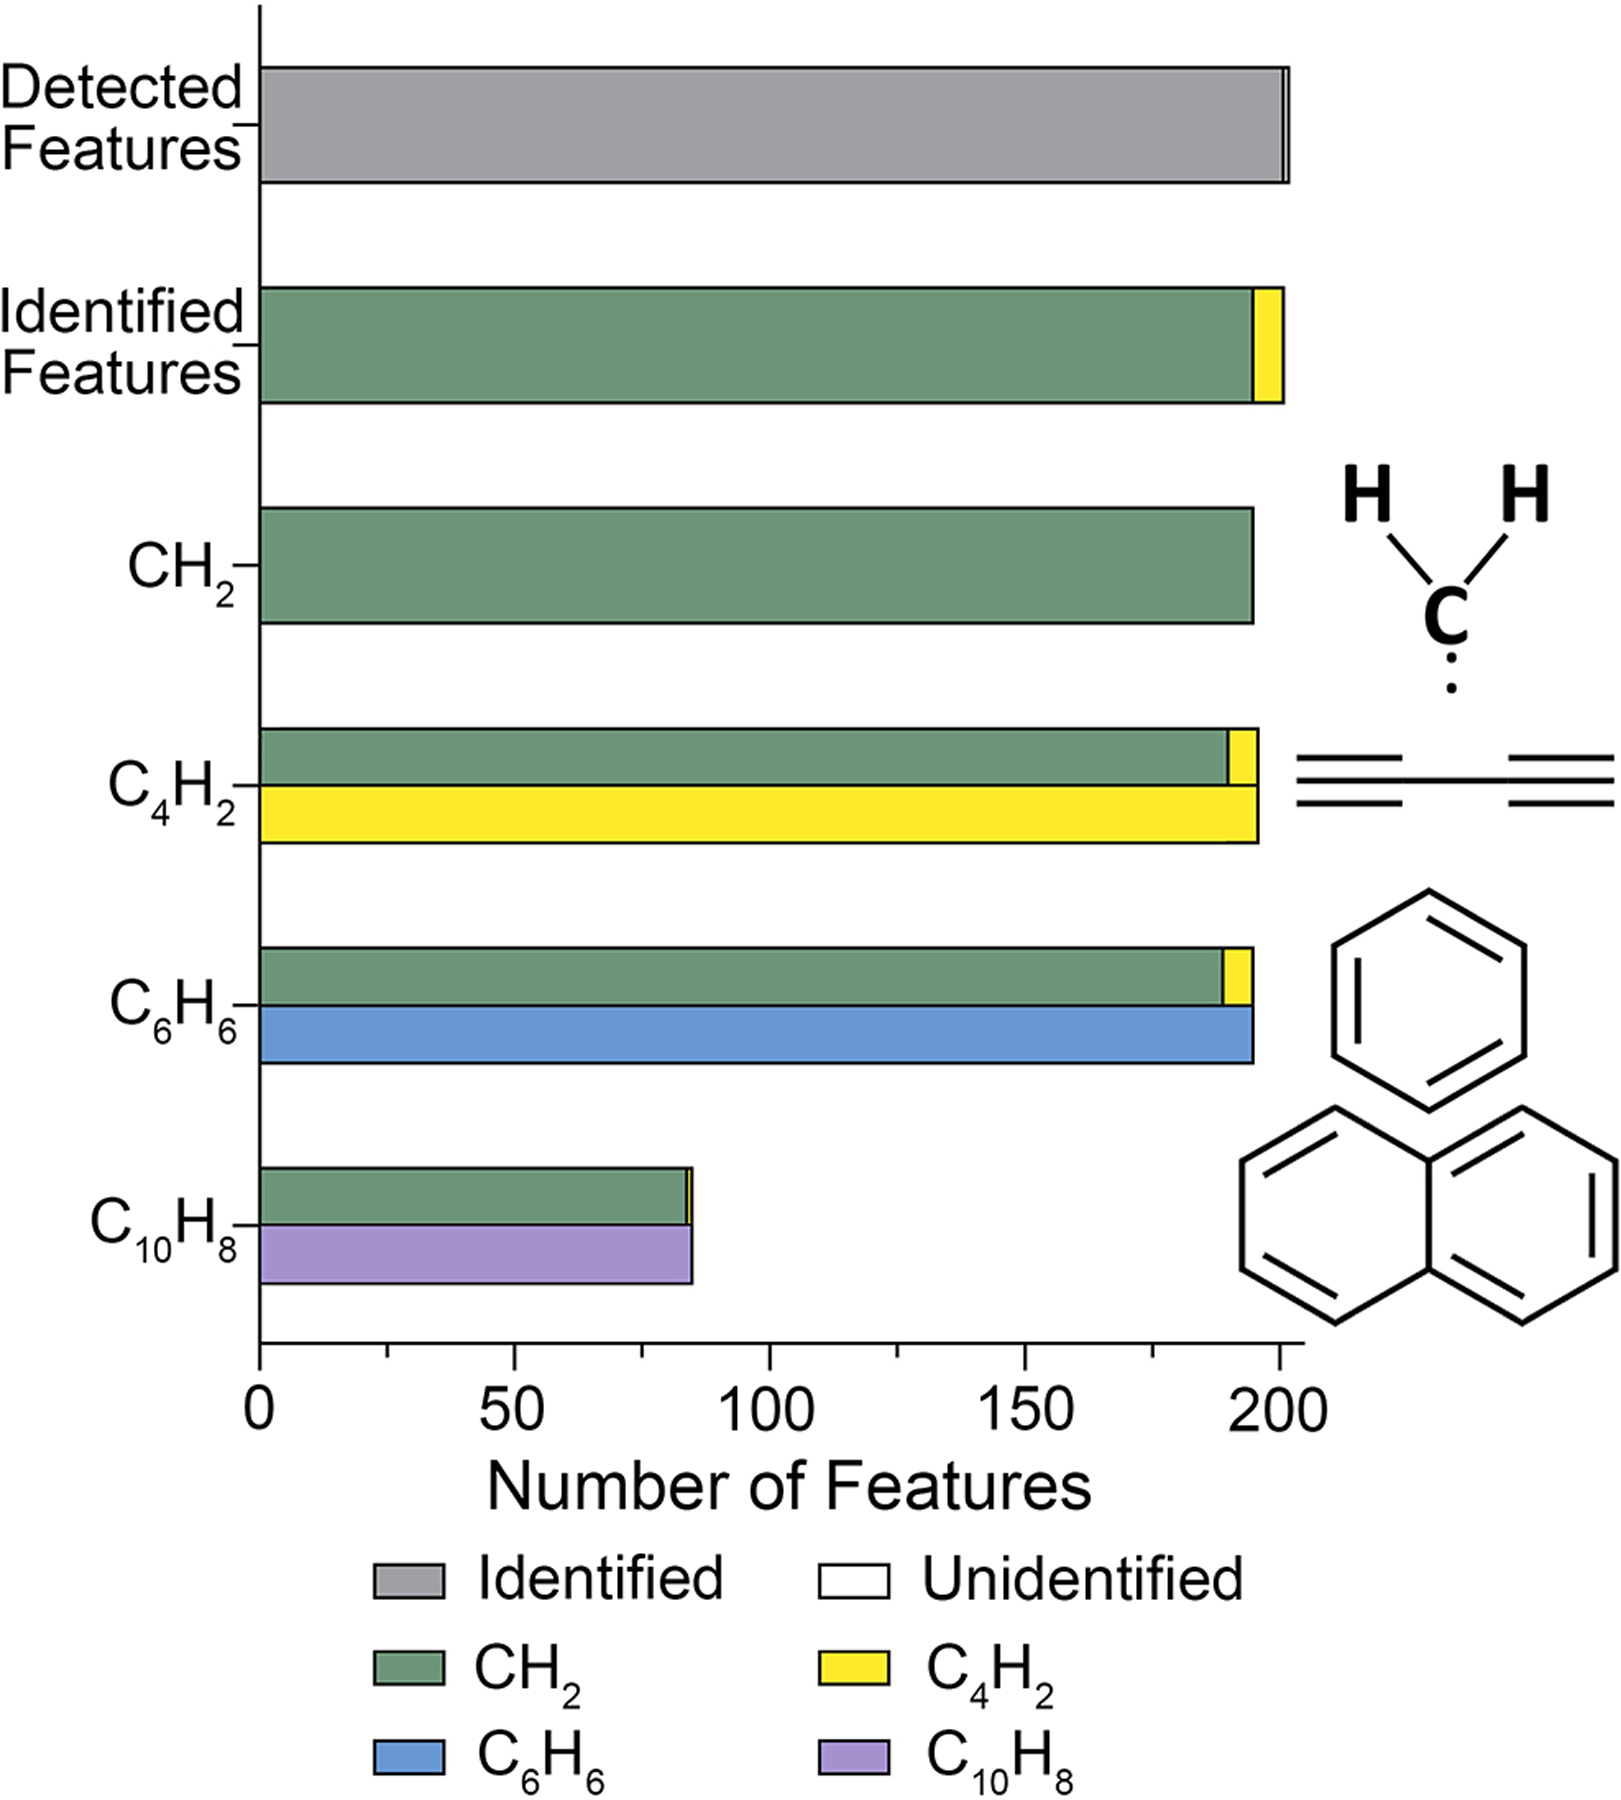
KMD evaluation of the IMS-MS data on the PIANO gasoline standard using different functional units. The filtered dataset (Supplemental Table 4) was analyzed using the IMS-MS data processing workflow (Figure 5) with different functional units (as shown, Supplemental Tables 5 and 7–9). For each analysis, the total number of features with confident molecular identification is plotted. Features identified with CH2 are shown in green and used as a reference for other functional units (see color legend). Functional unit structures are also shown.
We found that incorporation of other functional units in KMD analysis yielded similar findings regarding molecular formula assignments (Supplemental Table 12). With the C4H2 functional unit, we characterized 195 of 202 features, almost all of which were previously characterized by CH2 and 6 were unique features. Interestingly, the C6H6 and C10H8 functional units did not add to the characterizations but confirmed previously assigned formulas of 189 and 85 features, respectively. The C10H8 functional unit KMD analysis was the least informative, with the smallest contribution to molecular formula assignments (42%). Therefore, we conclude that CH2-based KMD analysis is the most time-efficient and robust approach for feature identification by molecular class, type, and hydrocarbon family. These results support our hypothesis that KMD-CH2 effectively deconvolutes the high resolution spectra associated with petroleum substances enabling detailed feature characterization and identification. The error (ppm) was calculated for all matched and assigned features (Supplemental Table 13). The average error for all molecular assignments was 2.10 ± 2.95 ppm, and all but three features fell under the defined mass tolerance that was established for DTCCSN2 library matches.
Application of the Data Processing Workflow to a Crude Oil Sample.
To further demonstrate the utility of untargeted IMS-MS and the proposed data processing workflow for analyzing very complex hydrocarbon-containing substances, we performed an analysis of a crude oil sample from Louisiana (a total of 30 357 features detected, Supplemental Table 14). Overall data processing and filtering parameters that were applied to this sample were consistent with those used for the PIANO gasoline standard to enable direct comparisons between two samples (abundance >5000, Q-score >75). The filtered IMS-MS data (a total of 1258 features, Supplemental Table 15) were visualized using different KMD plots as shown in Figure 7 and Supplemental Table 16. Both KMD-CH2 (Figure 7A, B) and KMD-H (Figure 7C, D) were plotted against m/z (Figure 7A, C) or DTCCSN2 (Figure 7B, D). As expected based on the complexity of the oil sample, a far greater number of features is displayed compared to the PIANO gasoline standard (Figure 3). In this crude oil sample data, among filtered features, there were a total of 21 that matched to the chemical standards in the DTCCSN2 library.39 The library matches included a number of petroleum biomarker molecules characteristically present in crude oils, such as 17α(H)-21β(H)-30-norhopane and 5β(H)-androstane, further demonstrating the utility of this untargeted rapid IMSMS analyses for petroleomics (Supplemental Table 16). Out of 1258 filtered features, 1200 (95%) were assigned confident molecular formulas using the data processing workflow (Figure 5).
Figure 7.
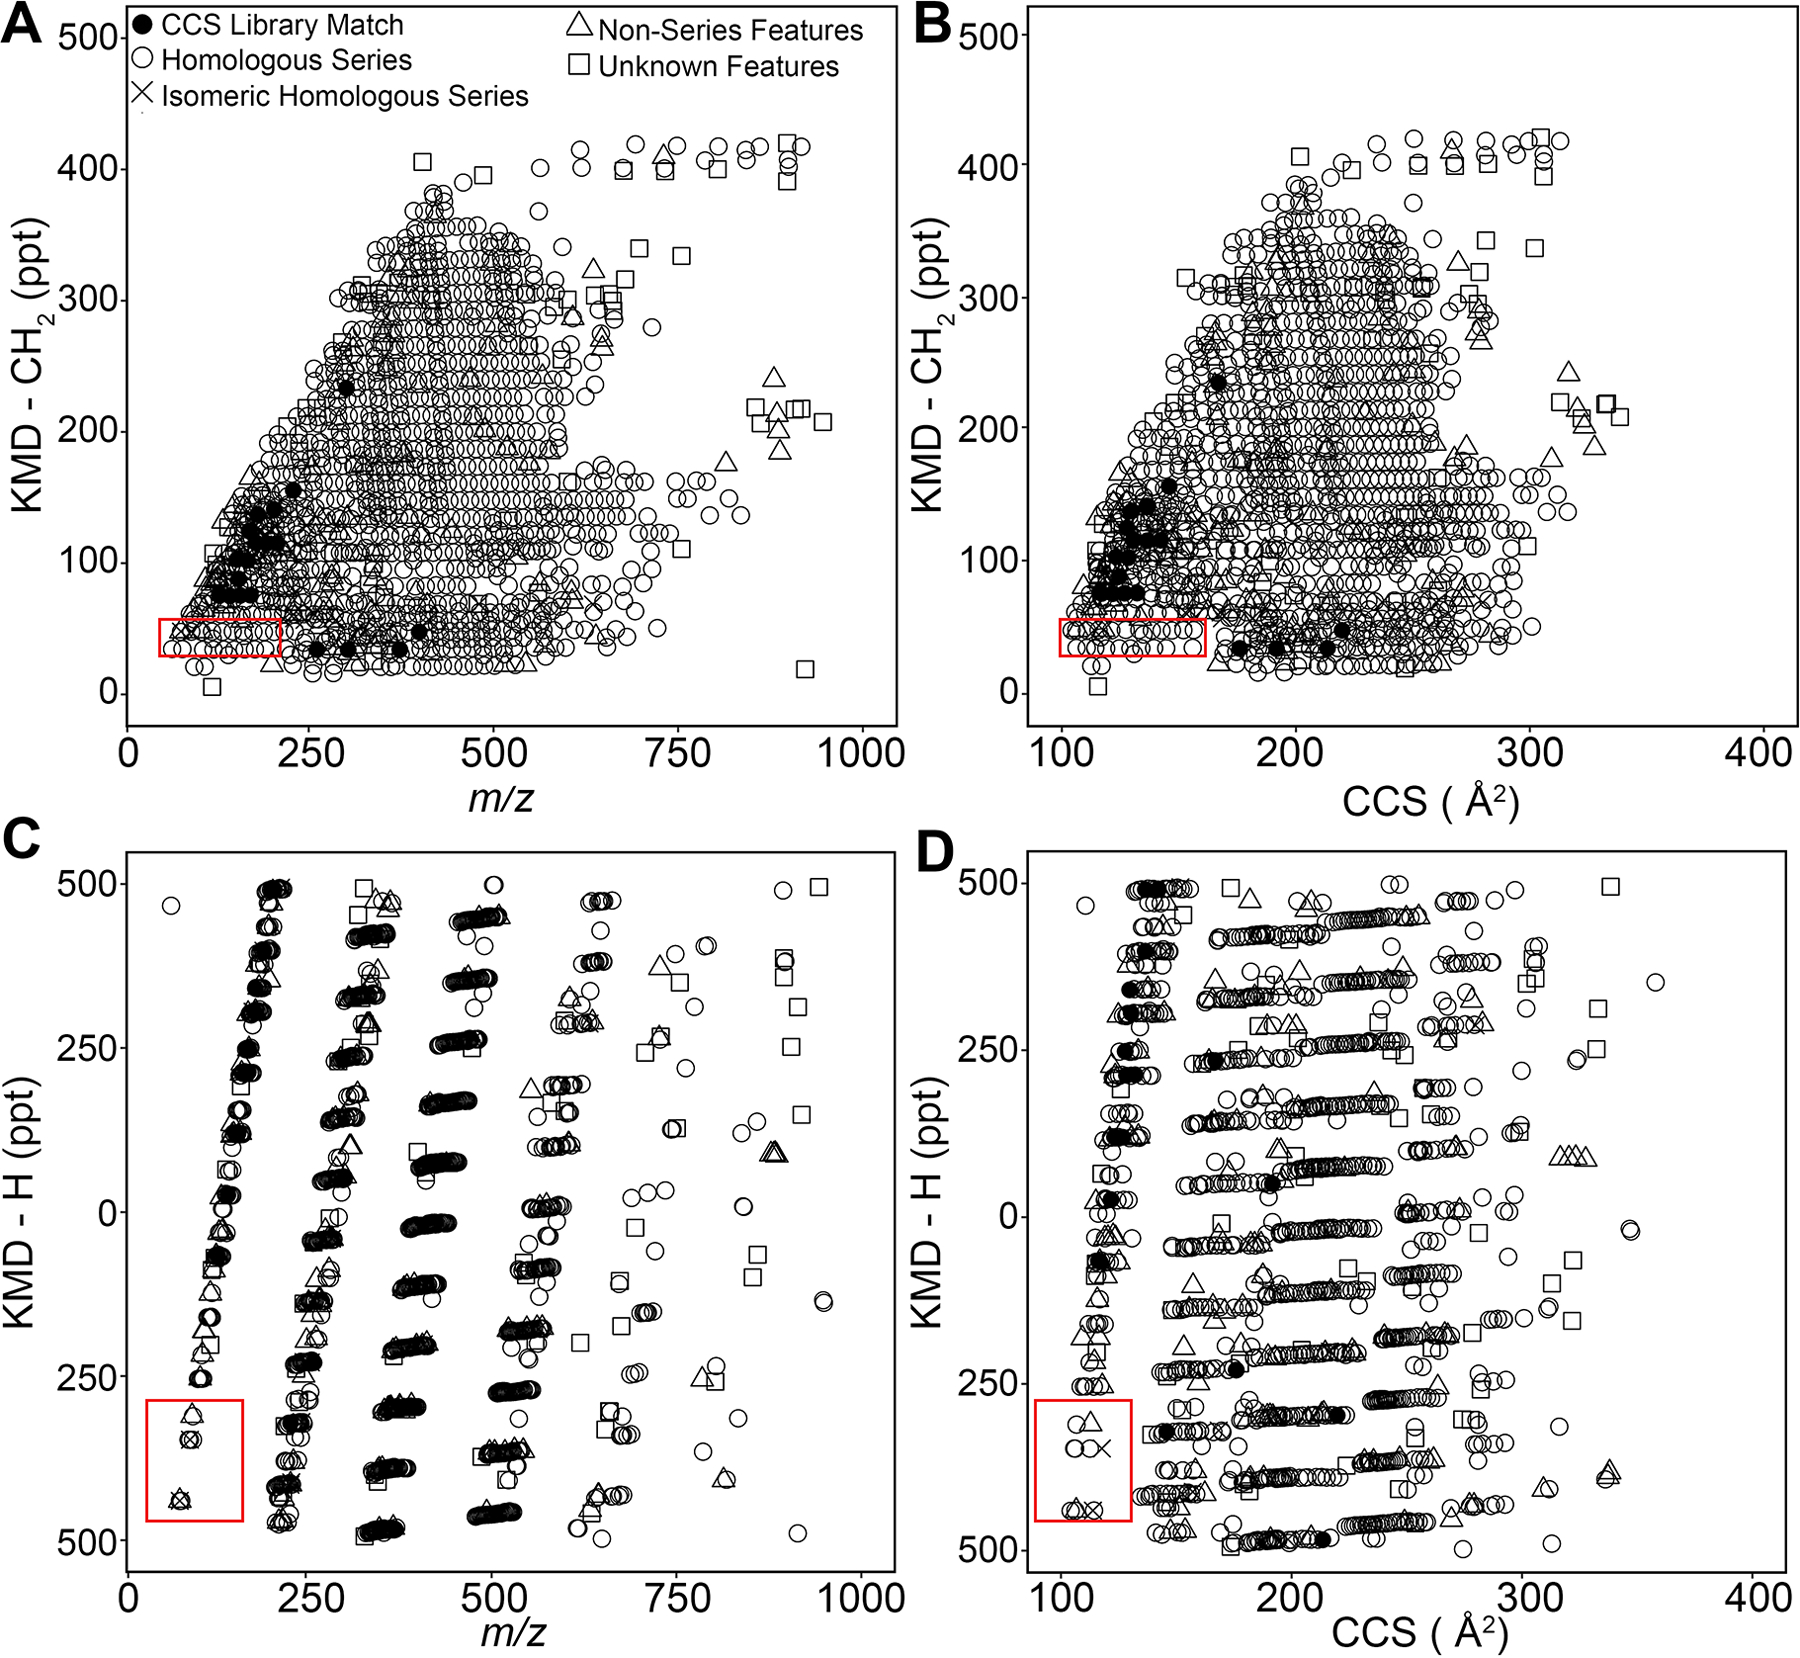
KMD analyses of IMS-MS data for a Louisiana crude oil. Features (Supplemental Table 16) were plotted for analyses using CH2 and H KMD scales. (A) KMD-CH2 vs m/z plot showing horizontal homologous series of filtered features (n = 1258). (B) KMD-CH2 vs DTCCSN2 plot shows library-matched anchor features in black (n = 24). (C) KMD-H vs m/z plot organizes homologous series by carbon number and molecular class. (D) KMD-H vs DTCCSN2 plot. Consistent with PIANO gasoline standard KMD plots (Figure 3), red rectangles (see Figure 8) depict features in isomeric series (×, n = 4), distinguishable by DTCCSN2. Elemental shifts were used to assign formulas to homologous series (open circles) from nonseries features (open triangles). Features without molecular formula assignments are shown as open squares.
As demonstrated previously with the PIANO gasoline standard (Figure 4), the additional benefit of DTCCSN2 data lies in the ability to identify isomeric compounds that are otherwise difficult to separate using MS alone. Figure 8 shows an example of isomers in the crude oil data -two pairs of ions (arrow and arrowhead) that can be separated using DTCCSN2. Overlapping at m/z of 77.0382 (arrows) and 91.0538 (arrowheads), the two pairs of ions cannot be distinguished with KMD-CH2 (Figure 8A) or KMD-H (Figure 8C) when plotted against m/z. Using DTCCSN2 values to plot these series against KMD-CH2 (Figure 8C) or KMD-H (Figure 8D), the shift in DTCCSN2 allowed us to determine these compounds are isomeric. The two-dimensional IMS-MS spectra (Figure 8E) for the isomeric pair at m/z of 77.0382 confirms the presence of two ions with the same elemental composition and separate ion mobility peaks (Δdrift time = 0.994 ms) indicating a difference in conformation.
Figure 8.
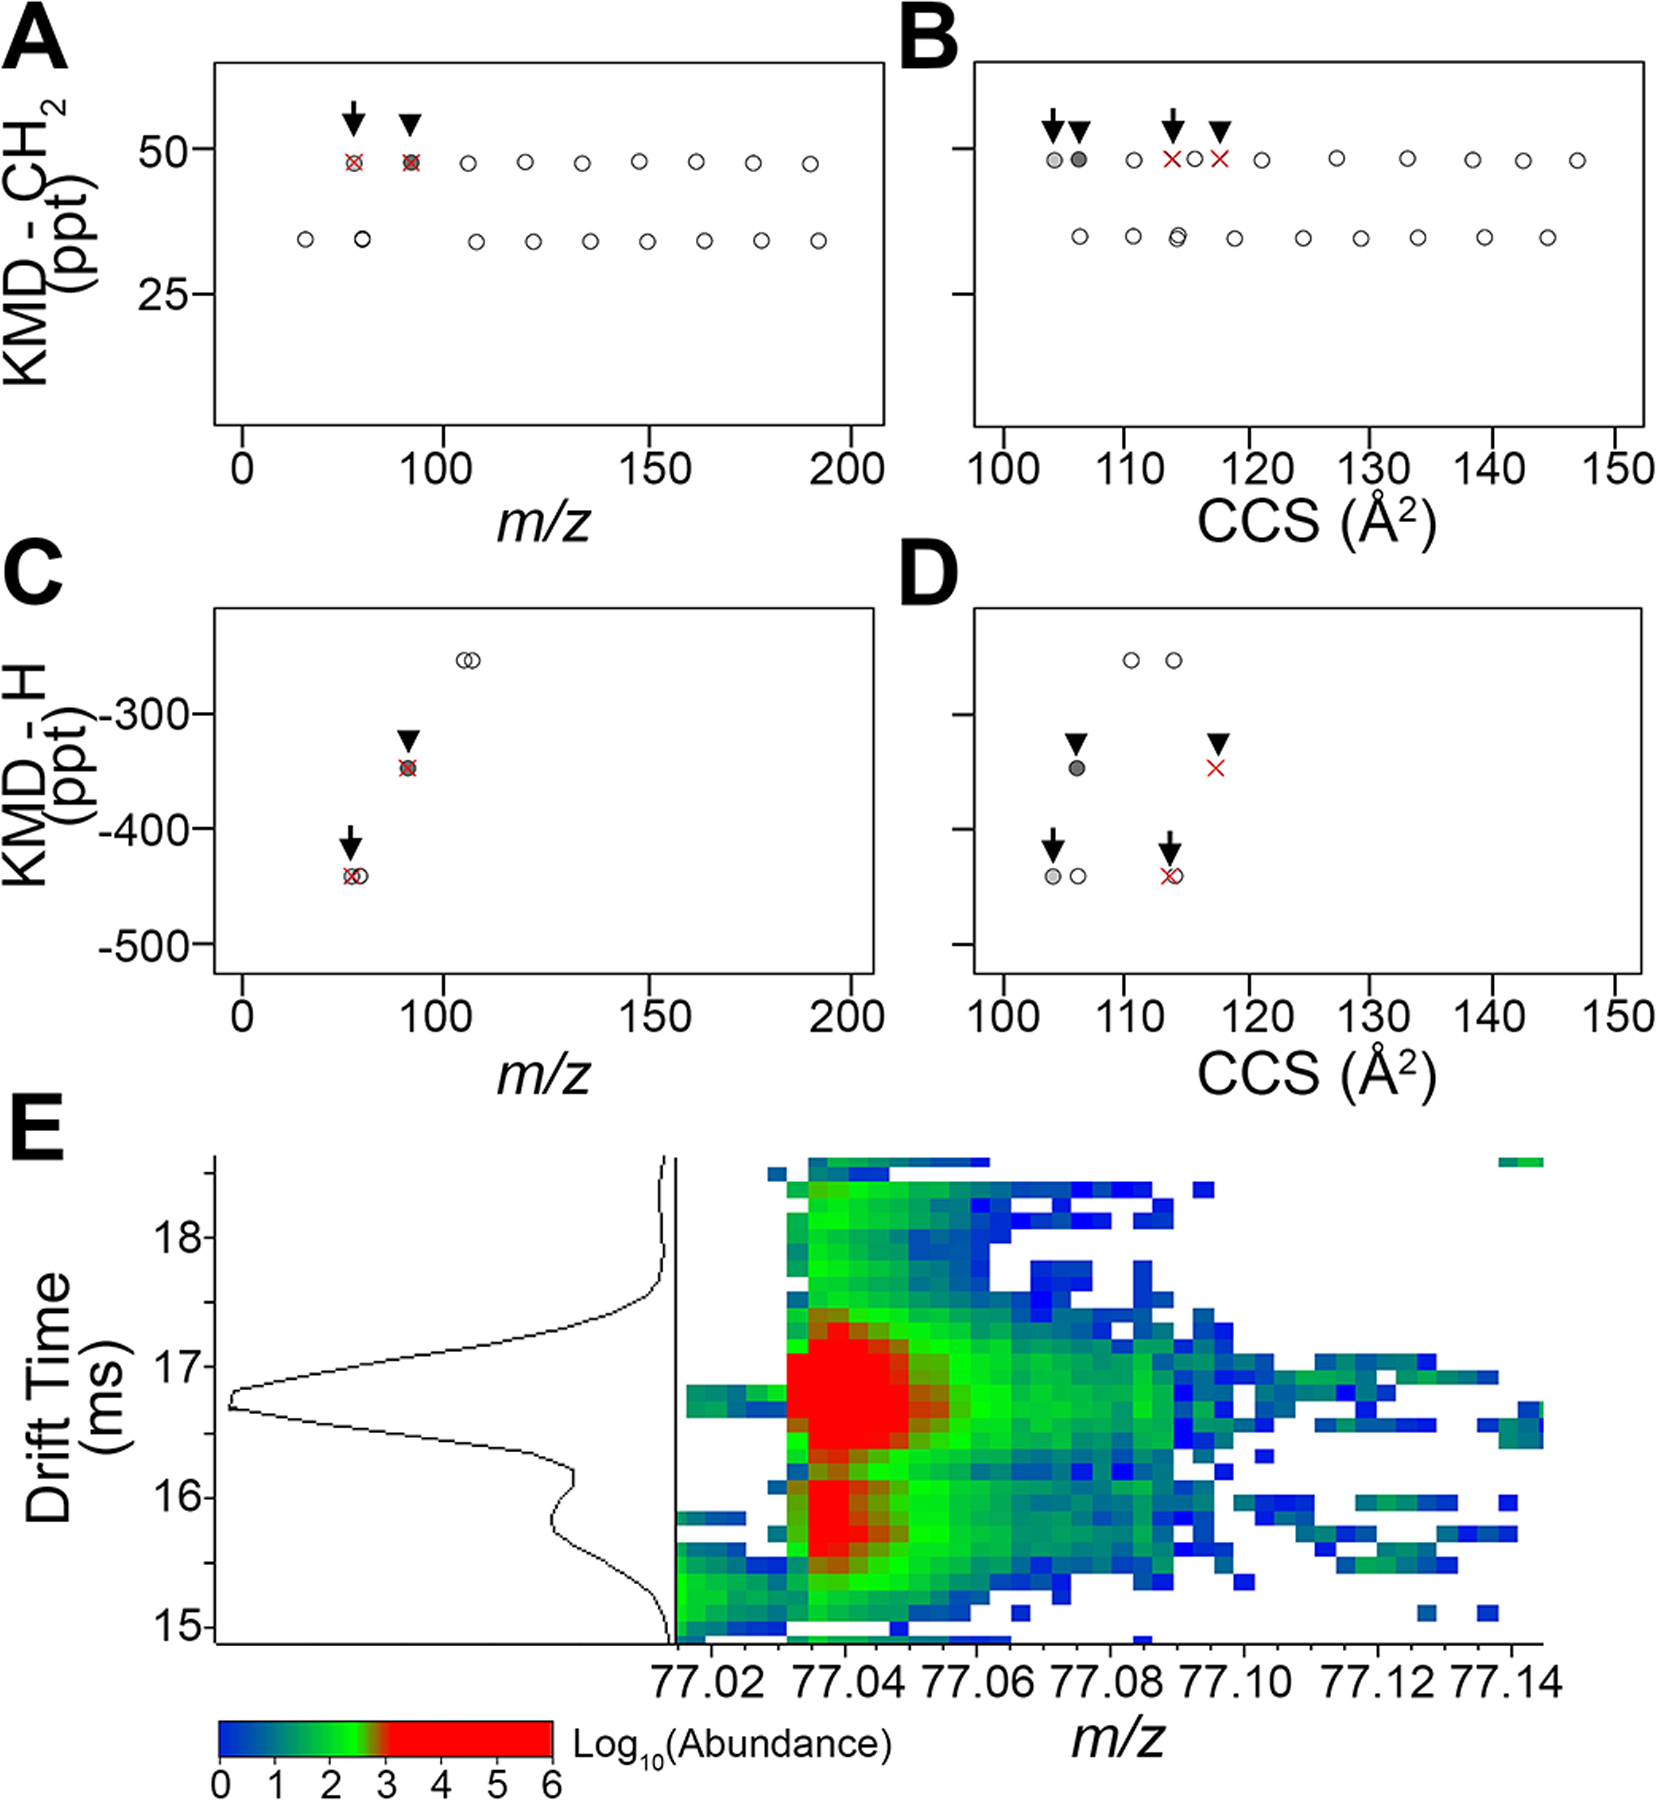
Identification of the isomeric features in Louisiana crude oil using DTCCSN2 values. Zoom-in on data from Figure 7 (red rectangles) shows two pairs of isomers: arrows (m/z 77.0382) and arrowheads (m/z 91.0538). (A) Traditional KMD-CH2 vs m/z plot shows homologous series of crude oil biomarkers with overlapping isomers. (B) KMD-CH2 vs DTCCSN2 plot shows separated isomers. (C) KMD-H vs m/z plot illustrates the same biomarker series and overlapping isomer features separated by molecular class and carbon number group. (D) KMD-H vs DTCCSN2 plot depicts discrimination between isomeric features that remain in the same carbon number groups, increasing confidence in molecular formula assignments. (E) An example of feature separation by DTCCSN2 via drift time measurements. DTCCSN2 dimension separation of features with m/z 77.0382 identified by arrows in (A−D) (light gray circle drift time 15.758 ms; red × drift time 16.752 ms).
Conclusion.
Overall, this study presents a novel data analysis workflow that can be used to considerably expand the utility of IMS-MS as a rapid untargeted technique for rapid analysis of petroleum derived complex samples. While multidimensional data from IMS-MS and other high-resolution MS methods are informative with respect to fingerprinting and source identification, more detailed characterization of the molecular composition of these samples is needed to inform human and environmental risk assessments. Here, the traditional KMD-based analyses6 were combined with the additional KMD analysis using H unit, and structure confirmation verification step based on DTCCSN2, an orthogonal metric that is critical for confident feature identification in untargeted analyses.31,44
This study also addresses the analytical challenges posed by petroleum substance complexity. Traditional GC-MS analysis of petroleum samples requires several involved steps, including peak integration and cross-reference with multiple libraries and references for data interpretation. The untargeted IMS-MS analysis followed by the proposed workflow is of particular relevance to the characterization of complex petroleum substances, such as a PIANO gasoline standard or a crude oil, as it uses CH2 and H functional units that allows for confident characterization of ∼95% of the high abundance features. This study also opens new applications for IMS-MS and the proposed data processing workflow for the analysis of samples in complex matrices (i.e., environmental contaminants, complex mixtures, etc.). Modifications to the workflow can be made at user discretion, including other instrumental couplings (LC-IMS-MS), choice of ionization source(s), or the selection of study-specific data filtering workflows or other KMD functional units.
There are a number of limitations to the proposed approach. First, while this approach is suitable for molecular fingerprinting analysis of complex petroleum substances, caution is needed in terms of confidence in formula assignments because of the inherent imprecision in mass accuracy especially as the mass of the molecules increases. Second, the exclusion of low molecular weight compounds with defined parameters is another limitation; detection of smaller and heteroatomic sample fractions may be addressed through the use of other sample ionization techniques. Third, future work to streamline and automate this data analysis workflow is needed to develop a user-friendly software application.
Supplementary Material
References
- (1).Clark CR; McKee RH; Freeman JJ; Swick D; Mahagaokar S; Pigram G; Roberts LG; Smulders CJ; Beatty PW A GHS-consistent approach to health hazard classification of petroleum substances, a class of UVCB substances. Regul Toxicol Pharmacol 2013, 67, 409–20. [DOI] [PubMed] [Google Scholar]
- (2).Grimm FA; Russell WK; Luo YS; Iwata Y; Chiu WA; Roy T; Boogaard PJ; Ketelslegers HB; Rusyn I Grouping of Petroleum Substances as Example UVCBs by Ion Mobility-Mass Spectrometry to Enable Chemical Composition-Based Read-Across. Environ Sci Technol 2017, 51, 7197–7207. [DOI] [PMC free article] [PubMed] [Google Scholar]
- (3).Onel M; Beykal B; Ferguson K; Chiu WA; McDonald TJ; Zhou L; House JS; Wright FA; Sheen DA; Rusyn I; Pistikopoulos EN Grouping of complex substances using analytical chemistry data: A framework for quantitative evaluation and visualization. PLoS One 2019, 14, e0223517. [DOI] [PMC free article] [PubMed] [Google Scholar]
- (4).ECHA, Read-Across Assessment Framework (RAAF) - considerations on multi-constituent substances and UVCBs European Chemical Agency: Helsinki, Finland, 2017. [Google Scholar]
- (5).CONCAWE REACH – Analytical characterisation of petroleum UVCB substances; Brussels, Belgium, 2012. [Google Scholar]
- (6).Palacio Lozano DC; Thomas MJ; Jones HE; Barrow MP Petroleomics: Tools, Challenges, and Developments. Annu Rev Anal Chem (Palo Alto Calif) 2020, 13, 405–430. [DOI] [PubMed] [Google Scholar]
- (7).Hsu CS; Hendrickson CL; Rodgers RP; McKenna AM; Marshall AG Petroleomics: advanced molecular probe for petroleum heavy ends. J Mass Spectrom 2011, 46, 337–43. [DOI] [PubMed] [Google Scholar]
- (8).Marshall AG; Rodgers RP Petroleomics: the next grand challenge for chemical analysis. Acc Chem Res 2004, 37, 53–9. [DOI] [PubMed] [Google Scholar]
- (9).Niyonsaba E; Manheim JM; Yerabolu R; Kenttamaa HI Recent Advances in Petroleum Analysis by Mass Spectrometry. Anal Chem 2019, 91, 156–177. [DOI] [PubMed] [Google Scholar]
- (10).Frysinger GS; Gaines RB Comprehensive two-dimensional gas chromatography with mass spectrometric detection (GC x GC/MS) applied to the analysis of petroleum. J High Resol Chromatogr 1999, 22, 251–255. [Google Scholar]
- (11).Daling PS; Faksness LG; Hansen AB; Stout SA Improved and Standardized Methodology for Oil Spill Fingerprinting. Environ Forensics 2002, 3, 263–278. [Google Scholar]
- (12).Stout SA; Wang Z, Standard Handbook Oil Spill Environmental Forensics: Fingerprinting and Source Identification 2 ed.; Academic Press: 2016. [Google Scholar]
- (13).Xian F; Hendrickson CL; Marshall AG High resolution mass spectrometry. Anal Chem 2012, 84, 708–19. [DOI] [PubMed] [Google Scholar]
- (14).Marshall AG; Hendrickson CL High-resolution mass spectrometers. Annu Rev Anal Chem 2008, 1, 579–99. [DOI] [PubMed] [Google Scholar]
- (15).Palacio Lozano DC; Gavard R; Arenas-Diaz JP; Thomas MJ; Stranz DD; Mejia-Ospino E; Guzman A; Spencer SEF; Rossell D; Barrow MP Pushing the analytical limits: new insights into complex mixtures using mass spectra segments of constant ultrahigh resolving power. Chem Sci 2019, 10, 6966–6978. [DOI] [PMC free article] [PubMed] [Google Scholar]
- (16).Gabelica V; Shvartsburg AA; Afonso C; Barran P; Benesch JLP; Bleiholder C; Bowers MT; Bilbao A; Bush MF; Campbell JL; Campuzano IDG; Causon T; Clowers BH; Creaser CS; De Pauw E; Far J; Fernandez-Lima F; Fjeldsted JC; Giles K; Groessl M; Hogan CJ Jr.; Hann S; Kim HI; Kurulugama RT; May JC; McLean JA; Pagel K; Richardson K; Ridgeway ME; Rosu F; Sobott F; Thalassinos K; Valentine SJ; Wyttenbach T Recommendations for reporting ion mobility Mass Spectrometry measurements. Mass Spectrom Rev 2019, 38, 291–320. [DOI] [PMC free article] [PubMed] [Google Scholar]
- (17).Zheng X; Dupuis KT; Aly NA; Zhou Y; Smith FB; Tang K; Smith RD; Baker ES Utilizing ion mobility spectrometry and mass spectrometry for the analysis of polycyclic aromatic hydrocarbons, polychlorinated biphenyls, polybrominated diphenyl ethers and their metabolites. Anal Chim Acta 2018, 1037, 265–273. [DOI] [PMC free article] [PubMed] [Google Scholar]
- (18).Ruger CP; Le Maitre J; Maillard J; Riches E; Palmer M; Afonso C; Giusti P Exploring Complex Mixtures by Cyclic Ion Mobility High-Resolution Mass Spectrometry: Application Toward Petroleum. Anal Chem 2021, 93, 5872–5881. [DOI] [PubMed] [Google Scholar]
- (19).Farenc M; Corilo YE; Lalli PM; Riches E; Rodgers RP; Afonso C; Giusti P Comparison of Atmospheric Pressure Ionization for the Analysis of Heavy Petroleum Fractions with Ion Mobility-Mass Spectrometry. Energy Fuels 2016, 30, 8896–8903. [Google Scholar]
- (20).Kendrick E A Mass Scale Based on CH2 = 14.0000 for High Resolution Mass Spectrometry of Organic Compounds. Anal Chem 1963, 35, 2146–2154. [Google Scholar]
- (21).Koch BP; Dittmar T From mass to structure: an aromaticity index for high-resolution mass data of natural organic matter. Rapid Commun Mass Spectrom 2006, 20, 926–932. [Google Scholar]
- (22).van Krevelen DW Graphical-statistical method for the study of structure and reaction processes of coal. Fuel 1950, 29, 269–284. [Google Scholar]
- (23).Hughey CA; Hendrickson CL; Rodgers RP; Marshall AG; Qian K Kendrick mass defect spectrum: a compact visual analysis for ultrahigh-resolution broadband mass spectra. Anal Chem 2001, 73, 4676–81. [DOI] [PubMed] [Google Scholar]
- (24).Islam A; Cho Y; Ahmed A; Kim S Data Interpretation Methods for Petroleomics. Mass Spectrom Lett 2012, 3, 63–67. [DOI] [PubMed] [Google Scholar]
- (25).Zheng Q; Morimoto M; Sato H; Fouquet T Resolution-enhanced Kendrick mass defect plots for the data processing of mass spectra from wood and coal hydrothermal extracts. Fuel 2019, 235, 944–953. [Google Scholar]
- (26).Fouquet T; Sato H How to choose the best fractional base unit for a high-resolution Kendrick mass defect analysis of polymer ions. Rapid Commun Mass Spectrom 2017, 31, 1067–1072. [DOI] [PubMed] [Google Scholar]
- (27).Cody RB; Fouquet T “Reverse Kendrick Mass Defect Analysis”: Rotating Mass Defect Graphs to Determine Oligomer Compositions for Homopolymers. Anal Chem 2018, 90, 12854–12860. [DOI] [PubMed] [Google Scholar]
- (28).Myers AL; Jobst KJ; Mabury SA; Reiner EJ Using mass defect plots as a discovery tool to identify novel fluoropolymer thermal decomposition products. J Mass Spectrom 2014, 49, 291–296. [DOI] [PubMed] [Google Scholar]
- (29).Koch BP; Dittmar T; Witt M; Kattner G Fundamentals of molecular formula assignment to ultrahigh resolution mass data of natural organic matter. Anal Chem 2007, 79, 1758–63. [DOI] [PubMed] [Google Scholar]
- (30).Ibrahim YM; Garimella SV; Prost SA; Wojcik R; Norheim RV; Baker ES; Rusyn I; Smith RD Development of an Ion Mobility Spectrometry-Orbitrap Mass Spectrometer Platform. Anal Chem 2016, 88, 12152–12160. [DOI] [PMC free article] [PubMed] [Google Scholar]
- (31).Dodds JN; Baker ES Ion Mobility Spectrometry: Fundamental Concepts, Instrumentation, Applications, and the Road Ahead. J Am Soc Mass Spectrom 2019, 30, 2185–2195. [DOI] [PMC free article] [PubMed] [Google Scholar]
- (32).Maire F; Neeson K; Denny R; McCullagh M; Lange C; Afonso C; Giusti P Identification of ion series using ion mobility mass spectrometry: the example of alkyl-benzothiophene and alkyl-dibenzothiophene ions in diesel fuels. Anal Chem 2013, 85, 5530–4. [DOI] [PubMed] [Google Scholar]
- (33).Ahmed A; Cho YJ; No MH; Koh J; Tomczyk N; Giles K; Yoo JS; Kim S Application of the Mason-Schamp equation and ion mobility mass spectrometry to identify structurally related compounds in crude oil. Anal Chem 2011, 83, 77–83. [DOI] [PubMed] [Google Scholar]
- (34).Ponthus J; Riches E Evaluating the multiple benefits offered by ion mobility-mass spectrometry in oil and petroleum analysis. Int J Ion Mobil Spec 2013, 16, 95–103. [Google Scholar]
- (35).Lalli PM; Corilo YE; Rowland SJ; Marshall AG; Rodgers RP Isomeric Separation and Structural Characterization of Acids in Petroleum by Ion Mobility Mass Spectrometry. Energy Fuels 2015, 29, 3626–3633. [Google Scholar]
- (36).Farenc M; Benoit P; S., M.; Riches E; Afonso C; Giusti P Effective Ion Mobility Peak Width as a New Isomeric Descriptor for the Untargeted Analysis of Complex Mixtures Using Ion Mobility-Mass Spectrometry. J Am Soc Mass Spectrom 2017, 28, 2476–82. [DOI] [PubMed] [Google Scholar]
- (37).Adams KJ; Montero D; Aga D; Fernandez-Lima F Isomer Separation of Polybrominated Diphenyl Ether Metabolites using nanoESI-TIMS-MS. Int J Ion Mobil Spectrom 2016, 19, 69–76. [DOI] [PMC free article] [PubMed] [Google Scholar]
- (38).Stow SM; Causon TJ; Zheng X; Kurulugama RT; Mairinger T; May JC; Rennie EE; Baker ES; Smith RD; McLean JA; Hann S; Fjeldsted JC An Interlaboratory Evaluation of Drift Tube Ion Mobility-Mass Spectrometry Collision Cross Section Measurements. Anal Chem 2017, 89, 9048–9055. [DOI] [PMC free article] [PubMed] [Google Scholar]
- (39).Baker ES, Collision Cross Section database 2021. https://brcwebportal.cos.ncsu.edu/baker/ [accessed May 15, 2021]. [Google Scholar]
- (40).Santos JM; Galaverna RD; Pudenzi MA; Schmidt EM; Sanders NL; Kurulugama RT; Mordehai A; Stafford GC; Wisniewski A; Eberlin MN Petroleomics by ion mobility mass spectrometry: resolution and characterization of contaminants and additives in crude oils and petrofuels. Anal Methods 2015, 7, 4450–4463. [Google Scholar]
- (41).Roman-Hubers AT; McDonald TJ; Baker ES; Chiu WA; Rusyn I A comparative analysis of analytical techniques for rapid oil spill identification. Environ Toxicol Chem 2021, 40, 1034–1049. [DOI] [PMC free article] [PubMed] [Google Scholar]
- (42).McKee RH; White R The mammalian toxicological hazards of petroleum-derived substances: an overview of the petroleum industry response to the high production volume challenge program. Int J Toxicol 2014, 33, 4S–16S. [DOI] [PubMed] [Google Scholar]
- (43).Hsu CS; Lobodin VV; Rodgers RP; McKenna AM; Marshall AG Compositional Boundaries for Fossil Hydrocarbons. Energy Fuels 2011, 25, 2174–2178. [Google Scholar]
- (44).Mairinger T; Causon TJ; Hann S The potential of ion mobility-mass spectrometry for non-targeted metabolomics. Curr Opin Chem Biol 2018, 42, 9–15. [DOI] [PubMed] [Google Scholar]
Associated Data
This section collects any data citations, data availability statements, or supplementary materials included in this article.


