Abstract
Programmed cell death protein 1 (PD-1) is a crucial anticancer target, but the relatively low response rate and acquired resistance to existing antibody drugs highlight an urgent need to develop alternative targeting strategies. Here, we report the palmitoylation of PD-1, discover the main DHHC enzyme for this modification, reveal the mechanism of its effect on PD-1 protein stability, and rationally develop a peptide for targeting PD-1 expression. Palmitoylation promoted the trafficking of PD-1 to the recycling endosome, thus preventing its lysosome-dependent degradation. Palmitoylation of PD-1, but not of PD-L1, promoted mTOR signaling and tumor cell proliferation, and targeting palmitoylation displayed significant anti-tumor effects in a three-dimensional culture system. A peptide was designed to competitively inhibit PD-1 palmitoylation and expression, opening a new route for developing PD-1 inhibitors and combinatorial cancer immunotherapy.
We show for the first time that PD-1 is palmitoylated, identify DHHC9 as the predominant enzyme for its palmitoylation, and reveal the molecular mechanisms underlying its effects on PD-1 stability and functions. Importantly, we also designed PD1-PALM, a competitive inhibitor of PD-1 palmitoylation, and this first-in-class molecule may inspire the development of new checkpoint inhibitors.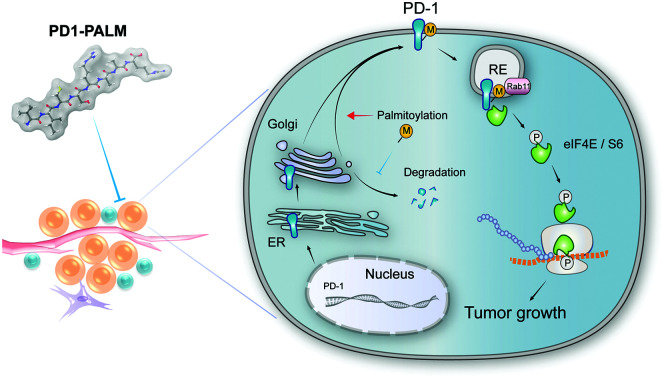
Introduction
Programmed death protein 1 (PD-1) and its two natural ligands PD-L1 and PD-L2 deliver inhibitory signals to regulate the balance between T cell activation, tolerance, and immunopathology. PD-1 is expressed on the surface of activated T cells as an inhibitory receptor,1 while its ligands PD-L1 and PD-L2 are mainly expressed in antigen-presenting cells and tumor cells.2 PD-1 downstream signaling includes the suppression of T cell proliferation, cytokine production, and cytotoxic functions. Therapeutic antibodies targeting PD-1 have displayed remarkable anti-tumor efficacy. However, most patients do not show durable remission, and some tumors have been completely refractory to the therapy,3 highlighting the need for further understanding the regulation of PD-1.4
Recent studies revealed the intrinsic expression of PD-1 in melanoma,5 liver cancer6 and other cancers.7 In these cases, PD-1 can modulate mTOR signaling and promote tumor growth independently of the adaptive immune system.5,6 In tumor cells, PD-1 was found to promote tumor growth even in the absence of the functional adaptive immune system, which involved the increased phosphorylation of ribosomal protein S6 (RPS6) and eIF4E as effectors of the mammalian target of rapamycin (mTOR) signaling.5,6
Palmitoylation is typically the covalent attachment of palmitic acid to the cysteine of membrane proteins, which serves as a mechanism to regulate protein localization and function.8–10 Palmitoylation may be catalyzed by a family of aspartate–histidine–histidine–cysteine (DHHC) acyltransferases, which display different specificities to existing substrates such as Ras, EGFR, Wnt, and Shh.11 Recently, we found that PD-L1 palmitoylation by DHHC3 stabilizes PD-L1 through the suppression of ubiquitination and lysosomal degradation.12 However, it has not been reported previously whether palmitoylation may play a role in the regulation of PD-1, including its intrinsic expression and functions in tumor cells. Here, we report that PD-1 is palmitoylated at the Cys192 residue by the DHHC9 acetyltransferase, and this chemical modification promotes PD-1 expression and intrinsic signaling to promote cancer cell growth. These findings may provide new insights into the regulation of PD-1 and provide additional strategies for targeting this key immune checkpoint pathway.
Results
PD-1 is palmitoylated at Cys192
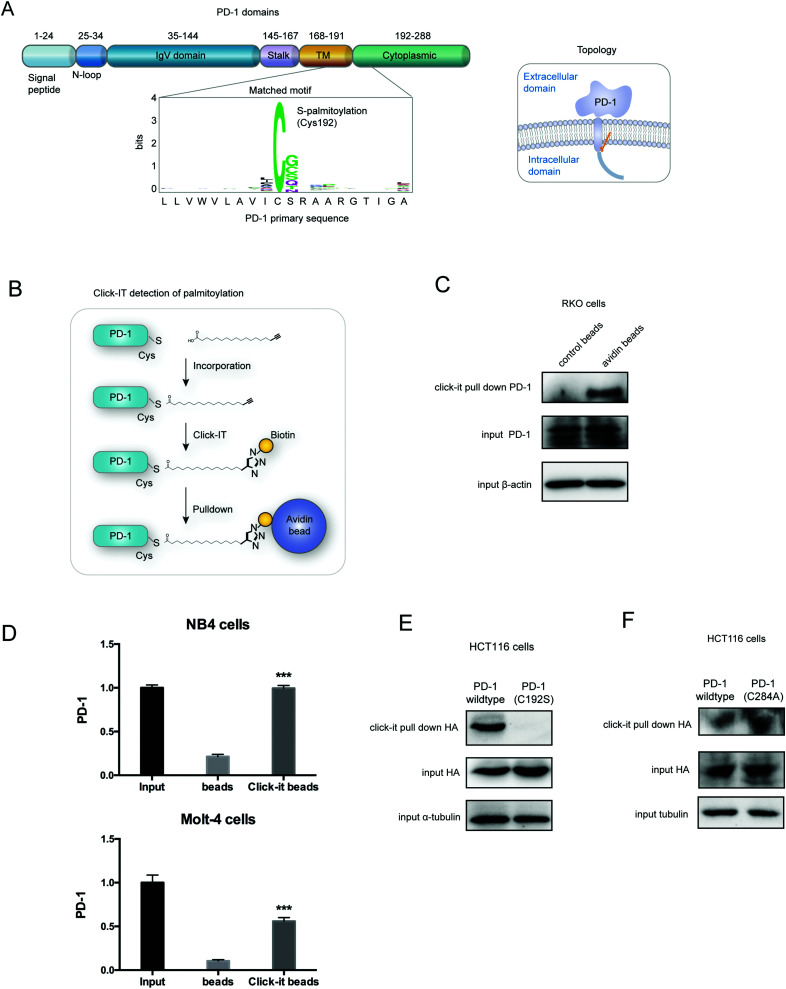
Palmitoylation is an established post-transcriptional modification regulating the abundance of various cancer-associated proteins,13 but PD-1, a key immunocancer target, was never reported to be palmitoylated. To identify a putative S-palmitoylation site on PD-1, we performed an in silico motif-based prediction using the MDD-Palm algorithm.14 The results indicated that the Cys192 residue joins the transmembrane domain and cytosolic part of PD-1, resembling a typical membrane protein's palmitoylation site and matching a previously characterized palmitoylation motif15 (Fig. 1A). To directly experimentally validate the palmitoylation of PD-1, we performed a palmitoylation-specific pulldown assay via Click-iT labeling16 on endogenous PD-1. Briefly, cultured cells were fed with azidopalmitate as a source of palmitic acid. Proteins were harvested and labeled with biotin alkyne, followed by streptavidin pull-down and immunoblotting using an antibody specific to the protein of interest (schematics shown in Fig. 1B). We were able to successfully obtain a reliable signal when we used the anti-PD-1 antibody in protein extracted from RKO cells (Fig. 1C), NB4 cells and Molt-4 cells (Fig. 1D, representative blots shown in Fig. S1A, ESI†). To probe the impact of palmitoylation on PD-1, we took advantage of 2-bromopalmitate (2-BP) and Palmostatin-B (PalmB), the general inhibitor of palmitoylation or de-palmitoylation, respectively.17 Treatment of RKO and A375 cells using 2-bromopalmitate (inhibitor) and Palmostatin-B (agonist) respectively decreased and increased the abundance of PD-1 palmitoylation in both cell lines (Fig. S1B, ESI†). Thus, this assay confirmed the palmitoylation of endogenous PD-1 protein. To directly validate the palmitoylation of PD-1 at the residue Cys192, we engineered a mutant version of PD-1 at position 192 (Cys192Ser) and challenged its capacity to be palmitoylated via Click-iT chemistry. As expected, replacing the Cys192 for a serine blocked the palmitoylation of PD-1 (Fig. 1E), indicating that the residue Cys192 is a palmitoylation site and most probably the only site for PD-1 palmitoylation. As a control, the substitution of Cys284 (not predicted as a palmitoylation site) to alanine caused no change in the palmitoylation of PD-1 (Fig. 1F).
Fig. 1. PD-1 is palmitoylated at C192. (A) Prediction of the PD-1 palmitoylation site at Cys192 using the MDD-Palm algorithm, with the matched motif in the inset and topology model on the right. (B) Schematic representation of the Click-IT procedure used to detect PD-1 palmitoylated proteins. (C and D) Click-IT assay in RKO, NB4 and Molt-4 cells showing the palmitoylation level of endogenous PD-1 in the three tumor cells. *** P < 0.001, ANOVA test. n = 3 independent experiments. (E) Click-IT was performed on cells transiently expressing wildtype PD-1 or Cys192Ser (C192S) mutated PD-1 to demonstrate that no palmitoylation was detected in the C192S PD-1 mutant. (F) Click-IT was performed on cells transiently expressing wildtype PD-1 or Cys284Ala (C284A) mutated PD-1 to demonstrate that no palmitoylation change was detected in the C284A PD-1 mutant.
Palmitoylation of PD-1 stabilizes its protein level
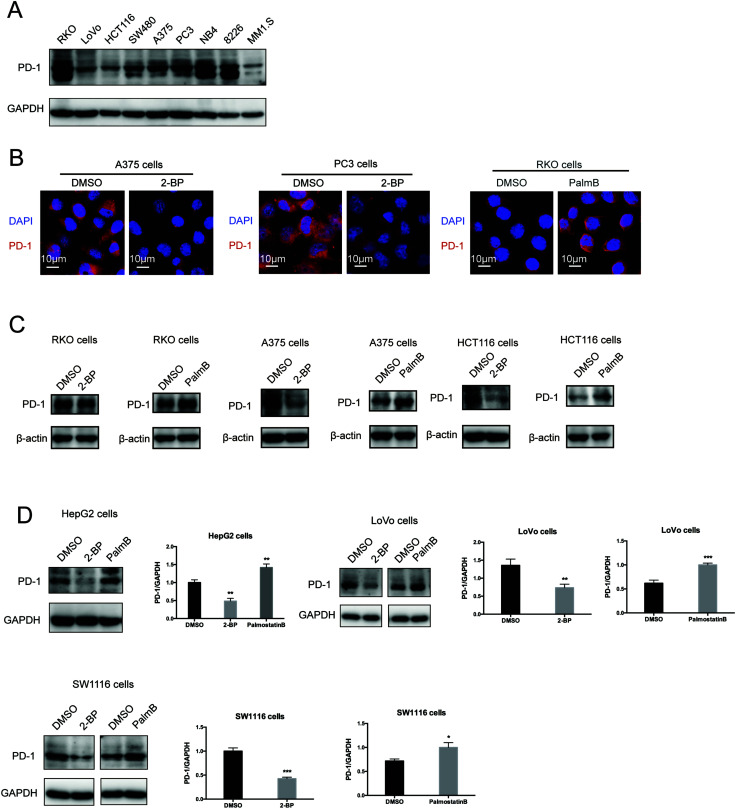
Then, we tested the effects of palmitoylation on PD-1 expression. PD-1 is abundantly expressed in many cancer cell lines (Fig. 2A and Fig. S2, ESI†). Treating A375 or PC3 cells with 2-BP significantly decreased the PD-1 protein level and reduced its location on the cell membrane, while Palmostatin-B increased PD-1 expression on the cytomembrane judged by immunofluorescence (Fig. 2B). Western blotting confirmed that treating RKO, A375, HCT116, HepG2, LoVo and SW1116 cells with 2-BP or PalmB respectively decreased and increased PD-1 protein expression (Fig. 2C and D). Thus, palmitoylation regulates the protein level of PD-1 and is one of the mechanisms by which cancer cells maintain a high level of PD-1.
Fig. 2. Palmitoylation of PD-1 stabilizes its protein level. (A) Expression of PD-1 in a panel of cancer cell lines by Western blot using the anti-PD-1 specific antibody. (B) The expression and cell membrane localization of PD-1 are reduced in cells treated with 2-BP (palmitoylation inhibitor) while they increased in cells treated with PalmB (palmitoylation agonist), as shown by immunofluorescence. Images represent one of three independent experiments. Scale bars, 10 μm. (C and D) The treatment with 2-BP and PalmB, respectively, decreased and increased PD-1 expression in RKO, A375, HCT116, HepG2, LoVo, and SW1116 cells. *** P < 0.001, ** P < 0.01, * P < 0.05, ANOVA test. n = 3 independent experiments.
PD-1 is palmitoylated by DHHC9
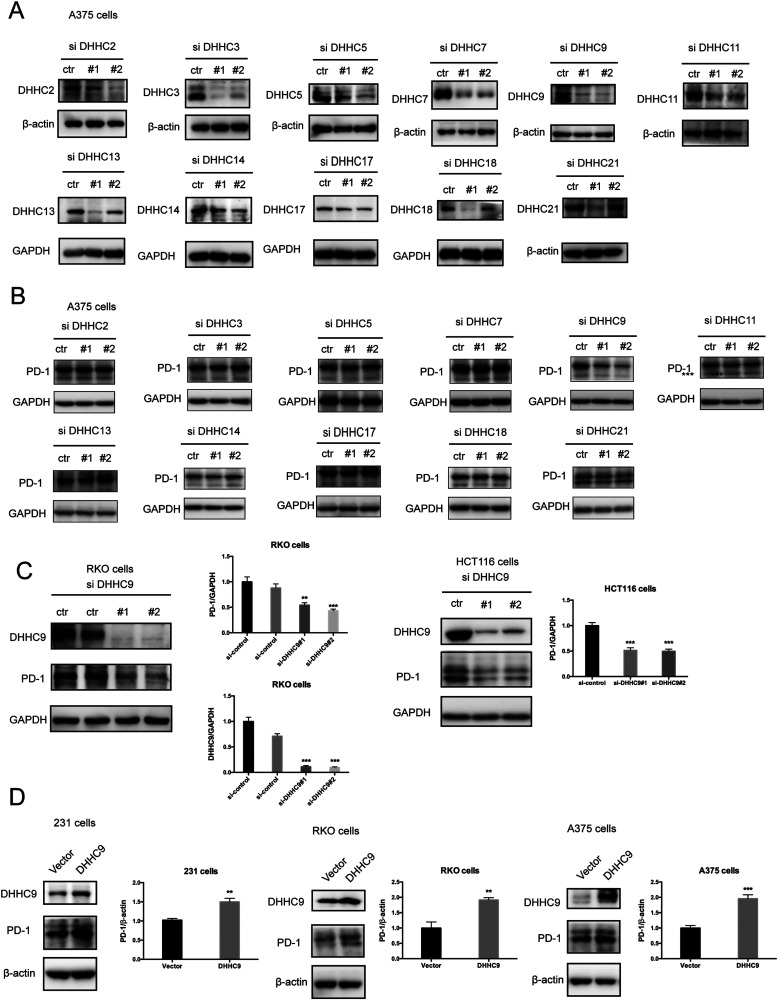
Palmitoylation is an enzymatic reaction performed by the family of Asp–His–His–Cys (DHHC) acyltransferases,18 and the mRNA expression of DHHCs in several PD-1 expressing tumor types is summarized in Fig. S3A (ESI†) based on the CCLE dataset.19 In order to identify the predominant DHHC family member responsible for PD-1 palmitoylation, we performed a systematic siRNA screening of the main DHHC family members in A375 cells (Fig. 3A, B and Fig. S3B, C, ESI†), RKO cells (Fig. S3D and E, ESI†) and HCT116 cells (Fig. S3F and G, ESI†). In all the aforementioned results, individual knockdown by two independent siRNA sequences effectively reduced the expression of the targeted DHHC gene by at least 2-fold but only siRNAs against DHHC9 significantly decreased the expression of PD-1. Since PD-1 palmitoylation maintains the PD-1 protein level, reducing the key factor palmitoylating PD-1 decreased PD-1 palmitoylation and hence decreased its protein level. Being highly reproducible, knocking down DHHC9 in various cell lines such as RKO and HCT-116 decreased PD-1 protein level (Fig. 3C). Consistently, the overexpression of DHHC9 increased PD-1 expression in MDA-MB-231, RKO and A375 cancer cell lines (Fig. 3D). Click-IT labeling allowed the detection of the PD-1 palmitoylation level in DHHC9-depleted cells, which provided direct evidence for the requirement of DHHC9 for PD-1 palmitoylation (Fig. S3H). The knockdown of DHHC9 had no impact on the expression of other DHHCs, as revealed by Western blotting using the respective antibodies for different DHHC proteins (Fig. S3I, ESI†). Altogether, these results pinpoint DHHC9 as the major enzyme for PD-1 palmitoylation in cancer cells.
Fig. 3. PD-1 is palmitoylated by DHHC9. (A) Western blot showing the effect of two independent siRNAs targeting the indicated DHHC enzymes on DHHC protein levels in A375 cells with the specific antibody for each DHHC enzyme. (B) Western blot showing the expression of PD-1 in A375 cells treated by two independent siRNAs targeting the indicated DHHC enzymes. (C) Western blot showing the expression of PD-1 in RKO and HCT116 cells treated by two independent siRNAs targeting DHHC9. Statistics shown on the right, *** P < 0.001, ** P < 0.01, ANOVA test. n = 3 independent experiments. (D) Immunoblot showing the expression of PD-1 in different cells overexpressing DHHC9. Statistics shown on the right, *** P < 0.001, ** P < 0.01, ANOVA test. n = 3 independent experiments.
Palmitoylation promotes PD-1 binding to Rab11
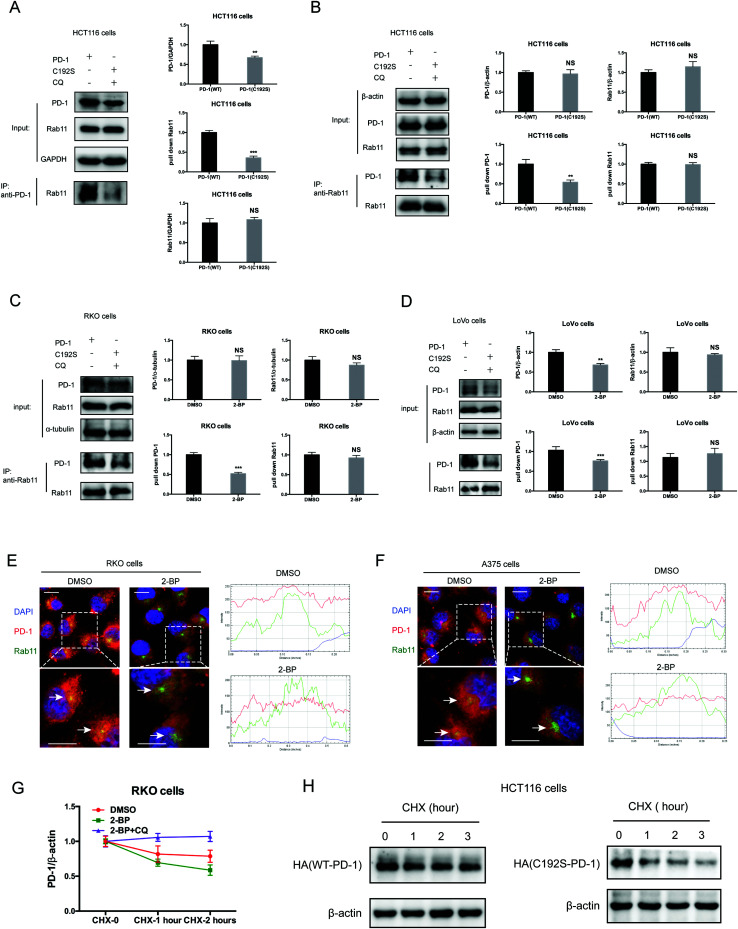
Previous studies suggested that palmitoylation may affect protein stability by modulating its interaction with Rab11 and thereby its storage in recycling endosomes.20 Therefore, we performed co-IP assay via reciprocal pulldown of overexpressed PD-1 or its non-palmitoylated version (C192S) using anti-PD-1 or anti-RAB11 in HCT-1116, a colon cancer cell line expressing a low PD-1 basal level. Cells expressing the PD-1 C192S mutant were treated with the lysosomal inhibitor chloroquine (CQ) to achieve comparable expression with WT PD-1. The results revealed that the C192S mutation on PD-1 substantially decreased its interaction with RAB11 (Fig. 4A and B), supporting the importance of palmitoylation for PD-1:RAB11 interaction. Moreover, blockade of PD-1 palmitoylation by 2-BP also disrupted the PD-1:RAB11 interaction in both RKO (Fig. 4C) and LoVo cells (Fig. 4D). To confirm that interfering with the palmitoylation dependent PD-1:RAB11 interaction decreased the storage of PD-1 to recycling endosomes, we performed co-localization studies via immunofluorescence in two cell lines. As expected, PD-1 and RAB11 co-localized to the recycling endosome under basal conditions and, upon treatment with 2-BP, the PD-1 signal intensity was reduced (Fig. 4E and F). We further quantified this signal reduction by plotting the signal intensity of PD-1 and RAB11 over a representative endosome area (Fig. 4E and F, right panels). Blocking palmitoylation by 2-BP also destabilized PD-1, which could be rescued by CQ (Fig. 4F and Fig. S4F, ESI†). These findings consistently revealed that palmitoylation promotes the interaction between PD-1 and RAB11, thereby facilitating transportation to the recycling endosome and attenuating the degradation in the lysosome.
Fig. 4. Palmitoylation promotes the binding of PD-1 to RAB11. (A and B) The interactions of RAB11:WT PD-1 and RAB11:mutant PD-1 (C192S) are shown by co-IP in HCT116 cells. The antibody for (A) PD-1 and (B) RAB11 was used for pulldown. Statistics shown on the right, *** P < 0.001, ** P < 0.01, NS, P > 0.05, ANOVA test. n = 3 independent experiments. (C and D) The interactions of RAB11:WT PD-1 and RAB11:mutant PD-1 (C192S) are shown by co-IP in RKO (C) and LoVo cells (D). Disruption of palmitoylation by the overexpression of PD-1 C192S or by 2-BP treatment significantly decreased the binding between PD-1 and RAB11, as shown by co-IP. Statistics shown on the right, *** P < 0.001, ** P < 0.01, NS, P > 0.05, ANOVA test. n = 3 independent experiments. (E and F) Colocalization between PD-1 and RAB11 in RKO (E) and A375 cells (F) by immunofluorescence (right panels). White arrows indicate the regions of the recycling endosome marked by RAB11, and the intensity profiles of PD-1 and RAB11 in the inset are quantified and plotted on the right. Upon 2-BP treatment, the enrichment of PD-1 on the recycling endosome was prevented. Images represent one of three independent experiments. Scale bars, 10 μm. (G) The degradation of PD-1 was evaluated by cycloheximide (CHX)-chase assay. Treatment with 2-BP reduces the PD-1 level and this decrease is rescued by the lysosomal inhibitor chloroquine (CQ). (H) Degradation rates of wild-type PD-1 and the C192S mutant, as determined by CHX-chase assay.
Palmitoylation promotes PD-1 cell autonomous mTOR signaling
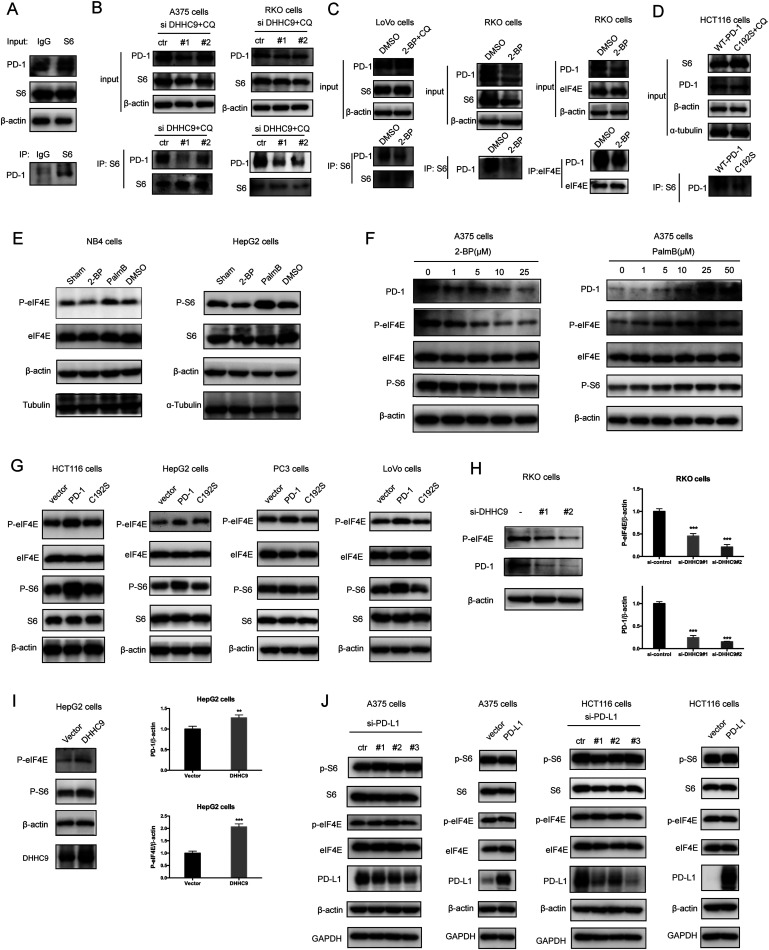
Functionally, PD-1 expressing cancer cells possess a growth and survival advantage that is independent of the adaptive immunity paracrine signaling with T cells.7 Mechanistically, it has been demonstrated that tumor intrinsic PD-1 functions through interactions with S6 and eIF4E, which are effectors of mTOR signaling.5,6 The binding to PD-1 increased the phosphorylation of S6 and eIF4E,6 leading to increased protein synthesis and cell proliferation as revealed by CCK8 assay. Thus, we hypothesize that PD-1 palmitoylation positively affects the binding of PD-1 to S6 and eIF4E. As predicted, there was an interaction between PD-1 and S6 as judged by co-IP (Fig. 5A and Fig. S5A, ESI†) in the RKO cell line. Importantly, the suppression of PD-1 palmitoylation by DHHC9 knock-down (Fig. 5B and Fig. S5B, ESI†), pharmacological inhibition using 2-BP (Fig. 5C and Fig. S5C, ESI†), or mutation of the Cys192 modification site (Fig. 5D and Fig. S5D, ESI†) effectively destroyed the PD-1:S6 and PD-1:EIF4E interactions in LoVo, RKO and HCT-116 cell lines.
Fig. 5. Palmitoylation promotes tumor-intrinsic PD-1 signaling. (A) Interaction between endogenous PD-1 and S6 in tumor cells by co-IP. (B–D) The interactions between PD-1 and S6/eIF4E were significantly decreased by depleting DHHC9 (B), 2-BP treatment (C) and mutating Cys192 (D), as shown by co-IP. (E) Modulating the expression level of PD-1 by 2-BP and PalmB impacts the phosphorylation level of the mTOR effectors eIF4E (left panels) and S6 (right panels). (F) Modulating the expression level of PD-1 by 2-BP and PB in a dose-dependent manner correlates with the phosphorylation of the mTOR effectors eIF4E (left panel) and S6 (right panel). (G) Overexpression of PD-1 other than its mutant C192S increased the phosphorylation level of eIF4E and S6 in cancer cells. (H) Phosphorylation of eIF4E and expression of PD-1 in RKO cells treated with siRNAs specific for DHHC9. Statistics shown on the right, *** P < 0.001, ANOVA test. n = 3 independent experiments. (I) The phosphorylation of eIF4E and S6 is increased in HepG2 cells overexpressing DHHC9. Statistics shown on the right, *** P < 0.001, ** P < 0.01, ANOVA test. n = 3 independent experiments. (J) The phosphorylation of eIF4E and S6 is not affected by PD-L1 silencing or PD-L1 overexpression.
Further, blocking palmitoylation by 2-BP decreased the phosphorylation of eIF4E (p-eIF4E) (Fig. 5E, left panel and Fig. S5E, ESI†) while promoting palmitoylation by Palmostatin-B increased p-eIF4E in NB4 cells. Similar results were obtained for S6 (p-S6) in HepG2 cells (Fig. 5E, right panel and Fig. S5E, ESI†). The effects of modulating palmitoylation on the phosphorylation of S6 and eIF4E displayed dose-dependent effects (Fig. 5F and Fig. S5F, ESI†). Consistently, disrupting palmitoylation by mutating the Cys192 residue also decreased the phosphorylation of eIF4E and S6 in HCT-116, HepG2, PC3 and LoVo cancer cell lines (Fig. 5G and Fig. S5G, ESI†), supporting our hypothesis that PD-1 palmitoylation regulates cancer cell autonomous mTOR signaling. Finally, siRNA-mediated silencing (Fig. 5H) or overexpression (Fig. 5I) of DHHC9 decreased or increased the phosphorylation of mTOR effectors, respectively. Of note, knockdown or overexpression of PD-L1 caused no change in the phosphorylation of S6 and eIF4E in A375 and HCT116 cells (Fig. 5J). Thus, the palmitoylation dependent and cancer intrinsic function of PD-1 is at least to signal through the mTOR pathway.
Interfering with PD-1 palmitoylation reduces cancer cell growth in 2D and 3D in vitro models
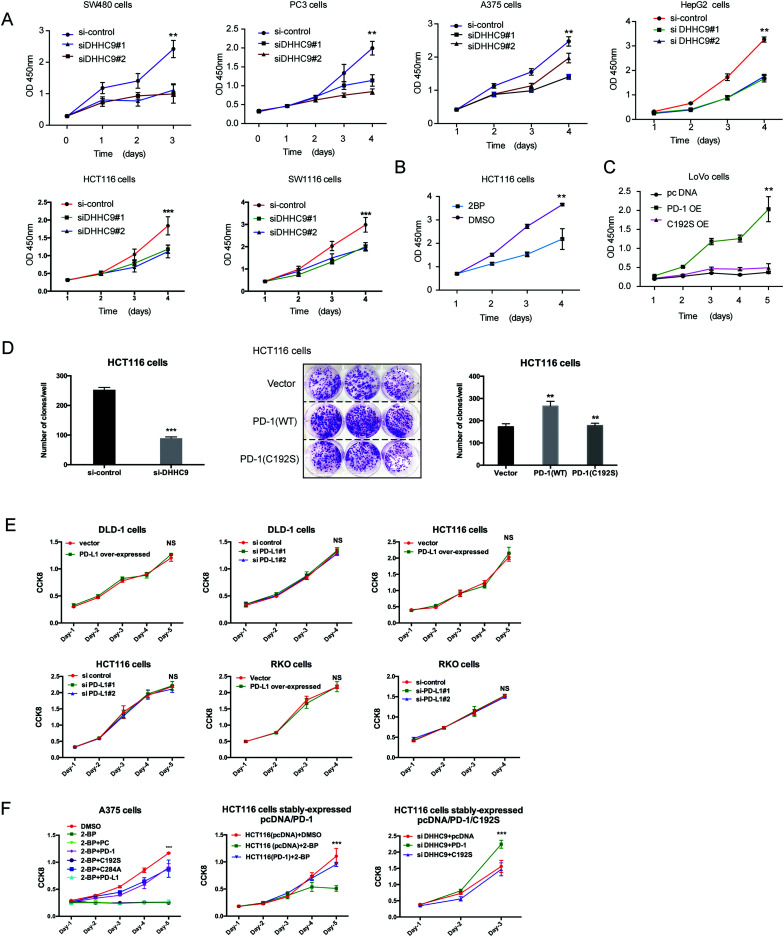
To evaluate the dependence of cancer cells on the palmitoylation status of PD-1 for cell growth, multiple cancer cell lines expressing PD-1 were DHHC9-depleted and then their growth rate was analyzed by CCK8 assay. Compared to the control condition, DHHC9 knock-down significantly attenuated cancer cell growth in all tested cell lines (Fig. 6A). Pharmacological blockade of palmitoylation by 2-BP decreased tumor growth (Fig. 6B), while overexpressing WT PD-1 (PD-1 OE) but not the C192S mutant (C192S OE) potentiated cancer cell growth (Fig. 6C). Consistently, targeted knock-down of DHHC9 expression also decreased the anchorage-independent proliferation (Fig. 6D and Fig. S6A, ESI†). Overexpression and knockdown of PD-L1 caused no change in proliferation (Fig. 6E) and anchorage-independent proliferation of HCT116 and A375 cells (Fig. S6B, ESI†), confirming the involvement of PD-1 and its palmitoylation in the observed effects. Upon 2-BP induced de-palmitoylation, the overexpression of PD-1 WT and the C284A mutant could rescue the level of phosphorylated S6, but the overexpression of PD-1 C192S or PD-L1 did not show such an effect (Fig. S6C, ESI†), supporting the role of PD-1 palmitoylation in the change in phosphorylated S6. The decreased cell proliferation caused by 2-BP or knockdown of DHHC9 could be increased by overexpressed PD-1 WT and the C284A mutant but not overexpressed PD-1 C192S mutant or PD-L1 (Fig. 6F). These data consistently showed that palmitoylation of PD-1 but not PD-L1 enhances tumor cell proliferation.
Fig. 6. Targeting palmitoylation suppressed tumor-intrinsic PD-1 functions. (A) CCK8 proliferation assay showing that the proliferation of cancer cells treated with siRNAs for DHHC9 is decreased. *** P < 0.001, ** P < 0.01, ANOVA test. n = 3 independent experiments. (B) Treatment of HCT116 cells with 2-BP decreases the proliferation of cells as detected by CCK8 assay. (C) Overexpressing the C192S mutant (C192S OE) decreases cell proliferation compared to WT PD-1 (PD-1 OE) in LoVo cells. (D) Overexpressing WT PD-1 (PD-1 OE) increases anchorage-free colony formation assay (statistics shown on the right, PD-1 C192S compared to WT, and WT compared to Vector. ** P < 0.01, ANOVA test. n = 3 independent experiments) and targeting DHHC9 decreases it compared to control conditions (statistics shown on the left, *** P < 0.001, ANOVA test. n = 3 independent experiments). (E) CCK8 proliferation assay showing that the proliferation of cancer cells was not affected by the transfection of siRNAs for PD-L1 or PD-1 plasmid. NS, P > 0.05, ANOVA test. (F) CCK8 proliferation assay showing that PD-1 and its C284A mutant but not its C192S mutant or PD-L1 could rescue the effect of 2-BP or si-DHHC9 on tumor cell proliferation. *** P < 0.001, NS, P > 0.05, ANOVA test. n = 3 independent experiments.
A designed peptide targeting PD-1 palmitoylation and expression
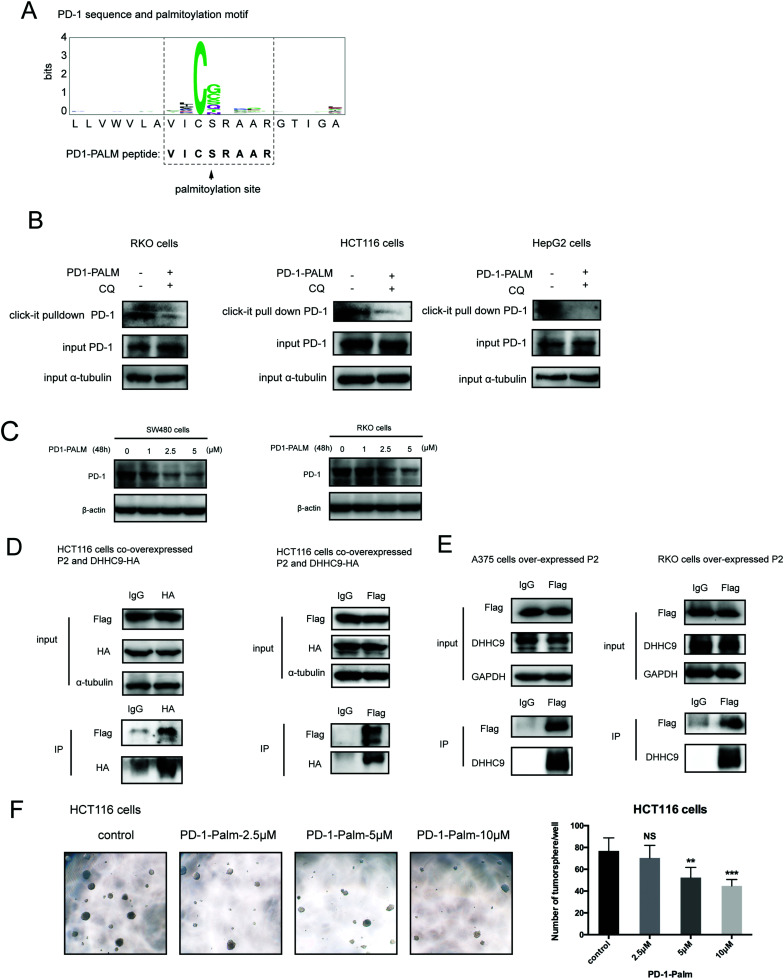
Our group has been successful at rationally designing a peptide with biological activity and potential therapeutic benefits.21 To impair PD-1 palmitoylation, we decided to design a peptide that interferes with the main PD-1 palmitoylation enzyme DHHC9 through competitive inhibition. To this end, we started with the identified sequence surrounding the palmitoylation site of PD-1 at Cys192 (Fig. 1A) and subsequently optimized its cell-penetrating potential in silico using the CellPPD predictor.22 This led to the candidate peptide VICSRAAR (herein named PD1-PALM), which is shown in Fig. 7A. To demonstrate its direct role in interfering with PD-1 palmitoylation, Click-IT palmitoylation pulldown and subsequent PD-1 immunoblotting were carried out for cells treated with PD1-PALM. In the different cell lines tested, a lower level of PD-1 was retrieved in cells treated with PD1-PALM compared to the control (Fig. 7B). Accordingly, PD1-PALM decreased PD-1 expression in a dose-dependent manner in both tested cells (Fig. 7C and Fig. S7A, ESI†). To test the interaction of PD1-PALM with the palmitoylation enzyme, we fused PD1-PALM to GFP and co-expressed it with DHHC9. Immunoprecipitation detected the interaction between the fusion protein (P2) and DHHC9 in different tested cell lines, supporting the expected mechanism of action (Fig. 7D and E). Western blotting revealed no effect of PD1-PALM on other tested proteins, including eIF4E, MHCI, PD-L1, PD-L2, p53, HIP1R, HRS, S6, UBAP1, SEC24A, THADA, JAK2, Rab11, DHHC7, DHHC17, GAPDH and β-actin, supporting the specificity of the effect of the peptide (Fig. S7B, ESI†). Finally, we tested the efficacy of the PD1-PALM peptide on tumor cells grown under three-dimensional (3D) culturing conditions. As expected, the peptide showed a dose-dependent effect on inhibiting the growth of tumor spheres (Fig. 7F). These data suggest that targeting palmitoylation may efficiently block the tumor intrinsic functions of PD-1.
Fig. 7. Competitive inhibitor of PD-1 palmitoylation. (A) Sequence of the designed PD1-PALM peptide. (B) Click-IT assay showing the decreased palmitoylation of PD-1 in RKO, HCT116 and HepG2 cells treated by the PD1-PALM peptide. (C) Expression of PD-1 in SW480 (left panel) and RKO (right panel) cells treated with different concentrations of the PD1-PALM peptide. (D) Reciprocal co-immunoprecipitation assay of exogenous DHHC9 and Flag-AVICSRAARG-GFP (P2) in HCT116 cells. (E) Co-immunoprecipitation assay of endogenous DHHC9 and Flag-AVICSRAARG-GFP (P2) in A375 and RKO cells. (F) Inhibitory effect of PD1-PALM in the 3D tumor culture model of HCT116 cells. Statistics shown on the right, *** P < 0.001, ** P < 0.01, NS P > 0.05, ANOVA test. n = 3 independent experiments.
Discussion
As a crucial target of tumor immunotherapy, the regulation of PD-1 in both immune cells and tumor cells is of prime importance in cancer immunology. For the first time, we report the palmitoylation of PD-1 and the role of this lipid modification in maintaining PD-1 expression and regulating its tumor intrinsic signaling.
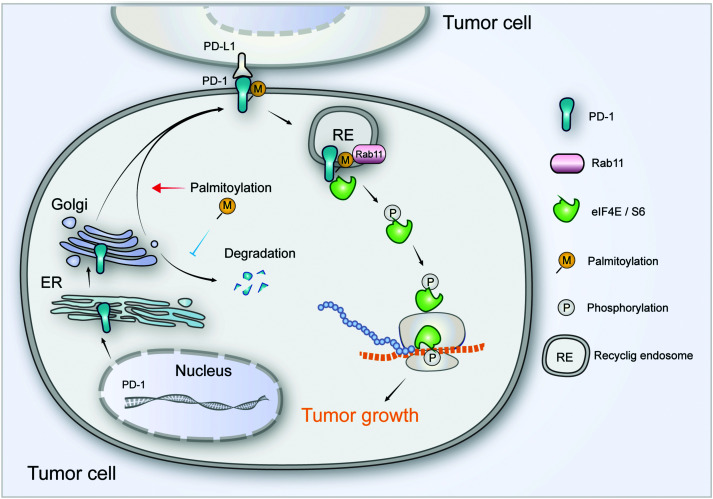
Our results suggest that palmitoylation of PD-1 promotes its interaction with Rab11, which is a key molecule in transporting the cargo proteins to the recycling endosome. Previous studies have revealed that palmitoylation regulates the trafficking of PGI2,20 TLR4,23 SNAP25b24 and Muc125 to the recycling endosome marked by Rab11, and the interaction between PGI2 and Rab11 has been experimentally confirmed.20 To note, other small GTPases such as Rab5 and Rab7 respectively mark early endosome and late endosome. Our finding that PD-1 binds Rab11 well explains the predominant distribution of PD-1 on the recycling endosome, and the results were as expected, explaining the predominant distribution of intracellular PD-1 on recycling endosomes. Blockade of palmitoylation decreased the trafficking of PD-1 to the recycling endosome and promoted its lysosomal degradation (model in Fig. 8). More interestingly, palmitoylation of PD-1 also significantly enhanced the interaction between PD-1 and the effector proteins of mTOR signaling (S6 and eIF4E), thereby triggering the activation of mTOR signaling and facilitating tumor growth. Since the S6 and eIF4E proteins are cytosolic, it is not surprising that the palmitoylation of PD-1 on its cytosolic domain can regulate the interaction with the above mTOR effector proteins.
Fig. 8. The intrinsic function and regulation of palmitoylated PD-1 in cancer cells. Schematic model showing the roles of palmitoylation in promoting PD-1 expression and intrinsic mTOR signaling to facilitate tumor growth.
Prevalent antibody-based therapies can efficiently block PD-1 on the cell surface,26 but PD-1 is also maintained in the recycling endosome and other subcellular compartments. The intracellular PD-1 may be redistributed to the cell surface and potentially compromise the effects of therapeutic antibodies. Therefore, it is a potentially more persistent strategy to deplete PD-1 in the whole cell. In the present study, we found that blocking palmitoylation can efficiently deplete the expression of PD-1, thereby presenting an alternative strategy for targeting PD-1. In addition to addressing the importance of palmitoylation for tumor-intrinsic PD-1, our study also identified the main enzyme responsible for PD-1 palmitoylation in cancer cells. Given the importance of PD-1 in both cancer cells and immune cells, simultaneously suppressing PD-1 in both tumor cells and immune cells may be an effective strategy. Although our present study focuses on the roles of palmitoylation in cancer-intrinsic PD-1 expression and functions, the potential role of this lipid modification in regulating T-cell expressed PD-1 deserves further investigation in future studies. This may provide a more complete understanding of the effects of palmitoylation blockade on tumor proliferation and anti-tumor immunity.
In summary, our results highlight the important role of palmitoylation in regulating PD-1 and provide additional opportunities for targeting PD-1 as a crucial target for tumor immunotherapy.
Methods
Palmitoylation prediction using the MDD-Palm algorithm
A maximal dependence decomposition model termed MDD-Palm was applied to identify the S-palmitoylation sites in PD-1, following the instructions reported in a related publication.14 Briefly, the full protein sequence of human PD-1 (PDCD1, UniProt accession #Q15116) was used as the input of the MDD-Palm web server (http://csb.cse.yzu.edu.tw/MDDPalm/), and the prediction was based on default parameters. The resultant prediction site (C192S) and its associated motif are shown in Fig. 1A.
Cell culture and transfection
The human colorectal cancer HCT116, LOVO, RKO, SW480, A375, PC3, NB4, 8226, DLD-1, HepG2, SW1116, and MM1.S cells were purchased from ATCC. All cell lines were tested and verified to be free of Mycoplasma. Cells were maintained in RPMI 1640 or DMEM or Myco 5A medium (Gibco, Gaithersburg, MD, USA) supplemented with 10% (vol/vol) fetal bovine serum (Invitrogen, Carlsbad, CA, USA) and cultured in a humidified incubator at 37 °C under 5% CO2. For transfection, cells were seeded at 50% confluence 24 h before transfection and then transfected using FuGENE HD (Promega, Fitchburg, WI, USA) according to the product manual. Briefly, the transfection complex was made using 1 μg of plasmid, 3 μl of FuGENE HD and 100 μl of Opti-MEM. For the transfection of siRNAs, the sequences of siRNAs are shown in Table S1 (ESI†). Six hours after the complex was added to the cells, normal culture medium was used to culture cells for an additional 48 h.
Antibodies and chemicals
The primary antibodies for HA tag (#3724, CST), RAB11 (610656, BD), PD-1 (#86163, CST and #52587, Abcam, AF1086, R&D, #192106, R&D), DHHC2 (AY4640, Abways), DHHC5 (A18114, ABclonal), DHHC7 (AY4642, Abways), DHHC9 (ab74504, Abcam), DHHC11 (bs-18472R, Bioss Antibodies), DHHC13 (#DF2600, Affbiotech), DHHC14 (bs-18476R, Bioss Antibodies), DHHC17 (A6793, ABclonal), DHHC18 (A15199, ABclonal), DHHC18 (bs-4229R, Bioss Antibodies), PD-L1 (#13684, Cell Signaling Technology), S6 (#2217 and #2317, Cell Signaling Technology), Phospho-S6 Ribosomal Protein (#4858, Cell Signaling Technology), Phospho-eIF4E (#9741, Cell Signaling Technology), RAB11 (610656, BD Biosciences), α-Tubulin (#2144, Cell Signaling Technology), Flag (#14793, Cell Signaling Technology), HRS (sc-271925, Santa Cruz), GODZ (ab31837, Abcam), HIP1R (16814-1-AP, Proteintech), MHCI (ab134189, Abcam), p53 (sc-126, Santa Cruz Biotechnology), PD-L2 (#82723, Cell Signaling Technology), UBAP1 (12385-1-AP, Proteintech), SEC24A (#9678, Cell Signaling Technology), THADA (ab152830, Abcam), and JAK2 (#3230, Cell Signaling Technology) were commercially available. Secondary antibodies used in the immunofluorescence assay were AF488-anti-Mouse (Invitrogen), AF594-anti-rabbit (Invitrogen), AF488-anti-rabbit (Invitrogen), and AF594-anti-mouse (Invitrogen). Small molecular compounds such as 2-BP (Sigma), Palmostatin-B (Millipore), Cycloheximide (C1988, Sigma), Chloroquine (C6628, Sigma), Click-iT palmitic acid, azide (C10265, Thermo Scientific), Click-iT Cell Reaction Buffer Kit (C10269, Thermo Scientific), Biotin-alkyne (Sigma), Streptavidin (Sepharose Bead Conjugate) (#3419, CST), Goat anti-Human IgG (H + L) Cross-Adsorbed Secondary Antibody, Alexa Fluor 488 (A11013, Thermo Scientific), DAPI (0100-20, Southern Biotech), 50× B27 Supplement (Life Technologies, Invitrogen™, catalog number: 17504-044), Basic Fibroblast Growth Factor (Sigma-Aldrich, catalog number: F0291), Epidermal Growth Factor (Sigma-Aldrich, catalog number: E5036), Insulin (Life Technologies, Invitrogen™, catalog number: A11429IJ), Bovine Serum Albumin (Sigma-Aldrich, catalog number: A9576), Dulbecco's Modified Eagle Medium/F12 (Sigma-Aldrich, catalog number: D8437), Sterile 1× Dulbecco's Phosphate Buffered Saline (Sigma-Aldrich, catalog number: D8537) and Trypan Blue (Life Technologies, Invitrogen™, catalog number: 15250-061) were also purchased from the indicated suppliers.
Plasmid construction
The expression vectors encoding pcDNA3.1-Flag-PD-1, pcDNA3.1-DHHC9, and pcDNA3.1-P2 (Flag-AVICSRAARG-GFP) were generated by inserting synthesized cDNAs into the pcDNA3.1 vector. The PD-1 C192S mutant was generated via a site-directed mutagenesis PCR reaction using platinum Pwo SuperYield DNA polymerase (Roche, Basel, Switzerland) according to the product manual. All plasmids were sequenced to confirm if the designed mutation is present, without any other unwanted mutation.
Click-iT identification of PD-L1 Palmitoylation
48 hours after transfection of PD-1 or the PD-1 C192S mutant, 100 μM Click-iT palmitic acid-azide was added to the cell medium with gentle mixing and then incubated at 37 °C and 5% CO2 for 6 hours. After 6 hours of incubation, the medium was removed and the cells were washed three times with PBS before the addition of lysis buffer (1% SDS in 50 mM Tris–HCl, PH 8.0) containing protease and phosphatase inhibitors at appropriate concentrations. We incubated the cells for 20 min on ice, then tilted the plates and pipetted the lysate into a 1.5 ml microcentrifuge tube. Then, we sonicated the lysate with a probe sonicator to solubilize the proteins and disperse the DNA. After vortexing the lysate for 5 minutes and centrifuging the cell lysate at 13 000–18 000 × g at 4 °C for 5 minutes, we transferred the supernatant to a clean tube and determined the protein concentration using the EZQ® Protein Quantitation Kit (Cat. no. R33200, Thermo Scientific) or another method. Thus, the protein sample was reacted with biotin-alkyne using the Click-iT Protein Reaction Buffer Kit (Cat. no. C10276, Thermo Scientific) following the protocols described in the instruction sheet. Then, the biotin-alkyne-azide-palmitic-protein complex was pulled down by Streptavidin and, after washing, the pellets were subjected to immunoblotting detection for PD-L1.
Immunofluorescence
Cells were fixed with 4% PFA for 20 min, allowing it to permeate, and blocked with PBS buffer containing 1% BSA and 0.2% Triton-100 for 1 hour at room temperature. The cells were incubated with the primary antibody at 4 °C overnight. After washing 3 times with PBS, the cells were incubated with a fluorescent conjugated secondary antibody for 30 min at room temperature. The slides were mounted with Prolong Gold and imaged on a Zeiss 710 confocal microscope.
Immunoblotting and immunoprecipitation
For immunoblotting, cells were lysed either in 1% Triton X-100 or in TBS pH 7.6 with Roche complete protease inhibitor for 30 min on ice, followed by pelleting of the insoluble material via centrifugation. Lysates were heated to 100 °C in SDS sample buffer with 50 mM DTT for 10 min, separated via SDS-PAGE, and transferred to a PVDF membrane (Millipore). Membranes were blocked in 5% BSA in TBS and probed with the indicated antibodies, and reactive bands were visualized using West Pico (Thermo Fisher Scientific).
For co-immunoprecipitation experiments, cells were lysed in IP buffer (#87787, Thermo Scientific) plus Roche complete protease inhibitor for 10 min on ice, followed by the addition of Benzonase (Sigma) for 25 min at room temperature. Then, the lysate was centrifuged at 15 000 rpm and 4 °C to remove the precipitation. Then, the supernatants were incubated with the primary antibody at a slow rotating speed at 4 °C overnight, followed by addition of protein A or protein G agarose beads and incubation for a further 2 h at 4 °C. After four washes in PBST (PBS with 0.01% Tween 20), samples were eluted in SDS sample buffer with 50 mM DTT for 10 min at 100 °C, separated via SDS-PAGE and immunoblotted as described.
Detection of PD-1 degradation rate
After the indicated treatments, cells were incubated with cycloheximide (50 μg ml−1) for different times. Then, the cells were subjected to immunoblotting assay and the immunoblotting images were quantified by Quantity One software.
Cell proliferation assay
Cell proliferation assay was carried out using a Cell Counting Kit-8 (CCK-8) (Dojindo), following the manufacturer's instructions. Twenty-four hours after treatments, the cells were harvested and seeded into 96-well plates at an initial density of 2000 cells per well in 100 μl of culture medium. At the indicated time points for the analysis, 10 μl of the CCK-8 solution was added to each well with serum-free medium, followed by incubation for 2 hours in a humidified incubator at 37 °C with 5% CO2. The optical density (OD) at 450 nm (indicating the formation of formazan) was measured using a VERSA Max microplate reader (MDS Analytical Technologies) with SoftMax Pro software.
In vitro tumorsphere formation assays
Tumorsphere medium with B27 was prepared before experiments as follows: B27 supplement (50×) was added to tumorsphere medium (500 ml of Dulbecco's Modified Eagle Medium/F12 with the addition of 20 ng ml−1 epidermal growth factor, 10 ng ml−1 basic fibroblast growth factor, 5 μg ml−1 insulin and 0.4% Bovine Serum Albumin) for making the 1× concentration as needed for experiments and B27 was freshly added before each experiment. Then, the cells were harvested and the resulting pellet was suspended in 5 ml of 1× PBS; the cells were on ice when not in use for the duration of the experiment. The suspension was gently mixed and 20 μl of the suspension was pipetted into an Eppendorf tube. 20 μl of Trypan Blue was added (1 : 1 ratio) to the cells in the Eppendorf tube and mixed well. 10 μl of the mixture was pipetted approximately onto a hemocytometer and only the bright cells within the four corner quadrants of the counting chamber for a viable cell count were counted. Then, the required number of cells was added into an appropriate volume of tumorsphere medium to make a cell concentration of 1 cell per L and this suspension was kept on ice and mixed well for plating. 200 μl of the cells suspended in the tumorsphere medium was seeded into each well (200 cells per well). The upper and lower edges of the 96-well plate were sealed with laboratory tape to avoid evaporation of the medium and the cells were placed in an incubator set to 37 °C and 5% CO2 for one week. After one-week incubation, the tumorsphere number was counted under a phase-contrast microscope using a 40× magnification lens.
Statistical analysis
Data in bar graphs indicate mean ± SD fold change in relation to control groups of 3 independent experiments. Statistical analyses were performed using SPSS (IBM). All the proliferation results containing more than two conditions were analyzed using an ANOVA post hoc test (Tukey, compare all pairs of conditions). Statistical significance was considered when the P value was less than 0.05.
Author contributions
H. Y., C. L., F. H., T. S., J. P. B., H. W., H. L., C. F., H. S., J. L. and J. X. contributed to the design and/or execution of experiments. H. Y., J. P. B. and J. X. wrote the paper. J. Y. F. provided resources. J. X. conceived and supervised the study.
Conflicts of interest
The authors declare no conflicts of interest related to this work. Data and material availability: all data needed to evaluate the conclusions in the paper are present in the paper or the ESI.† The plasmids require a material transfer agreement from Fudan University, China.
Supplementary Material
Acknowledgments
This project was supported by grants from the National Key Research & Development (R&D) Plan (2016YFC0906000 and 2016YFC0906002), the Basic Research Projects of Shanghai Science and Technology Innovation Action Plan (20JC1410700), the National Natural Science Foundation of China (82030104, 81874050, 81572326, 81322036, 81421001, 81702969, 81530072, 81830081, 31871009 and 81772506), the National Science Foundation of China (21335002) to Haojie Lu, the Natural Science Foundation of Shanghai (18ZR1402800) to Caiyun Fang, and the Startup Research Funding of Fudan University.
Electronic supplementary information (ESI) available. See DOI: 10.1039/d0cb00157k
References
- Fourcade J. et al., Upregulation of Tim-3 and PD-1 expression is associated with tumor antigen-specific CD8+ T cell dysfunction in melanoma patients. J. Exp. Med. 2010;207:2175–2186. doi: 10.1084/jem.20100637. doi: 10.1084/jem.20100637. [DOI] [PMC free article] [PubMed] [Google Scholar]
- Wang Y. et al., Regulation of PD-L1: Emerging Routes for Targeting Tumor Immune Evasion. Front. Pharmacol. 2018;9:536. doi: 10.3389/fphar.2018.00536. doi: 10.3389/fphar.2018.00536. [DOI] [PMC free article] [PubMed] [Google Scholar]
- Postow M. A. Callahan M. K. Wolchok J. D. Immune Checkpoint Blockade in Cancer Therapy. J. Clin. Oncol. 2015;33:1974–1982. doi: 10.1200/JCO.2014.59.4358. doi: 10.1200/JCO.2014.59.4358. [DOI] [PMC free article] [PubMed] [Google Scholar]
- Meng X. et al., FBXO38 mediates PD-1 ubiquitination and regulates anti-tumour immunity of T cells. Nature. 2018;564:130–135. doi: 10.1038/s41586-018-0756-0. doi: 10.1038/s41586-018-0756-0. [DOI] [PubMed] [Google Scholar]
- Kleffel S. et al., Melanoma Cell-Intrinsic PD-1 Receptor Functions Promote Tumor Growth. Cell. 2015;162:1242–1256. doi: 10.1016/j.cell.2015.08.052. doi: 10.1016/j.cell.2015.08.052. [DOI] [PMC free article] [PubMed] [Google Scholar]
- Li H. et al., Programmed cell death-1 (PD-1) checkpoint blockade in combination with a mammalian target of rapamycin inhibitor restrains hepatocellular carcinoma growth induced by hepatoma cell-intrinsic PD-1. Hepatology. 2017;66:1920–1933. doi: 10.1002/hep.29360. doi: 10.1002/hep.29360. [DOI] [PubMed] [Google Scholar]
- Yao H. Wang H. Li C. Fang J. Y. Xu J. Cancer Cell-Intrinsic PD-1 and Implications in Combinatorial Immunotherapy. Front. Immunol. 2018;9:1774. doi: 10.3389/fimmu.2018.01774. doi: 10.3389/fimmu.2018.01774. [DOI] [PMC free article] [PubMed] [Google Scholar]
- Chen M. et al., Development and validation of a novel clinical fluorescence in situ hybridization assay to detect JAK2 and PD-L1 amplification: a fluorescence in situ hybridization assay for JAK2 and PD-L1 amplification. Modern pathology: an official journal of the United States and Canadian Academy of Pathology, Inc. 2017;30:1516–1526. doi: 10.1038/modpathol.2017.86. doi: 10.1038/modpathol.2017.86. [DOI] [PubMed] [Google Scholar]
- Lu H. Fang C. Methodology for Detecting Protein Palmitoylation. Adv. Exp. Med. Biol. 2020;1248:425–430. doi: 10.1007/978-981-15-3266-5_17. doi: 10.1007/978-981-15-3266-5_17. [DOI] [PubMed] [Google Scholar]
- Wang Y. Lu H. Fang C. Xu J. Palmitoylation as a Signal for Delivery. Adv. Exp. Med. Biol. 2020;1248:399–424. doi: 10.1007/978-981-15-3266-5_16. doi: 10.1007/978-981-15-3266-5_16. [DOI] [PubMed] [Google Scholar]
- Tukachinsky H. Petrov K. Watanabe M. Salic A. Mechanism of inhibition of the tumor suppressor Patched by Sonic Hedgehog. Proc. Natl. Acad. Sci. U. S. A. 2016;113:E5866–E5875. doi: 10.1073/pnas.1606719113. doi: 10.1073/pnas.1606719113. [DOI] [PMC free article] [PubMed] [Google Scholar]
- Han Yao J. L. Chushu L. Shi H. Brosseau J.-P. Wang H. Lu H. Fang C. Zhang Y. Liang L. Zhou X. Wang C. Xue Y. Cui Y. Xu J. Inhibiting PD-L1 palmitoylation enhances T-cell immune responses against tumours. Nat. Biomed. Eng. 2019;3(4):306–317. doi: 10.1038/s41551-019-0375-6. doi: 10.1038/s41551-019-0375-6. [DOI] [PubMed] [Google Scholar]
- Ko P. J. Dixon S. J. Protein palmitoylation and cancer. EMBO Rep. 2018;19(10):e46666. doi: 10.15252/embr.201846666. doi: 10.15252/embr.201846666. [DOI] [PMC free article] [PubMed] [Google Scholar]
- Weng S. L. Kao H. J. Huang C. H. Lee T. Y. MDD-Palm: Identification of protein S-palmitoylation sites with substrate motifs based on maximal dependence decomposition. PLoS One. 2017;12:e0179529. doi: 10.1371/journal.pone.0179529. doi: 10.1371/journal.pone.0179529. [DOI] [PMC free article] [PubMed] [Google Scholar]
- Blanc M. et al., SwissPalm: Protein Palmitoylation database. F1000Res. 2015;4:261. doi: 10.12688/f1000research.6464.1. [DOI] [PMC free article] [PubMed] [Google Scholar]
- Gao X. Hannoush R. N. A Decade of Click Chemistry in Protein Palmitoylation: Impact on Discovery and New Biology. Cell Chem. Biol. 2018;25:236–246. doi: 10.1016/j.chembiol.2017.12.002. doi: 10.1016/j.chembiol.2017.12.002. [DOI] [PubMed] [Google Scholar]
- Draper J. M. Smith C. D. Palmitoyl acyltransferase assays and inhibitors (Review) Mol. Membr. Biol. 2009;26:5–13. doi: 10.1080/09687680802683839. doi: 10.1080/09687680802683839. [DOI] [PMC free article] [PubMed] [Google Scholar]
- Rana M. S. Lee C. J. Banerjee A. The molecular mechanism of DHHC protein acyltransferases. Biochem. Soc. Trans. 2019;47:157–167. doi: 10.1042/BST20180429. doi: 10.1042/BST20180429. [DOI] [PubMed] [Google Scholar]
- Bouhaddou M. et al., Drug response consistency in CCLE and CGP. Nature. 2016;540:E9–E10. doi: 10.1038/nature20580. doi: 10.1038/nature20580. [DOI] [PMC free article] [PubMed] [Google Scholar]
- Reid H. M. Mulvaney E. P. Turner E. C. Kinsella B. T. Interaction of the human prostacyclin receptor with Rab11: characterization of a novel Rab11 binding domain within alpha-helix 8 that is regulated by palmitoylation. J. Biol. Chem. 2010;285:18709–18726. doi: 10.1074/jbc.M110.106476. doi: 10.1074/jbc.M110.106476. [DOI] [PMC free article] [PubMed] [Google Scholar] [Retracted]
- Wang H. et al., HIP1R targets PD-L1 to lysosomal degradation to alter T cell-mediated cytotoxicity. Nat. Chem. Biol. 2019;15:42–50. doi: 10.1038/s41589-018-0161-x. doi: 10.1038/s41589-018-0161-x. [DOI] [PubMed] [Google Scholar]
- Gautam A. Chaudhary K. Kumar R. Raghava G. P. Computer-Aided Virtual Screening and Designing of Cell-Penetrating Peptides. Methods Mol. Biol. 2015;1324:59–69. doi: 10.1007/978-1-4939-2806-4_4. doi: 10.1007/978-1-4939-2806-4_4. [DOI] [PubMed] [Google Scholar]
- Yu S. et al., TLR sorting by Rab11 endosomes maintains intestinal epithelial-microbial homeostasis. EMBO J. 2014;33:1882–1895. doi: 10.15252/embj.201487888. doi: 10.15252/embj.201487888. [DOI] [PMC free article] [PubMed] [Google Scholar]
- Greaves J. Chamberlain L. H. Differential palmitoylation regulates intracellular patterning of SNAP25. J. Cell Sci. 2011;124:1351–1360. doi: 10.1242/jcs.079095. doi: 10.1242/jcs.079095. [DOI] [PMC free article] [PubMed] [Google Scholar]
- Kinlough C. L. et al., Recycling of MUC1 is dependent on its palmitoylation. J. Biol. Chem. 2006;281:12112–12122. doi: 10.1074/jbc.M512996200. doi: 10.1074/jbc.M512996200. [DOI] [PubMed] [Google Scholar]
- Migden M. R. et al., PD-1 Blockade with Cemiplimab in Advanced Cutaneous Squamous-Cell Carcinoma. N. Engl. J. Med. 2018;379:341–351. doi: 10.1056/NEJMoa1805131. doi: 10.1056/NEJMoa1805131. [DOI] [PubMed] [Google Scholar]
Associated Data
This section collects any data citations, data availability statements, or supplementary materials included in this article.


