

Abstract
Induced hyperthermia has been demonstrated as an effective oncological treatment due to the reduced heat tolerance of most malignant tissues; however, most techniques for heat generation within a target volume are insufficiently selective, inducing heating and unintended damage to surrounding healthy tissues. Plasmonic photothermal therapy (PPTT) utilizes light in the near-infrared (NIR) region to induce highly localized heating in gold nanoparticles, acting as exogenous chromophores, while minimizing heat generation in nearby tissues. However, optimization of treatment parameters requires extensive in vitro and in vivo studies for each new type of pathology and tissue targeted for treatment, a process that can be substantially reduced by implementing computational modeling. Herein, we describe the development of an innovative model based on the finite element method (FEM) that unites photothermal heating physics at the nanoscale with the micron scale to predict the heat generation of both single and arrays of gold nanoparticles. Plasmonic heating from laser illumination is computed for gold nanoparticles with three different morphologies: nanobipyramids, nanorods, and nanospheres. Model predictions based on laser illumination of nanorods at a visible wavelength (655 nm) are validated through experiments, which demonstrate a temperature increase of 5 °C in the viscinity of the nanorod array when illuminated by a 150 mW red laser. We also present a predictive model of the heating effect induced at 810 nm, wherein the heating efficiencies of the various morphologies sharing this excitation peak are compared. Our model shows that the nanorod is the most effective at heat generation in the isolated scenario, and arrays of 91 nm long nanorods reached hyperthermic levels (an increase of at least 5 °C) within a volume of over 20 μm3.
Graphical Abstract
INTRODUCTION
The first applications of heat in tumor treatment are dated at least 3000 years back to the ancient Egyptians, where a glowing tip of a firedrill was used to treat a breast cancer tumor.1–5 In recent years, new techniques have been developed to enable hyperthermia, which is defined as heating tissue to a temperature between 41 and 47 °C for at least 20–30 min,3,6 to treat different malignant cancers. This approach is considered selective due to the reduced heat tolerance typical to most malignancies, but most methods have still been demonstrated to cause collateral damage within surrounding healthy tissue.7 Among the techniques developed and refined over the past few decades, those using light absorption have received substantial attention due to their capabilities of superior control and confinement of thermal damage within tumor tissue.3,8 The use of lasers in medicine was first introduced in the field of ophthalmology back in the 1960s,3,9 with the most commonly employed laser gain media being neodymium–yttrium aluminum garnet (Nd:YAG, 1.06 μm) and CO2 (10.6 μm) A collimated laser beam reaches a wavelength-dependent tissue depth determined by the scattering and absorption of the tissue chromophores, which has a local minimum in the near-infrared (NIR) region.10 The absorbed light generates heating of the tissue, thus inducing hyperthermia.11
The use of this technology enabled physicians to reach deep-seated targets, but it has one major disadvantage: the high power density needed to effectively ablate tumors causes damage to the healthy tissue in the path of the beam.3,12–14 One technique leveraged to overcome this issue is photodynamic therapy (PDT), which uses a photosensitizer that reacts with tissue oxygen upon exposure to a specific wavelength in the visible or NIR region. This photochemical reaction occurs at much lower light fluence levels, causing cell destruction via toxic singlet oxygen. However, these sensitizers (mainly porphyrin-based) stay in the body for long periods of time, leaving patients highly sensitive to light and likely to experience related complications while undertaking this treatment.3
As an alternative to these treatments, photothermal therapy (PTT) leverages localized photoabsorbing chromophores to achieve spatially selective heating.15 PTT typically uses chromophores with absorption peaks within the NIR range, due to the high physiological transmissivity observed at those wavelengths, minimizing undesired tissue absorption and subsequent heating.16 The agents used in this therapy include natural tissue chromophores, added dye molecules, and, more recently, nanoparticles.17 Research and advances in the field of nanotechnology have provided a variety of nanostructures with unique and tunable optical properties, providing utility to a broad range of applications in medicine. Metallic nanoparticles, when exposed to light at their resonance wavelength, experience a coherent, collective oscillation of the conduction-band electrons that leads to significant light scattering or absorption.3,18 This oscillation is known as localized surface plasmon resonance (LSPR), which yields a light absorption that is about five times larger than that offered by conventional photoabsorbing dyes.3 Gold nanoparticles (GNPs) are studied and used in a variety of applications; some of the most commonly used geometries for oncological treatment are nanospheres, nanorods, and nanoshells. The popularity of these geometries lies in their ease of preparation, their high light-to-heat ratio, and the possibility of providing an alternative treatment for chemotherapy-resistant tumors.17–19 Among the aforementioned variants, gold nanorods (GNRs) are frequently preferred due to their optical response tunability, which can be achieved by changing their aspect ratio, and efficiency in large-scale synthesis.20 The capabilities of these nanoparticles to undergo surface modification have also allowed PTT to be combined with other treatment strategies such as molecular targeting, chemotherapy, and gene therapy.21–23 It is important to note that cytotoxicity due to synthesis methods was a historic limitation to in vivo implementation of GNPs. However, advances in recent years have demonstrated that the incorporation of polyethylene glycol (PEG), dense silica (d-SiO2), and titanium dioxide (TiO2) coatings dramatically mitigates cell injury.24
There are three primary factors that affect the optimization space for wavelength selection to induce nanoparticle hyperthermia: penetration depth, off-target absorption within healthy tissues, and the optical properties of the nanoparticles (e.g., absorption). Absorption levels of tissue chromophores in the 800–1100 nm range are about 2 orders of magnitude lower than absorption in the visible range. Additionally, penetration depth at these NIR wavelengths is several folds higher than in the visible range. These properties, in addition to the tunable versatility of GNRs, make NIR light the ideal candidate for plasmonic photothermal therapy (PPTT).18,25–27
Light–nanoparticle interactions, as well as light–tissue and nanoparticle–tissue interactions, can be studied using computational modeling to further understand the effect of light diffusion in tissue and the temperature change induced by the heating of nanoparticles when excited with light.28–34 The window opened by computational modeling enables the optimization of therapies like PPTT as the size and shape of GNPs can be easily modified in search of the type of nanoparticles that will enhance the thermal effects within a target. Other computational methods, such as the one presented by Baffou et al., implement shape factors to simplify the calculation of the power absorbed by nonspherical nanoparticles and their subsequent heat generation.20,35 Another method, proposed by Hogan et al., studies the effect of multiple scattering in heat generation. This is due to the use of nanoshells with a relatively large size (~150 nm), which possess a scattering-dominated extinction cross-section.36
In this work, we take advantage of the tools provided by computational modeling and compare the effects of size and shape by creating computational models of different types of nanoparticles, more specifically gold nanorods, gold nanobipyramids (GBPs), and gold nanospheres (GNSs). The light–nanoparticle interaction can be explored using these computational models, as the power absorbed by the nanoparticles, when excited by an incident light wave, can be calculated from the solutions of Maxwell’s equations. Furthermore, the subsequent nanoparticle heating due to the absorption of light and its effect on temperature change of the surrounding medium (water) can be assessed by using the power absorbed as a heat source to solve the heat equation. Our computational model uses a novel approach to calculate the power absorbed by the nanoparticles and their subsequent heat generation. It incorporates a full electrodynamics simulation to solve the light–nanoparticle interaction and couple the results into a heat transfer model without implementing shape simplifications. Additionally, we focus on nanoparticles whose extinction cross-section is dominated by absorption and exhibits relatively little scattering, making multiple scattering effects less significant in our models. These simulations are verified by comparing with an analytical solution obtained using Mie theory and validated by comparing the simulated results with those obtained experimentally.
METHODS
Computational Methods.
Geometry Models of GNPs: Nanorod, Bipyramid, and Nanosphere.
Computational models of different GNPs were developed using computer-aided design (CAD) software SOLIDWORKS (Dassault Systèmes SolidWorks Corp; www.solidworks.com). The models were based on transmission electron microscopy (TEM) images of GNRs and GBPs.
Each one of the models was set up so that different sizes and aspect ratios could be analyzed by modifying specific parameters. In the case of the GNS, this parameter is the radius. For the GNR, the parameters include the length and width. Lastly, the modifiable parameters for the GBP are the length, width, and tip radius.
Optical Absorbance by GNPs.
Analytical solutions to Maxwell’s equations can be obtained using Mie theory in the case of spherical particles.37 However, to obtain solutions to Maxwell’s equations for nonspherical geometries, numerical approaches are needed. In this study, we imported the SOLIDWORKS models of different geometries into the finite element method (FEM) simulation software COMSOL Multiphysics (COMSOL; www.comsol.com) using LiveLink and used COMSOL’s RF Module to solve Maxwell’s equations. Additionally, an absorbing boundary, or perfectly matched layer (PMLs), with a thickness of λ/2 (λ is the wavelength) was implemented to truncate the computational domain. Details on the mathematical model and computational setup can be found in the Supporting Information.
An example of the PMLs truncation for our setup is shown Figure 1a.
Figure 1.
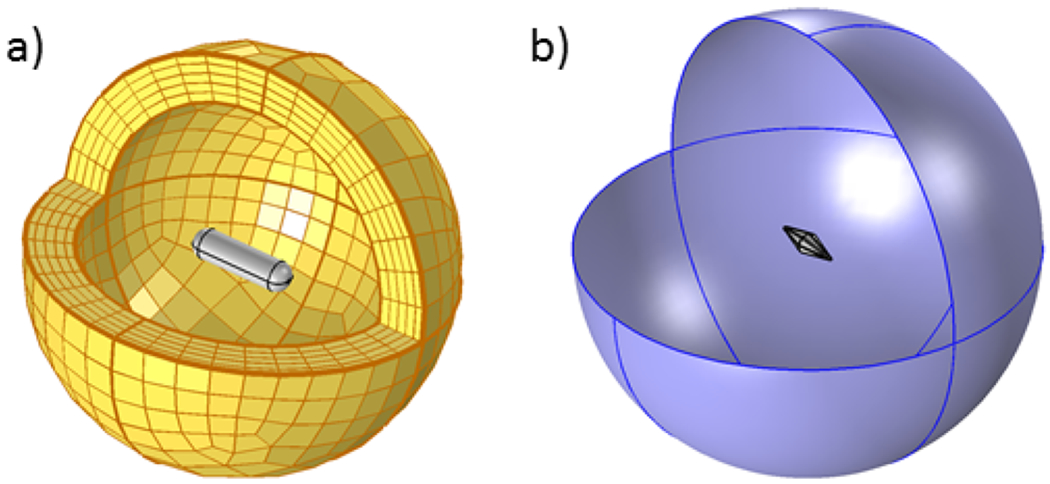
Computational model used in (a) the electrodynamic simulations, showing the PMLs around a nanorod, and (b) the heat transfer simlations, showing a water sphere around a nanobipyramid.
In addition to the absorbing property of the PMLs and to reduce the impact of the discretization, a scattering boundary condition was assigned to the outermost surface, meaning that the waves reaching the external boundary of the computational domain would not travel back into the domain of interest.
Illumination at the nanoparticles’ LSPR could result in either light scattering or light absorption. The amount of scattered and absorbed light was determined using the cross-section calculations38 and summed up to obtain the extinction cross-section of the nanoparticles (Figure 2). However, for the scope of this work, we focused on the absorption of light and the resulting localized heating. The absorption cross-section of the particle, σabs can be calculated from the Poynting theorem as
| (1) |
where Sin is the Poynting vector magnitude and where the power absorbed by the nanoparticle is
| (2) |
Here, Qh is defined as the total power dissipation density (i.e., the total losses of the system) based on the calculated EM fields. We obtained the total power absorbed by integrating over the volume, V, of the GNP.35,39
Figure 2.
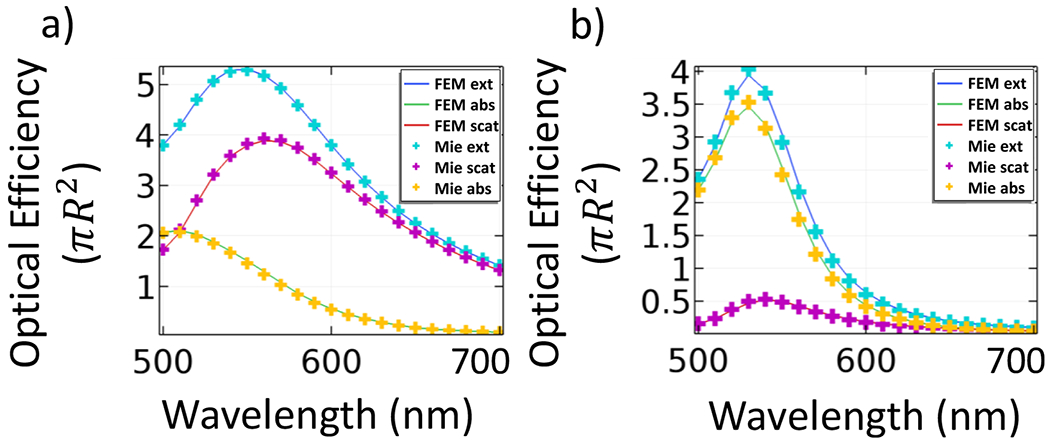
Optical spectra obtained numerically using FEM (extinction in blue, absorption in green, and scattering in red solid lines) with the analytical solution from Mie theory for (a) 150 nm gold nanosphere in air and (b) 50 nm gold nanosphere in water.
Calculating Heat Source Power of a GNP.
The absorbing properties of nanoparticles play an important role in photothermal heating. At the LSPR wavelength, the light absorbed is maximized, and so is the photothermal heating effect. To calculate the photothermal heating generated by a spherical nanoparticle,35 eq 3 yields an accurate approximation based on the absorption cross-section, the volume of the particle, and the irradiance of the light source.
| (3) |
This approach, however, yields inconsistent results when treating complex geometries such as the nanobipyramid or the nanorod; in these cases, a more general approach is undertaken as shown in eq 435
| (4) |
with Qabs being the power per unit volume generated by the nanoparticle and considering that the effect of other losses due to atomic effects is negligible. It is clear to see how the power absorbed by the GNP is readily transformed into heat.
Heat Transfer for GNPs in a Homogeneous Environment (Single GNPs and Arrays).
COMSOL’s Coefficient Form PDE module was used for our heat transfer model, due to its versatility for adding or neglecting different effects in the simulations. With a heat source, Qabs, measured in and temperature, T, being the dependent variable, the steady state heat equation reads
| (5) |
where κ is the diffusion coefficient . Equation 5 is where the absorption calculations from the optical properties model feed into the heat transfer model. Initially, Qabs is computed using the RF module (eq 4). This value is then used as the heat source in eq 5.35,40,41
For anisotropic nanoparticles such as the GNR, their optical absorption is polarization dependent. The RF module was used to calculate the average heat power across all possible orientations and use this value as the heat generated by a nanoparticle in any orientation or even in an array where nanoparticles are randomly oriented.
Considering that we are not working with propagating waves anymore, the truncation method (PMLs) is no longer required, and so the size of the domain is not restricted. A 3 μm sphere was placed around the particle to act as a surrounding medium (water) as shown in Figure 1b.
Experimental Methods.
Synthesis of the GNPs.
Synthesis of gold nanobipyramids and gold nanorods followed seed-mediated growth protocols. For the GNRs, seeds were synthesized using a method modified from Nikoobakht et al., and the growth solution preparation was modified from Vigderman et al. To make seed solution, CTAB (5 mL, 0.2 M) was added to HAuCl4 (5 mL, 0.5 mM) in a 15 mL Falcon tube while gently stirring, creating a bright orange solution. Freshly prepared, ice cold NaBH4 solution (600 μL, 0.01 M) was then added and thus changed the solution to a pale brown color. The seed solution was set aside at room temperature for at least 2 h before use. For the growth solution, CTAB (5 mL, 0.2 M) was added to HAuCl4 (5 mL, 1 mM) in a fresh 50 mL Falcon tube. AgNO3 (70 μL, 0.01 M) was added and inverted several times to mix. Hydroquinone (500 μL, 0.1 M) was then added, followed by gently inverted mixing until the solution turned clear and colorless. Afterward, the seed solution (160 μL) was finally added to the growth solution, inverted to mix, and allowed to incubate overnight for nanorod growth.42–45 For the GBPs, synthesis was carried out as in Liu and Guyot-Sionnest.46
UV–vis Spectroscopy and Imaging of the GNPs.
Characterization of the LSPRs was performed via UV–vis using a FLAME-CHEM-VIS-NIR spectrometer (Ocean Optics; Largo, FL) for nanoparticles in the range of 500–550 nm in order to compare the simulated results and those obtained experimentally. Images of the different nanoparticles were obtained using a TEM with the JEM-1400 Plus (JEOL USA, Inc. Peabody, MA). ImageJ was used to measure the dimensions of the nanoparticles so that the computational models accurately resemble the nanoparticles synthesized in the lab.
Photothermal Heating Experiments.
The nanoparticle heating measurements were carried out using a red laser at 655 nm wavelength and 150 mW (DL655-150, CrystaLaser; Reno, NV). We measured the heating in two samples with nanoparticles at OD = 1 and one control sample with water only. The nanoparticle samples were nanorods and nanobiopyramids synthesized to have resonance at the laser’s wavelength, and the temperature measurements were taken using a Temp-300 thermocouple datalogging thermometer (Oakton Instruments; Vernon Hills, IL) until a steady state was reached (~22 min).
RESULTS AND DISCUSSION
Verification of the Computational Models.
The computational models were verified by comparing the results obtained computationally with the analytical results obtained following Mie theory.47 Since the analytical solution is available only for spherical nanoparticles, we used Mie theory to calculate the spectra of various GNSs accross several wavelengths and with different surrounding media. These analytical solutions were then compared with the numerical simulations obtained when using a computational model with the same surrounding media and a spherical geometry of the same dimensions. Figure 2 shows an excellent agreement between the computational and the analytical results for spheres of two sizes: a 150 nm sphere in air and a 50 nm sphere in water. The average error is 2.3% and 4.2% for the nanoparticle in air and water, respectively. It can be noticed that, as expected, a smaller particle has a higher absorption cross-section, whereas the scattering cross-section is more predominant in the larger-sized particle.
Validation of the Computational Models.
To validate the computational models measuring light–nanoparticle interactions (light absorption), we compared the UV–vis absorbance spectra obtained from samples of GNRs and GBPs synthesized in our lab, with the spectra obtained from corresponding computational models of individual GNR and GBP.
TEM images of the samples were taken (left column of Figure 3), and the individual GNPs were generated based on the average dimensions (length, L; width, W; and tip radius, R) measured from the images. The experimental UV–vis spectra (center column of Figure 3) were measured in arbitrary units, and the calculated spectra (right column of Figure 3) were computed following eq 1. The optical efficiencies were obtained for the simulated spectra as the ratio between the power absorbed by the particle (σabs) and the cross-sectional area of a sphere with equivalent volume (Aeq).
Figure 3.
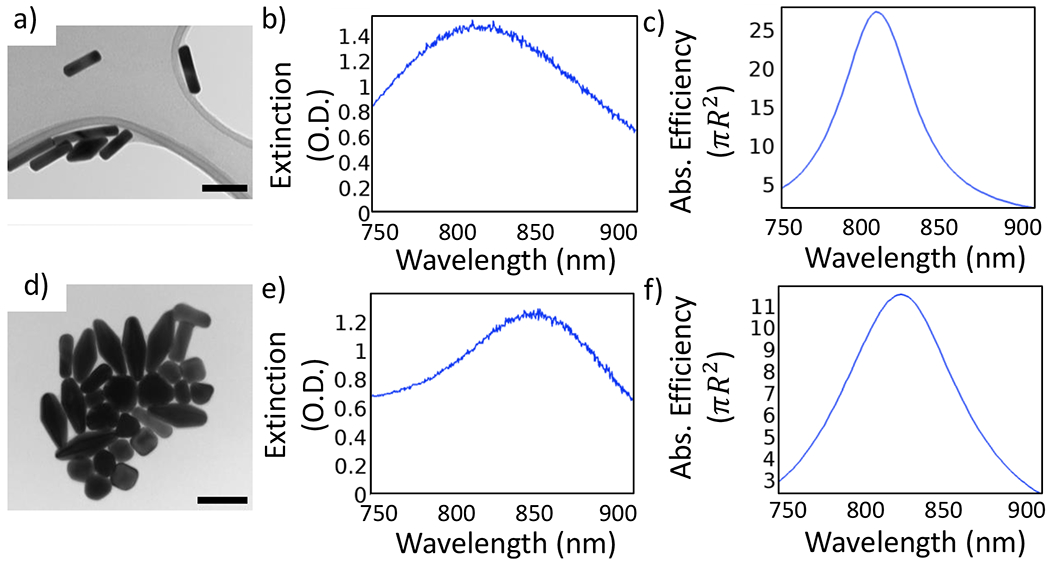
TEM images of (a) nanorods and (d) bipyramids were measured to generate computational models (scale bars are 100 nm). Panels (b) and (e) show the UV–vis spectra of GNRs and GBPs, respectively, at an optical density close to unity at the resonance wavelength. The right column shows the absorption efficiency spectra calculated for a single (c) nanorod and (f) nanobipyramid. The efficiency was calculated as σabs/Aeq, with Aeq being the cross-sectional area of a sphere with volume equivalent to that of the nanorod (Req = 22 nm) or the nanobipyramid (Req = 34 nm).
UV–vis spectroscopy measures the absorbance as the amount of photons that do not pass through the sample at a given wavelength, whereas the calculated spectra indicate how strong the absorption is for a single nanoparticle. Keeping this difference in mind, the comparison made between experimental and computational spectra is in terms of the plasmon peak location. It can be noticed that the plasmon resonance wavelengths are similar between the simulated and measured spectra for both nanoparticle types. However, due to the inhomogeneity in the samples (particles of different sizes and shapes as well as additional byproducts and aggregates resulting from the synthesis process), the breadth of the peaks observed in the experimental spectra is different from the ones observed in the simulations.
The measured dimensions (avg ± Std Dev) obtained from the TEM images of the nanorod sample were L = 97 ± 20 nm, W = 25 ± 2 nm, and R = 8 ± 3 nm. The measured dimensions (avg ± Std Dev) from the bipyramid sample were L = 97 ± 20 nm, W = 25 ± 2 nm, and R = 8 ± 3 nm. Based on these measurements, the computational GNR model had dimensions of L = 91 nm, W = 26 nm, and R = 11 nm, while the dimensions of the computational GBP model were L = 158 nm, W = 58 nm, and R = 8 nm.
It is observed, however, that the calculated spectra yield a similar resonance wavelength only in the case of the nanorod sample (peak at 807 nm). The blue shift observed when comparing the experimental and simulated bipyramid (experimental peak at 850 nm and calculated peak at 820 nm) can be attributed to the fact that the nanobipyramids found in the experimental sample are heterogeneous in shape, whereas the simulations were carried out with only one particle. For the remainder of this work, we will focus on the simulation results, and thus we assume that the resonance wavelength of the GBP is 820 nm.
Potential PPTT Implementation.
For implementation as photothermal agents, the desired GNPs must exhibit high absorptive properties in the NIR (~800 nm). For this purpose, six different computational models of nanoparticles were compared: two rods, two bipyramids, and two spheres.
The GNR and GBP samples synthesized in the lab (Figure 3) showcase resonance wavelengths appropriate for NIR implementation; however, the peaks were not close enough to conduct a one-to-one comparison between the two samples (GNR peak at 807 nm and GBP peak at 820 nm), so two new models were generated: a GNR that peaks at 820 nm and a GBP that peaks at 807. These additional models were developed by modifying only the length of the TEM-based model in order to match the desired resonance wavelength.
The spherical models were generated based on the volume measured from the TEM of the gold nanorods and the gold bipyramids. The radii of the modeled spheres were chosen so that their volume would be equal to the volume of the modeled GNR and GBP (Req = 34 nm in the case of the GBP and Req = 22 nm in the case of the GNR).
It is worth noting that both width and tip radius remain unchanged for the two nanorod models (W = 26 nm; R =11 nm) as well as for the two nanobipyramid models (W = 58 nm; R = 8 nm). For this reason, the dimensions column of Table 1 reports only the length, L, of the GNR and GBP and the diameters of the GNS
Table 1.
Nanoparticle Dimensions, Their LSPR Wavelength, and Absorbed Power Densities
| nanoparticle type | dimensions [nm] | LSPR [nm] | absorbed power density at 0° [mW/μm3] | absorbed power density at 90° [mW/μm3] | avg. absorbed power density [mW/μm3] |
|---|---|---|---|---|---|
| nanorod | 91 | 807 | 933.89 | 0.33 | 311.52 |
| nanorod | 94 | 820 | 777.68 | 0.33 | 259.44 |
| nanobipyramid | 153 | 807 | 248.77 | 0.45 | 83.22 |
| nanobipyramid | 158 | 820 | 234.46 | 0.44 | 78.45 |
| nanosphere | 68 | 536 | 0.80 | 0.80 | 0.80 |
| nanosphere | 44 | 528 | 0.67 | 0.67 | 0.67 |
Depending on the size and shape of the nanoparticle, it will exhibit either the highest absorbance or the highest scattering when the longitudinal modes are excited at the resonance wavelength. With our model, the maximum light absorption is measured when the wave’s propagation vector (k) is perpendicular to the longitudinal axis of a nonspherical nanoparticle, and the polarization of the wave (E) is parallel to the longitudinal axis. The opposite configuration yields the minimum amount of power absorbed: k parallel to the longitudinal axis of the GNP and E perpendicular.
The orientation-dependent nature of the power absorption was accounted for by calculating a mean power absorbed as the average between three configurations of light propagation: the first configuration is where E and the longitudinal axis of the particle are parallel , and the other two configurations, grouped together as they yield the same value, are where E and the longitudinal axis are perpendicular . This average absorbed power density can be written as
| (6) |
and is reported in Table 1 for each nanoparticle.
Solving Maxwell’s equations in the light–nanoparticle system allowed for the calculation of the electric field enhancement induced by the plasmon excitation in the GNPs. The magnitude of both absorbed power and field enhancement also depends on the light intensity used. Based on the typical values found in the literature,35,40,41 we chose an irradiance of 1 mW/μm2 and a wavelength of 808 nm. Given the size difference between the laser beam spot and the nanoparticle, a plane wave model was implemented, and the amplitude was calculated using the relationship between the wave’s amplitude and irradiance (see eq 3 of the Supporting Information). The effect of size and shape in the electric field enhancement for a single GNR, GBP, and GNS can be observed on the left column of Figure 4, and a volume map of the total power dissipation density (power absorbed by the same particles) is shown on the right column of Figure 4. This power density was then utilized in eq 4 and ultimately in eq 6.
Figure 4.
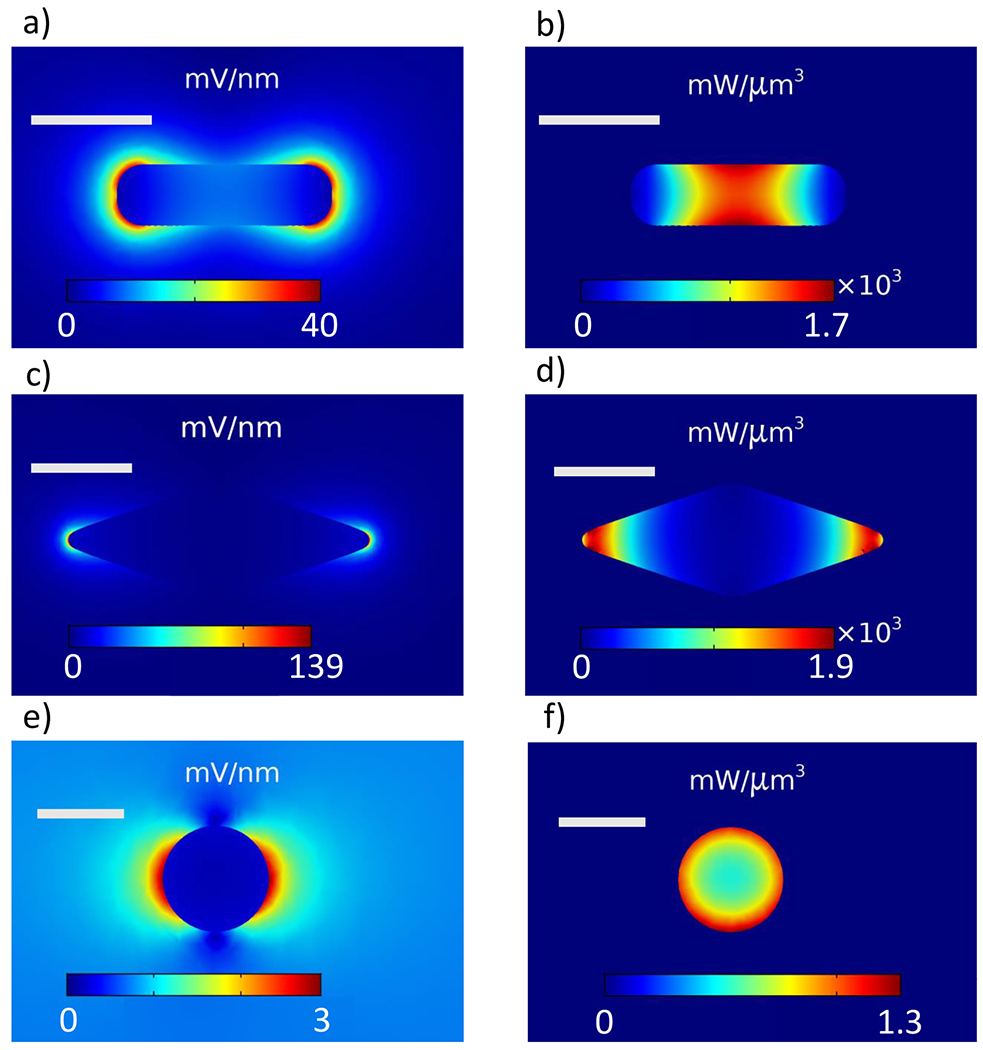
On the left column: electric field magnitude under a plane wave illumination of 808 nm wavelength and 1 mW/μm2 irradiance for (a) a 91 nm nanorod, (c) a 153 nm nanobipyramid, and (e) a 68 nm nanosphere. On the right column: Power absorbed by (b) a 91 nm nanorod, (d) a 153 nm nanobipyramid, and (f) a 68 nm nanosphere under the same illumination. Scale bars are 50 nm.
The results observed in both Table 1 and Figure 4 indicate that the nanorods absorb the highest amount of power when under illumination of a 808 nm laser. More specifically, the 91 nm long GNR absorbs more power than the 94 nm GNR due to the close proximity between the particle’s resonance wavelength and laser’s wavelength. Furthermore, it is observed that the bipyramid models show a considerable amount of absorbed power, despite being over 50% larger than the rods. Thus, we may assume that both the rod and the bipyramid geometries could be good candidates for plasmonic heating applications. However, size limitations inherent to the particular application need to be taken into consideration. Additionally, shape effects are observed as the individual spherical models do not absorb a significant amount of power despite having the same volume as the GNR and GBP models and, therefore, are not suitable for plasmonic heating in the NIR region due to their low power absorption levels at these wavelengths.
Nanoparticle Heating.
We have shown that both the GNRs and the GBPs absorb significant amounts of power in the NIR region, and now we will measure the change in temperature achieved by each particle due to the amount of absorbed power under 808 nm laser illumination. The average power absorbed by the individual particles will be used as a heat source in the heat transfer model (eq 5).
The maximum temperatures reached by the six nanoparticles used in this work, along with the average absorbed power used for the calculations, are reported in Table 2. The heat maps of the three nanoparticles exhibiting the highest temperature reached (within each type) are shown in Figure 5.
Table 2.
Average Absorbed Power Density Per Unit Volume for Different Types of Nanoparticles and the Maximum Temperature Reached
| nanoparticle type | dimensions [nm] | avg. absorbed power density [mW/μm3] | max. temperature [°C] |
|---|---|---|---|
| nanorod | 91 | 311.52 | 101.1 |
| nanorod | 94 | 259.44 | 91.7 |
| nanobipyramid | 153 | 83.22 | 80.2 |
| nanobipyramid | 158 | 78.45 | 78.4 |
| nanosphere | 68 | 0.80 | 37.5 |
| nanosphere | 44 | 0.67 | 37.1 |
Figure 5.
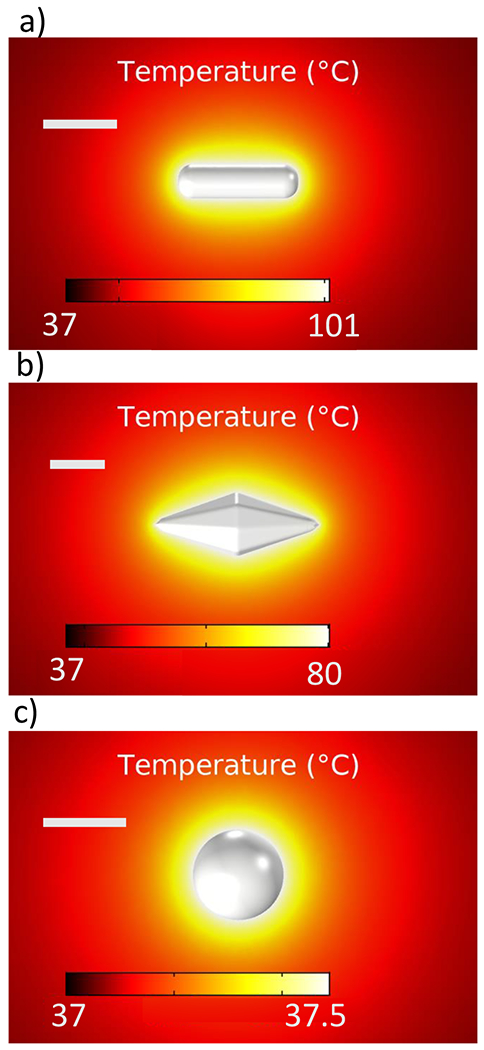
Steady-state temperature maps of (a) a 91 nm GNR, (b) a 153 nm GBP, and (c) a 68 nm GNS. Scale bars are 50 nm.
As expected, since the nanorods absorbed the highest amount of power, they also reach the highest temperature out of the three shapes compared, with the 91 nm nanorod being the one that reached the highest temperature (101 °C). These results correlate to the trends observed experimentally, where a 655 nm laser was used to heat three samples: GNRs, GBPs, and pure water. After 22 min, the system reached a steady state, and it was observed that the nanorods induced a temperature change of ~5 °C; however, the GBPs induced a temperature increase of ~2 °C. Water alone did not show any temperature increase under laser illumination (Figure 6).
Figure 6.
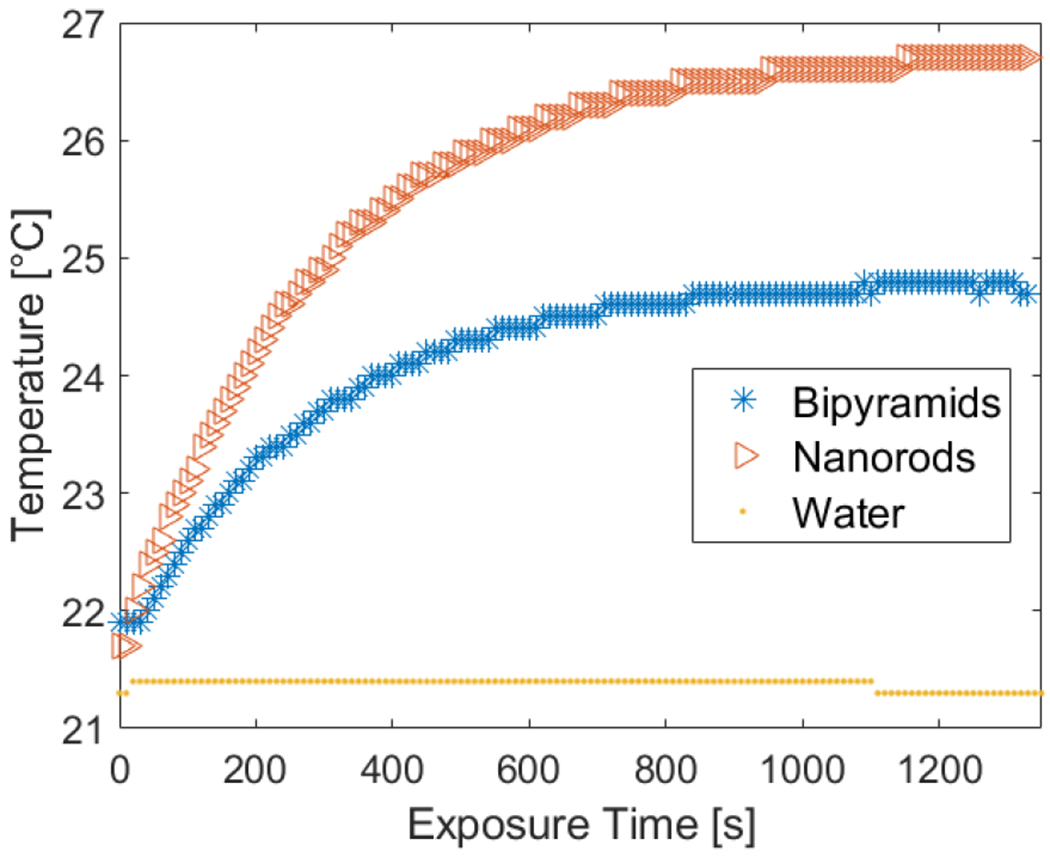
Plasmonic heating experiments using a 655 nm laser to induce heating in nanorods, nanobipyramids, and pure water.
Interestingly, both the experiments and the simulations show that the bipyramids can also induce a temperature increase. Table 2 shows that the smaller GBP reaches a higher temperature than the larger GBP. Similar to the GNR, the smaller bipyramid has a plasmon resonance wavelength closer to the wavelength of the laser; thus, the plasmonic effect is enhanced, and the subsequent heating is higher. This finding provides a sound argument to the initial thought presented earlier: both GNRs and GBPs can achieve significant heating under NIR illumination, thus making them good candidates for plasmonic heating applications. Because they exhibited the highest temperature increase, we select the 91 nm GNR as the best morphology for plasmonic heating under NIR illumination.
Ensemble Effect.
Now that we have chosen the 91 nm nanorod as the ideal geometry, we can study the effect induced by multiple particles of the same size and shape (i.e., ensemble effects) in different arrangements: a 3-dimensional array to represent a nanoparticle distribution throughout a volume and a 2-dimensional array to represent the nanoparticles deposited on a surface. Both the 2D and 3D models measure the effect posed by changing the distance between the nanoparticles (i.e., changes in the concentration). We tested two different concentrations, 1 and 22 nM: the former resulted in an interparticle spacing of ~1100 nm, whereas the latter resulted in an interparticle spacing of ~420 nm. These interparticle spacings are much larger than the nanoparticle size, so we expect that interparticle near-field interactions are insignificant. An approximation of the randomly distributed nanoparticles can be obtained by modeling a perfect cubic (3D) or square (2D) lattice array where the distance between nanoparticles is controlled by the concentration of the solution. Both arrays are composed of a finite amount of nanoparticles: 27 GNRs in the 3D array and 9 in the 2D array, allowing us to simulate the effects in the micron scale. Crucially, the heat power calculated from one nanoparticle in the nanoscale simulation (as described in the Nanoparticle Heating Section) is input into the micron-scale simulation as the new heat source power, thus bridging the two length scales in our computational model. The interparticle spacing in these systems is much smaller than the laser beam spot and the light decay length in the solution, so it can be assumed that each particle absorbs the same amount of power as its immediate neighbors.36 It is worth noting that a randomly distributed array of nanoparticles may enable increased interparticle interactions; future work is underway to evaluate this effect. For this reason, and to account for the random orientation observed experimentally, the average power density absorbed by a single 91 nm long GNR (Table 2) was assigned to each particle in the array, and the heat transfer for the different configurations was calculated using a steady state model. Figure 7 shows the temperature maps computed for the 3D model in both concentrations.
Figure 7.
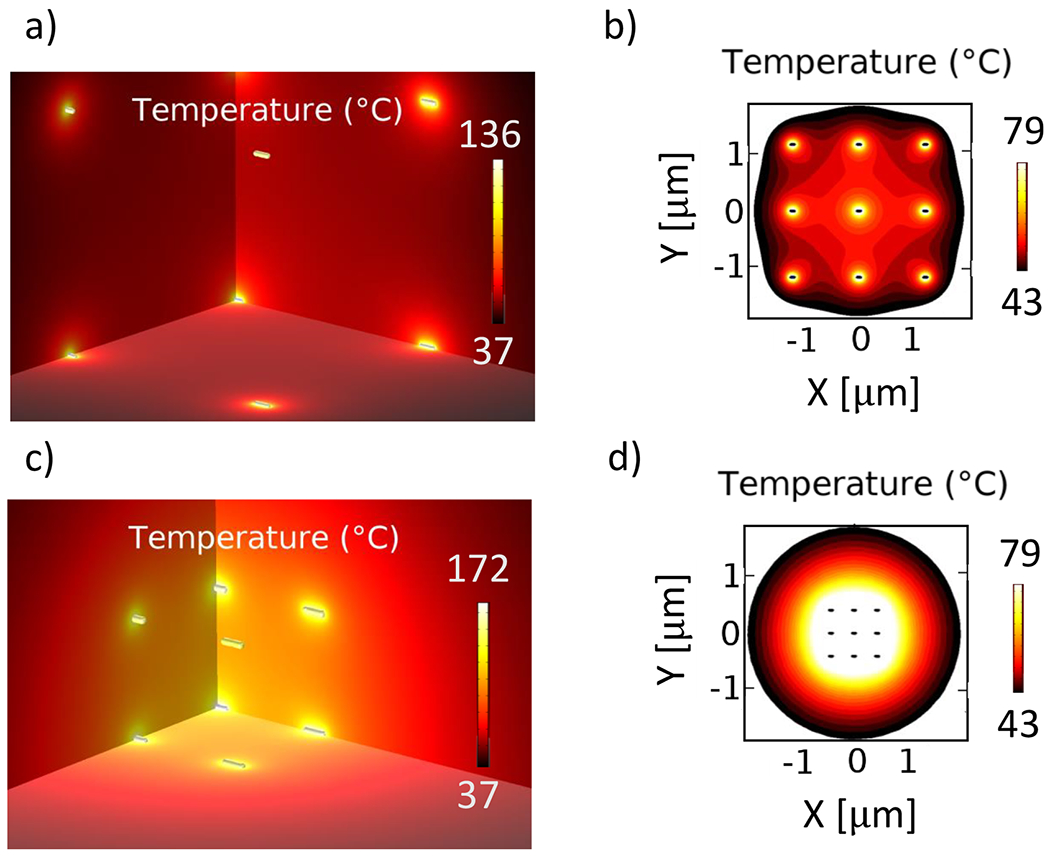
Temperature spatial distribution around an array of 91 nm long nanorods concentrated at 1 nM (top row) and 22 nM (bottom row). (a) and (c) show the 3D heat maps on a quarter section of the arrays. (b) and (d) show the distribution of heat in the plane where hyperthermia levels (T > 43 °C) are reached. The heat sources are set at 311.52 mW/μm3. The surrounding medium is a 5 μm sphere of water.
As mentioned above, the average power absorbed by the 91 nm GNR (311.52 mW/μm3) was assigned to each one of the particles in the array. Each of them contains 27 NRs arranged on a cubic lattice. The steady state heat transfer simulations from the 3D arrays at different concentrations show that the area where hyperthermia levels are reached (T > 43 °C) is similar in size for both systems: the 1 nM system induced hyperthermia levels over a region of 24.4 μm3, whereas the region affected by the heating of the 22 nM system has a volume of 28.7 μm3. Although the volume experiencing the plasmonic heating is similar, the highly concentrated system reached higher temperatures than the diluted one, indicating that a solution with higher concentration of GNPs absorbs greater amounts of light,36 thus inducing hyperthermia levels much faster while containing the effect within one micron from the center of the array. Comparing these results to those observed in the photothermal heating experiment (Figure 6), where the measured temperature increase observed in the GNR sample was about 5 °C (measured 5 mm away from the laser spot), and considering that the experimental sample had an optical density of approximately 1 at the resonance wavelength, it can be compared to the 1 nM simulated system which also shows a temperature increase of at least 5 °C around the boundaries of the simulation domain, as well as an average temperature increase of 7 °C throughout its volume.
For the 2D case, it is important to consider possible interface effects, e.g., for nanoparticles on a substrate or at the interface between two different substances or tissues.48,49 To check whether interface effects would be significant, one simulation was run with a 2D array of nanorods placed at a water–glass interface, and another simulation contained the 2D array surrounded by water only. There was a negligible difference between the optical absorbance between the array at the glass–water interface and the one surrounded by water. For this reason, and to reduce computational time, the heat maps of the 2-dimensional arrays at 1 and 22 nM are calculated without substrate and are shown in Figure 8. These maps show a behavior comparable to the one observed with the 3D array, but the regions where hyperthermia levels are reached are significantly smaller: the 1 nM system induced hyperthermia in the areas surrounding the particles but no further than 400 nm away from each particle. The 22 nM array induced hyperthermic levels within a region of ~1.5 μm, smaller than its 3D counterpart but significantly larger than the 2-dimensional array at 1 nM. This indicates that the heating effect of GNPs in 2D, similar to the 3D case, is enhanced with increased concentration.
Figure 8.
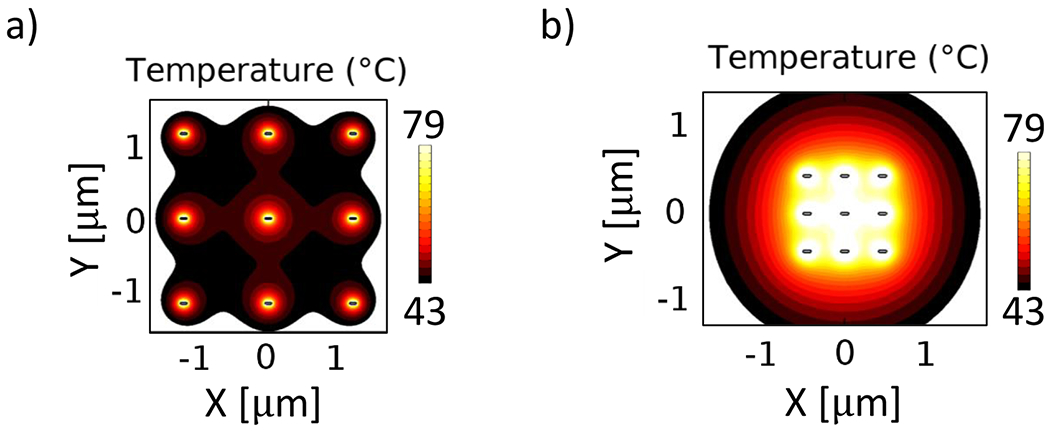
Heat generated by a 2D array of nanorods at (a) 1 nM and (b) 22 nM. Each particle was assigned an average heat source power of 311.52 mW/μm3 as reported for the average power absorbed by a single 91 nm GNR. The surrounding medium is a 5 μm sphere of water
CONCLUSIONS
We have developed computational models that successfully describe the plasmonic excitation of single gold nanoparticles, the subsequent heat generation due to power absorption from laser illumination, and its effects on temperature distribution throughout the surrounding medium. We developed these models in a FEM framework such as in COMSOL Multiphysics to provide the community with a complete and detailed set of procedures to enable a widespread of such a type of PPTT modeling. Comparing GNPs of different sizes and shapes confirmed the gold nanorod as the particle shape with the greatest heat power per unit volume; more specifically, the 91 nm GNR was found to have optimal heat generation. Additionally, due to the small size of the nanoparticle and the location of its resonance wavelength in the NIR, the GNR can be used as a photothermal agent in applications such as PPTT. Furthermore, the concentrations chosen for this study represent realistic concentrations of nanoparticles which would be used in medical applications, and it was found that arrays of nanorods can induce hyperthermic levels in the surrounding medium at low and high concentrations. Moreover, highly concentrated solutions induce hyperthermia over a larger volume. We note that our computational model showcases qualitative agreement with the experiments regarding the localized temperature increase, as well as the trend of GNRs exhibiting the highest amount of heating, followed by the GBPs. Locally concentrated GNRs, especially through methods like molecular targeting, will enhance the clustering effects and enable higher temperature increase within the target region as is the purpose of plasmonic heating applications.
Supplementary Material
ACKNOWLEDGMENTS
The authors thank Barbara Hunter and the UT Health San Antonio electron microscopy lab for their assistance. S.K. and L.T. thank the financial support partly by the US Department of Agriculture (2015-38422-24059). Research was sponsored by the Army Research Office and was accomplished under Grant Number W911NF-18-1-0439. The views and conclusions contained in this document are those of the authors and should not be interpreted as representing the official policies, either expressed or implied, of the Army Research Office or the U.S. Government. Research reported in this publication was supported by the National Institute of General Medical Sciences of the National Institutes of Health under award number SC2 GM118273.
Footnotes
Supporting Information
The Supporting Information is available free of charge at https://pubs.acs.org/doi/10.1021/acs.jpcc.0c02443.
Discussion about the mathematical model for calculating the optical absorbance of GNPs. Details on the numerical setup to simulate the light–nanoparticle interactions, the PML, and boundary conditions for the electromagnetic simulations and the heat transfer simulations (PDF)
Complete contact information is available at: https://pubs.acs.org/10.1021/acs.jpcc.0c02443
Complete contact information is available at: https://pubs.acs.org/10.1021/acs.jpcc.0c02443
The authors declare no competing financial interest.
Contributor Information
Santiago Manrique-Bedoya, Department of Mechanical Engineering, The University of Texas at San Antonio, San Antonio, Texas 78249, United States.
Mohammad Abdul-Moqueet, Department of Physics and Astronomy, The University of Texas at San Antonio, San Antonio, Texas 78249, United States.
Priscilla Lopez, Department of Physics and Astronomy, The University of Texas at San Antonio, San Antonio, Texas 78249, United States.
Tara Gray, Department of Physics and Astronomy, The University of Texas at San Antonio, San Antonio, Texas 78249, United States.
Matthew Disiena, Department of Physics and Astronomy, The University of Texas at San Antonio, San Antonio, Texas 78249, United States.
Andrew Locker, Department of Physics and Astronomy, The University of Texas at San Antonio, San Antonio, Texas 78249, United States.
Sharon Kwee, Department of Biomedical Engineering, The University of Texas at San Antonio, San Antonio, Texas 78249, United States.
Liang Tang, Department of Biomedical Engineering, The University of Texas at San Antonio, San Antonio, Texas 78249, United States.
R. Lyle Hood, Department of Mechanical Engineering, The University of Texas at San Antonio, San Antonio, Texas 78249, United States.
Yusheng Feng, Department of Mechanical Engineering, The University of Texas at San Antonio, San Antonio, Texas 78249, United States.
Nicolas Large, Department of Physics and Astronomy, The University of Texas at San Antonio, San Antonio, Texas 78249, United States.
Kathryn M. Mayer, Department of Physics and Astronomy, The University of Texas at San Antonio, San Antonio, Texas 78249, United States.
REFERENCES
- (1).Breasted JH The Edwin Smith Surgical Papyrus: published in facsimile and hieroglyphic transliteration with translation and commentary in two volumes; Chic. UP, 1930; Vol. 3. [Google Scholar]
- (2).Ebbell B The Papyrus Ebers: the greatest Egyptian medical document; Levin & Munksgaard, 1937. [Google Scholar]
- (3).Huang X; Jain PK; El-Sayed IH; El-Sayed MA Plasmonic photothermal therapy (PPTT) using gold nanoparticles. Lasers in medical science 2008, 23, 217. [DOI] [PubMed] [Google Scholar]
- (4).Hughes JT The Edwin Smith Surgical Papyrus: an analysis of the first case reports of spinal cord injuries. Spinal Cord 1988, 26, 71. [DOI] [PubMed] [Google Scholar]
- (5).Sullivan R The identity and work of the ancient Egyptian surgeon. J. R. Soc. Med 1996, 89, 467–473. [DOI] [PMC free article] [PubMed] [Google Scholar]
- (6).Svaasand LO; Gomer CJ; Morinelli E On the physical rationale of laser induced hyperthermia. Lasers in Medical Science 1990, 5, 121–128. [Google Scholar]
- (7).Huang X; Qian W; El-Sayed IH; El-Sayed MA The potential use of the enhanced nonlinear properties of gold nanospheres in photothermal cancer therapy. Lasers Surg. Med 2007, 39, 747–753. [DOI] [PubMed] [Google Scholar]
- (8).Li X; Yu S; Lee D; Kim G; Lee B; Cho Y; Zheng B-Y; Ke M-R; Huang J-D; Nam KT; et al. Facile supramolecular approach to nucleic-acid-driven activatable nanotheranostics that overcome drawbacks of photodynamic therapy. ACS Nano 2018, 12, 681–688. [DOI] [PubMed] [Google Scholar]
- (9).Kapany N; Peppers N; Zweng H; Flocks M Retinal photocoagulation by lasers. Nature 1963, 199, 146–149. [DOI] [PubMed] [Google Scholar]
- (10).Jacques SL; Prahl SA Absorption Spectra for Biological Tissues. 1998; https://omlc.org/classroom/ece532/class3/muaspectra.html; accessed 4/12/2019.
- (11).Partovi F; Izatt J; Cothren R; Kittrell C; Thomas J; Strikwerda S; Kramer J; Feld M A model for thermal ablation of biological tissue using laser radiation. Lasers Surg. Med 1987, 7, 141–154. [DOI] [PubMed] [Google Scholar]
- (12).Hood RL; Andriani RT Jr; Emch S; Robertson JL; Rylander CG; Rossmeisl JH Jr Fiberoptic microneedle device facilitates volumetric infusate dispersion during convection-enhanced delivery in the brain. Lasers Surg. Med 2013, 45, 418–426. [DOI] [PubMed] [Google Scholar]
- (13).Sultan R Tumour ablation by laser in general surgery. Lasers in Medical Science 1990, 5, 185–193. [Google Scholar]
- (14).Svelto O; Hanna DC Principles of lasers; Springer, New York: 1998. [Google Scholar]
- (15).Hood RL; Carswell WF; Rodgers A; Kosoglu MA; Rylander MN; Grant D; Robertson JL; Rylander CG Spatially controlled photothermal heating of bladder tissue through single-walled carbon nanohorns delivered with a fiberoptic microneedle device. Lasers in medical science 2013, 28, 1143–1150. [DOI] [PMC free article] [PubMed] [Google Scholar]
- (16).Bayazitoglu Y; Kheradmand S; Tullius TK An overview of nanoparticle assisted laser therapy. Int. J. Heat Mass Transfer 2013, 67, 469–486. [Google Scholar]
- (17).Choi WI; Kim J-Y; Kang C; Byeon CC; Kim YH; Tae G Tumor regression in vivo by photothermal therapy based on gold-nanorod-loaded, functional nanocarriers. ACS Nano 2011, 5, 1995–2003. [DOI] [PubMed] [Google Scholar]
- (18).Kennedy LC; Bickford LR; Lewinski NA; Coughlin AJ; Hu Y; Day ES; West JL; Drezek RA A new era for cancer treatment: gold-nanoparticle-mediated thermal therapies. Small 2011, 7, 169–183. [DOI] [PubMed] [Google Scholar]
- (19).Carpin LB; Bickford LR; Agollah G; Yu T-K; Schiff R; Li Y; Drezek RA Immunoconjugated gold nanoshell-mediated photothermal ablation of trastuzumab-resistant breast cancer cells. Breast Cancer Res. Treat 2011, 125, 27–34. [DOI] [PubMed] [Google Scholar]
- (20).Baffou G; Quidant R Thermo-plasmonics: using metallic nanostructures as nano-sources of heat. Laser & Photonics Reviews 2013, 7, 171–187. [Google Scholar]
- (21).Kim J; Kim J; Jeong C; Kim WJ Synergistic nanomedicine by combined gene and photothermal therapy. Adv. Drug Delivery Rev 2016, 98, 99–112. [DOI] [PubMed] [Google Scholar]
- (22).Kemp JA; Shim MS; Heo CY; Kwon YJ Combo” nanomedicine: co-delivery of multi-modal therapeutics for efficient, targeted, and safe cancer therapy. Adv. Drug Delivery Rev 2016, 98, 3–18. [DOI] [PubMed] [Google Scholar]
- (23).Sztandera K; Gorzkiewicz M; Klajnert-Maculewicz B Gold nanoparticles in cancer treatment. Mol. Pharmaceutics 2019, 16, 1–23. [DOI] [PubMed] [Google Scholar]
- (24).Bao Z; Liu X; Liu Y; Liu H; Zhao K Near-infrared light-responsive inorganic nanomaterials for photothermal therapy. Asian J. Pharm. Sci 2016, 11, 349–364. [Google Scholar]
- (25).Weissleder R A clearer vision for in vivo imaging; Nature Publishing Group: 2001. [DOI] [PubMed] [Google Scholar]
- (26).Weissleder R; Ntziachristos V Shedding light onto live molecular targets. Nat. Med 2003, 9, 123. [DOI] [PubMed] [Google Scholar]
- (27).Stolik S; Delgado J; Perez A; Anasagasti L Measurement of the penetration depths of red and near infrared light in human “ex vivo” tissues. J. Photochem. Photobiol., B 2000, 57, 90–93. [DOI] [PubMed] [Google Scholar]
- (28).Feng Y; Rylander M; Bass J; Oden J; Diller K Optimal design of laser surgery for cancer treatment through nanoparticle-mediated hyperthermia therapy. NSTI-Nanotechnol. 2005, 39–42. [Google Scholar]
- (29).Feng Y; Fuentes D; Hawkins A; Bass J; Rylander MN; Elliott A; Shetty A; Stafford RJ; Oden JT Nanoshell-mediated laser surgery simulation for prostate cancer treatment. Engineering with computers 2009, 25, 3–13. [DOI] [PMC free article] [PubMed] [Google Scholar]
- (30).Xu X; Meade A; Bayazitoglu Y Numerical investigation of nanoparticle-assisted laser-induced interstitial thermotherapy toward tumor and cancer treatments. Lasers in medical science 2011, 26, 213–222. [DOI] [PubMed] [Google Scholar]
- (31).Oakley E; Wrazen B; Bellnier DA; Syed Y; Arshad H; Shafirstein G A new finite element approach for near real-time simulation of light propagation in locally advanced head and neck tumors. Lasers Surg. Med 2015, 47, 60–67. [DOI] [PMC free article] [PubMed] [Google Scholar]
- (32).Saccomandi P; Schena E; Caponero MA; Di Matteo FM; Martino M; Pandolfi M; Silvestri S Theoretical analysis and experimental evaluation of laser-induced interstitial thermotherapy in ex vivo porcine pancreas. IEEE Trans. Biomed. Eng 2012, 59, 2958–2964. [DOI] [PubMed] [Google Scholar]
- (33).Parsons J; Burrows C; Sambles J; Barnes W A comparison of techniques used to simulate the scattering of electromagnetic radiation by metallic nanostructures. J. Mod. Opt 2010, 57, 356–365. [Google Scholar]
- (34).MacLellan CJ; Fuentes D; Elliott AM; Schwartz J; Hazle JD; Stafford RJ Estimating nanoparticle optical absorption with magnetic resonance temperature imaging and bioheat transfer simulation. Int. J. Hyperthermia 2014, 30, 47–55. [DOI] [PMC free article] [PubMed] [Google Scholar]
- (35).Baffou G; Quidant R; Girard C Heat generation in plasmonic nanostructures: Influence of morphology. Appl. Phys. Lett 2009, 94, 153109. [Google Scholar]
- (36).Hogan NJ; Urban AS; Ayala-Orozco C; Pimpinelli A; Nordlander P; Halas NJ Nanoparticles heat through light localization. Nano Lett. 2014, 14, 4640–4645. [DOI] [PubMed] [Google Scholar]
- (37).Mie G On optical characteristics of turbid media, with special reference to colloid metallic solutions. Ann. Phys 1908, 330, 377–445. [Google Scholar]
- (38).Bohren CF; Huffman DR Absorption and scattering of light by small particles; John Wiley & Sons, 2008. [Google Scholar]
- (39).Yushanov S; Crompton JS; Koppenhoefer KC Mie scattering of electromagnetic waves. Proc. COMSOL conf 2013, 1–7. [Google Scholar]
- (40).Baffou G; Quidant R; García de Abajo FJ Nanoscale control of optical heating in complex plasmonic systems. ACS Nano 2010, 4, 709–716. [DOI] [PubMed] [Google Scholar]
- (41).Govorov AO; Richardson HH Generating heat with metal nanoparticles. Nano Today 2007, 2, 30–38. [Google Scholar]
- (42).Nikoobakht B; El-Sayed MA Preparation and growth mechanism of gold nanorods (NRs) using seed-mediated growth method. Chem. Mater 2003, 15, 1957–1962. [Google Scholar]
- (43).Vigderman L; Zubarev ER High-yield synthesis of gold nanorods with longitudinal SPR peak greater than 1200 nm using hydroquinone as a reducing agent. Chem. Mater 2013, 25, 1450–1457. [Google Scholar]
- (44).Jana NR; Gearheart L; Murphy CJ Seed-mediated growth approach for shape-controlled synthesis of spheroidal and rod-like gold nanoparticles using a surfactant template. Adv. Mater 2001, 13, 1389–1393. [Google Scholar]
- (45).Jana NR; Gearheart L; Murphy CJ Wet chemical synthesis of high aspect ratio cylindrical gold nanorods. J. Phys. Chem. B 2001, 105, 4065–4067. [Google Scholar]
- (46).Liu M; Guyot-Sionnest P; Lee T-W; Gray SK Optical properties of rodlike and bipyramidal gold nanoparticles from three-dimensional computations. Phys. Rev. B: Condens. Matter Mater. Phys 2007, 76 (23), 235428. [Google Scholar]
- (47).Large N Large Group; Widget - Mie scattering. 2015; https://sites.google.com/site/acoustoplasmonics/miewidget; accessed 17/10/2019.
- (48).Sanchot A; Baffou G; Marty R; Arbouet A; Quidant R; Girard C; Dujardin E Plasmonic nanoparticle networks for light and heat concentration. ACS Nano 2012, 6, 3434–3440. [DOI] [PubMed] [Google Scholar]
- (49).Baffou G; Berto P; Bermúdez Ureña E; Quidant R; Monneret S; Polleux J; Rigneault H Photoinduced heating of nanoparticle arrays. ACS Nano 2013, 7, 6478–6488. [DOI] [PubMed] [Google Scholar]
Associated Data
This section collects any data citations, data availability statements, or supplementary materials included in this article.