Abstract
To date, most research into the inhibition of oncogenic transcriptional regulator, Activator Protein 1 (AP-1), has focused on heterodimers of cJun and cFos. However, the Fra1 homologue remains an important cancer target. Here we describe library design coupled with computational and intracellular screening as an effective methodology to derive an antagonist that is selective for Fra1 relative to Jun counterparts. To do so the isCAN computational tool was used to rapidly screen >75 million peptide library members, narrowing the library size by >99.8% to one accessible to intracellular PCA selection. The resulting 131 072-member library was predicted to contain high quality binders with both a high likelihood of target engagement, while simultaneously avoiding homodimerization and off-target interaction with Jun homologues. PCA screening was next performed to enrich those members that meet these criteria. In particular, optimization was achieved via inclusion of options designed to generate the potential for compromised intermolecular contacts in both desired and non-desired species. This is an often-overlooked prerequisite in the conflicting design requirement of libraries that must be selective for their target in the context of a range of alternative potential interactions. Here we demonstrate that specificity is achieved via a combination of both hydrophobic and electrostatic contacts as exhibited by the selected peptide (Fra1W). In vitro analysis of the desired Fra1–Fra1W interaction further validates high Fra1 affinity (917 nM) yet selective binding relative to Fra1W homodimers or affinity for cJun. The isCAN → PCA based multidisciplinary approach provides a robust screening pipeline in generating target-specific hits, as well as new insight into rational peptide design in the search for novel bZIP family inhibitors.
Here we describe library design coupled with computational and intracellular screening as an effective methodology to derive an antagonist that is selective for Fra1 relative to Jun counterparts.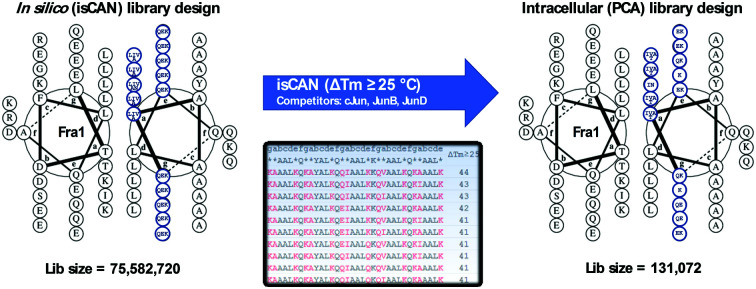
Introduction
Fra1 is an oncogenic transcription factor member of the basic leucine zipper (bZIP) Fos family. Fos proteins (cFos, FosB, Fra1, and Fra2) and Jun proteins (cJun, JunB, and JunD) heterodimerize via a leucine-zipper motif. An adjacent basic domain binds to TPA-responsive element (TRE) DNA to form the Activator Protein-1 (AP-1) complex. Fra1 is encoded by the FOSL1 gene which is found to be highly expressed in multiple tissue-specific cancers where it is associated with tumorigenesis and cancer progression.1 Moreover, Fra1 is involved in neoplastic transformation,2 motility,3 and cancer drug addiction.4 Hence, the ability to selectively inhibit Fra1 represents a powerful approach towards the treatment of many types of cancers, by directly modulating oncogenic signals at the transcriptional level. However, like many protein–protein interactions (PPIs), targeting Fra1 is recognised as a significant challenge owing to its traditional perception as an “undruggable” protein.5,6 It is considered intrinsically disordered and to become transcriptionally active must both fold and heterodimerise via many points of contact over broad and shallow surfaces. Fra1 therefore lacks the key hotspots that are required for inhibition by small molecules, making it difficult to functionally inhibit its activity. Secondly, Fra1 is predominantly located in the nucleus, meaning that targeting with antibody-based approaches is technically impractical. To overcome these obstacles, an alternative approach is to directly abrogate Fra1 oncogenic function using an antagonistic peptide. We performed in-cell library screening to derive peptide inhibitors capable of functioning within the intracellular milieu that can selectively bind with high affinity to Fra1 and disrupt its interactions with other protein partners. The development of antagonists that can function in this environment to sequester Fra1 is therefore of great interest in therapeutic design and discovery.
In particular, the coiled coil dimerization domain has been the focus of much research since it is key in driving the highly specific PPIs required for Fra1 activity. Specific details on coiled coil formation have been discussed extensively elsewhere.7–16 Here we present the derivation of a peptide antagonist that is selective for Fra1 in the presence of Jun-family members, and that is also able to resist homodimerization. The sequence is derived from a combination of in silico and intracellular library screening to target the leucine zipper region of Fra1. In particular a computational semi-rational library design approach was taken that explicitly considers all potential dimeric interactions within the system, including user defined competitors (all Jun family members). This provided a very large in silico library from which peptides were ranked to produce a reduced size, yet high quality library for in-cell screening using protein fragment complementation assay (PCA). This approach enabled the selection of library members with highest affinity and selectivity for Fra1.
Results and discussion
Library design and isCAN strategy
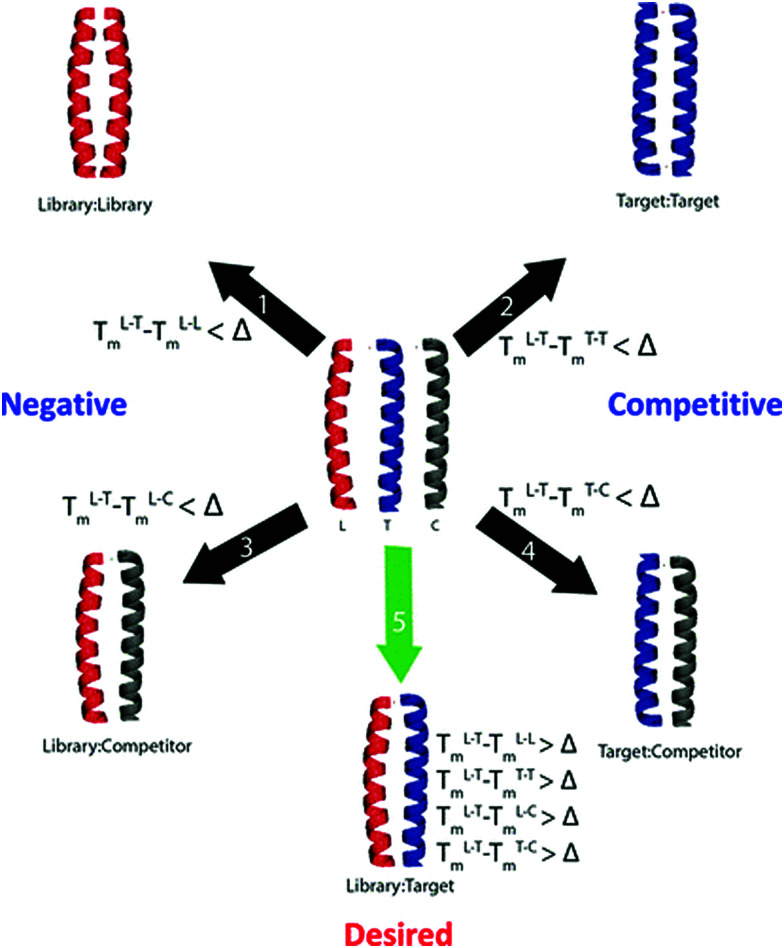
Here we report the use of computational screening as a mechanism to filter a large (75 582 720 member) library into a smaller, yet higher quality library (131 072 member) to identify peptides that can selectively target Fra1. In particular, by vastly reducing the library size to remove members unlikely to fulfil the desired criteria, it becomes readily accessible to our intracellular screening approach, containing many members with the predicted desired properties and therefore an increased likelihood of highly selective binders. The approach makes extensive use of the bZIP Coiled Coil Prediction Algorithm (bCIPA),17,18 which works by predicting the Tm of a dimeric coiled coil based only on primary sequence information. bCIPA has been used as the basis for in silico tools that can mimic both the Protein-fragment Complementary Assay (PCA) in identifying high affinity coiled coils, and Competitive And Negative Design Initiative (CANDI) to render them specific in the presence of competitor sequences.18 The in silico PCA (isPCA) and in silico CANDI (isCAN) equivalents (Fig. 1)20–22 can serve as useful tools in reducing much larger libraries, than are accessible experimentally, to those that are smaller and of high-quality. isCAN predicts the highest affinity peptides with the largest difference between specified target and off-target complexes (ΔTm).19 This includes the potential for both target and library homodimers, as well as multiple user-defined off-targets. In utilizing the underlying bCIPA algorithm, isCAN incorporates helical propensity, core, and electrostatic interactions to provide a quantitative estimate of the interaction affinities in the form of a Tm; the various functions within the algorithm assign scores to the peptide–peptide interactions. In addition to built-in frame alignment and prediction functions, isCAN has a number of unique built-in check points. These make use of the individual predictions relating to the library (L), target (T), and competitor (C) peptides. Owing to optimization of core and electrostatic residues found in designed libraries, many peptide members are predicted to be more stable as homodimeric complexes than as heterodimers with the target. isCAN is therefore split into two sections: the first set of calculations mirroring the PCA (isPCA section) and the second introducing the competitor peptides (isCAN). This stepwise calculation ensures that the processing time is not wasted on library members that are predicted to preferentially homodimerize or are unable to overcome the target homodimer (and are therefore not “PCA-successful”). A key concept in both is the predicted ΔTm. It is the key determinant behind the separation of successful and unsuccessful peptides in the library.20–22
Fig. 1. Overview of the isPCA and isCAN protocols. Shown are desired and numerous undesired states that can form upon combination of the library/target/competitor peptides. Complexes screened within isPCA include library–library, (negative), target–target (competitive) and library–target (desired). Under isCAN, multiple user defined competitor sequences bring about additional library–competitor (negative) and target–competitor (competitive) complexes. Within isCAN, specificity is driven by the desired predicted ΔTm value as specified by the user. Therefore, a library member is only successful if it forms the desired complex with a predicted Tm value greater than the ΔTm set by the user. Further details are discussed elsewhere.20–22.
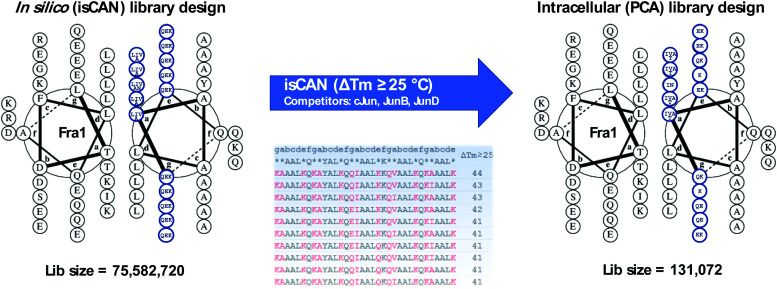
The 75 582 720 member peptide library designed to target Fra1 corresponded to five heptad repeats of a leucine zipper template (gabcdef). The initial isCAN step utilized three Jun family members (cJun, JunB and JunD) as competitors. Peptides to emerge from screening were required to possess a predicted ΔTm ≥ 25 °C. This ΔTm cut-off was chosen since it gave high confidence that the required selectivity for Fra1 over Jun family members could be achieved, while generating a library size that could be realistically represented in PCA. Peptides meeting these criteria were predicted to be capable of outcompeting all other possible complexes; i.e. to overcome potential target–target, library–library, library–competitor and target–competitor complexes (see experimental). To facilitate this, the interfacial g, e, and a positions were semi-randomized and screened in order to create a more refined and reduced-size library for entry into PCA screening, narrowing options presented at each semi-randomized position to the more specific residues predicted to be required for Fra1 binding (Fig. 2).
Fig. 2. Fra1 library design and screening overview. During library design for isCAN screening peptide options were semi-randomized at all 10 e/g positions (Q/E/K) and a positions (L/I/V/A and L/I/V/A/N at a3). The library illustrates the hydrophobic options at the core positions (a/d) and the charged/polar options present at the flanking positions (e/g). In particular, positions g and e were semi-randomized with a view to generating potential attractive and repulsive options with the corresponding positions of the target. Similarly, core a positions were semi-randomized to generate aliphatic hydrophobic options. Positions c and d were fixed as A and L respectively (position b2 as Y for quantification purposes). The final PCA design arising from the isCAN step (using cJun, JunB, and JunD competitors) resulted in a library size of 131 072 members (i.e. >99.8% library size reduction), with 13 randomised positions of 2 or 4 options at each. The PCA library was derived by inspection of sequence variations within all 465 peptides predicted to display the specified ΔTm of ≥25 °C according to the isCAN software. Note that additional a position Thr residues in the PCA library were present owing to unavoidable degenerate codon options. The helical wheel diagrams were generated using DrawCoil 1.0, http://www.grigoryanlab.org/drawcoil.23.
A design principle of the library was to begin with an N-terminal g position and end with a C-terminal e position to maximise the potential for attractive/repulsive electrostatics, with 15 semi-randomized positions of 3–5 options at each position placed into the library sequence at positions corresponding to core a hydrophobic and e/g electrostatic positions within the heptad repeats (Fig. 2). The isCAN peptide library was next narrowed to 485 sequences that met the requirements of the ΔTm cut-off, which when degenerated created a PCA accessible 131 072-member library (Fig. S1 and S2, ESI†). This reduced the original library size by >99.8%, providing one with 13 semi-randomised positions with 2 or 4 options at each (Fig. 2). isCAN selected exclusively K at positions g2 and e2, deeming it to be favourable for target binding while disfavouring binding to all other species. Position a3 was limited to I/N, g1 and e3 to Q/K, g3 and g4 to Q/E, e1, e4 and e5 to K/E, and a1, a2, a4 and a5 to V/I/A/T (in constructing the PCA library, Thr was unavoidably generated by degenerate codons). Accuracy and variety of the constructed library was verified by DNA sequencing as presented in ESI† (Fig. S1).
PCA selection winner
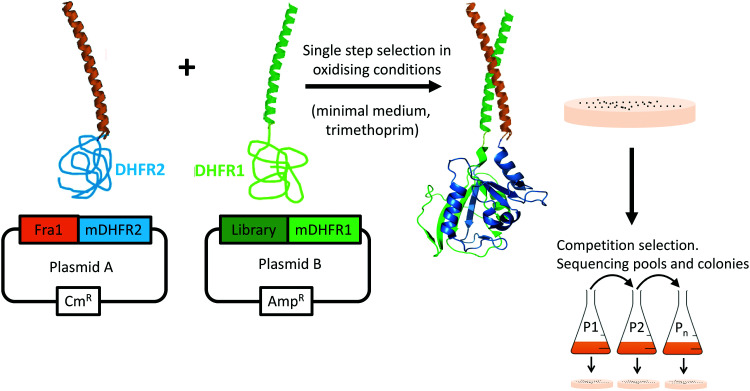
During PCA, one half of murine dihydrofolate reductase (mDHFR) was genetically fused to the Fra1 target, and the second half of mDHFR was fused to the protein library. Only library members binding to the Fra1 target bring the two halves of mDHFR together, rendering the enzyme active, and resulting in bacterial colony formation under selective conditions (Fig. 3). PCA also ensures that library members must overcome target homodimers, and their own homodimerization to be selected. Subsequent growth competitions under selective conditions in liquid media enriched a “winning” peptide, termed Fra1W.
Fig. 3. Protein-fragment complementation assay. Peptide library selection was undertaken in bacteria. During PCA, members that bind to the Fra1 leucine zipper recombine murine dihydrofolate reductase (mDHFR) and generate colonies under selective conditions (bacterial dihydrofolate reductase is specifically inhibited using trimethoprim). Those peptides that bind with the highest affinity to the Fra1 target confer fastest cell growth rates. During competition selection therefore, subsequent passages in liquid medium enrich potential PCA winners with the highest efficacy. Since PCA is performed in the cytoplasm of E. coli, nonspecific, toxic, unstable, aggregation-prone (insoluble), and protease-susceptible members are removed.
Single step PCA selection was undertaken on M9 selective agar media, followed by DNA sequencing and further rounds of competition selection in liquid M9 medium, resulting in one clean DNA sequence in the pool after ten rounds of competition selection passaging (Fig. 3, 4 and Fig. S3, ESI†). The isCAN → PCA selected sequence was named as Fra1W. Helical wheel inspections of Fra1–Fra1W heterodimers and Fra1W homodimers and cJun–Fra1W heterodimers (Fig. 4) illustrate the hydrophobic interface at the core positions (a/d) and the charged residues present at the flanking positions (e/g). Leu residues found at core d positions were preserved to maintain the leucine zipper. Fra1 and Fra1W heterodimer contains five favourable electrostatic interactions between E and K at e and g positions (blue hash). In contrast, the Fra1W homodimer contained six unfavourable electrostatic interactions via K–K alignment, with Fra1–cJun forming four unfavourable electrostatic interactions (K–K and K–R) and only one favourable electrostatic (E–K) interaction. These interactions provide a greater scope for stabilization of the target–antagonist complex over other possibilities. At the core, Fra1 residues are atypical and less favourable for hydrophobic interactions, with the a position consisting of two T and two K residues. Fra1W displays two A residues, two I residues and one V in establishing a heterodimer with Fra1.
Fig. 4. Helical wheel representations of potential interactions with Fra1W. Fra1–Fra1W heterodimeric and Fra1W homodimeric helical wheel diagrams illustrate the hydrophobic interface at the core positions (a/d) and the charged residues present at the flanking positions (e/g). Leu residues found at core d positions were preserved to maintain the leucine zipper. The Fra1–Fra1W interaction contains favourable electrostatic (blue hash) and core interactions to drive coiled coil formation. Fra1W–Fra1W and cJun–Fra1W display unfavourable electrostatic (red hash) interactions disfavouring their formation. Helical wheel diagrams were generated using DrawCoil 1.0, http://www.grigoryanlab.org/drawcoil.23.
Circular dichroism
To demonstrate that the PCA-selected winner engages in interaction with Fra1 in a target-specific fashion, we synthesized Fra1, cJun and Fra1W, analysed by electrospray MS (data shown in supplementary documents) and characterized Fra1 homodimers, Fra1W homodimers, cJun homodimers, and both cJun–Fra1W and Fra1–Fra1W heterodimers. An analysis of the global secondary structure content of homodimeric and heterodimeric systems was conducted at a total peptide concentration of 150 μM to provide equimolar concentrations of each component helix for all dimeric systems. The 222/208 ratio was used to provide evidence on whether the helices were monomeric or adopted a quaternary structure.
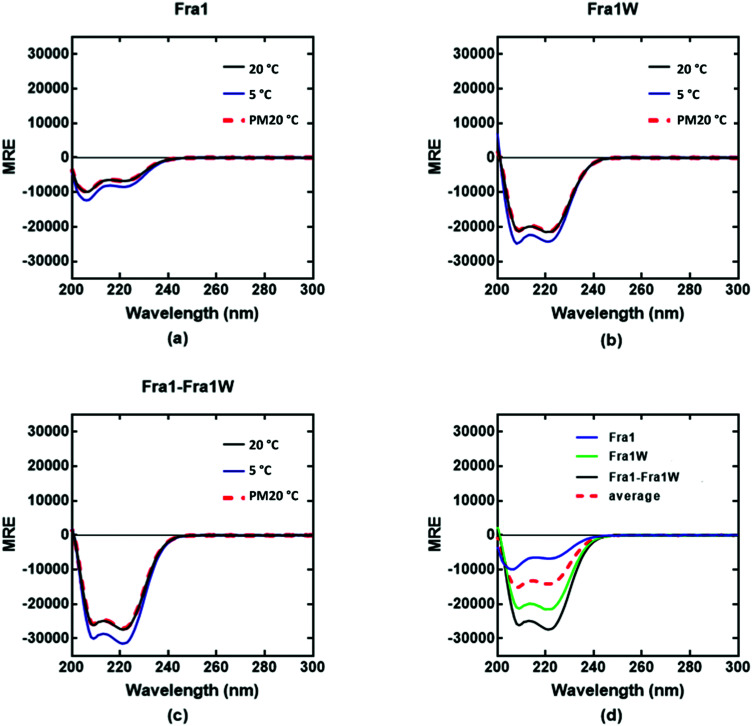
Circular dichroism (CD) spectra confirmed that all samples were broadly α-helical, with cJun and Fra1 samples only weakly populated. In particular, CD spectra showed Fra1 to exist as 21% helical (Fig. 5a) with the 208 nm signal significantly exceeding that of 222 nm, indicating low homodimeric affinity. The secondary structure content of Fra1W in isolation displayed a 60% helical signature (Fig. 5b), with that of the Fra1–Fra1W complex (Fig. 5c) exhibiting a more intense signal with greater α-helical content (75%), more than three times that of the target Fra1 in isolation. In addition, the 222/208 nm ratio was 1.06, providing further evidence for a significant increase in the helical stability of Fra1–Fra1W and evidence toward the formation of a quaternary structure.24 Moreover, it clearly demonstrated an increase from the averaged homomeric signals of Fra1 and Fra1W (Fig. 5d, red dash vs. black) at 20 °C before thermal denaturation.
Fig. 5. CD spectra data indicates a Fra1–Fra1W interaction. Shown are CD spectra for (a) Fra1 (b) Fra1W and (c) the samples mixed at 1 : 1 stoichiometry. Spectra were measured at 20 °C, 5 °C, and again post thermal denaturation at 20 °C (PM20oC: to establish that unfolding is fully reversible) at a total peptide concentration of 150 μM and presented as mean residue ellipticity (MRE). (d) CD spectra are shown at 20 °C for Fra1 and Fra1W in isolation and when mixed, demonstrating a significant gain in measured signal (black) over the average of the two component signals (red hash). All spectra are indicative of helical structures. All experiments were performed in 10 mM potassium phosphate and 100 mM potassium fluoride (pH 7.0).
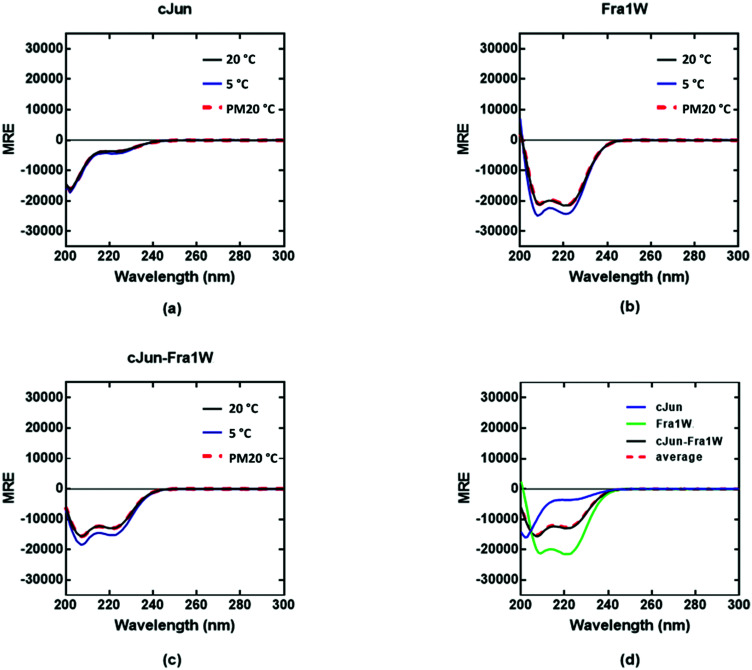
In contrast, the cJun–Fra1W signal superimposed with the averaged homomeric signals (Fig. 6d, red dash vs. black line). Overall this demonstrates that incubation of Fra1 with Fra1W elicits a significant conformational change in the sample and provides compelling evidence for the formation of a coiled coil. Moreover, Fra1W selectively binds to Fra1 without interaction with cJun.
Fig. 6. CD spectra data indicates no cJun–Fra1W interaction. Shown are CD spectra for (a) cJun, (b) Fra1W and (c) cJun–Fra1W. (d) CD spectra are shown at 20 °C for cJun and Fra1W in isolation and when mixed, demonstrating no gain in measured signal (black) over the average of the two component signals (red hash). Spectra were measured at 20 °C, 5 °C, and again post thermal denaturation at 20 °C (PM20oC: to establish that unfolding is fully reversible) at a total peptide concentration of 150 μM and presented as mean residue ellipticity (MRE). All spectra are indicative of helical structures. All experiments were performed in 10 mM potassium phosphate and 100 mM potassium fluoride (pH 7.0).
Thermal denaturation profiles
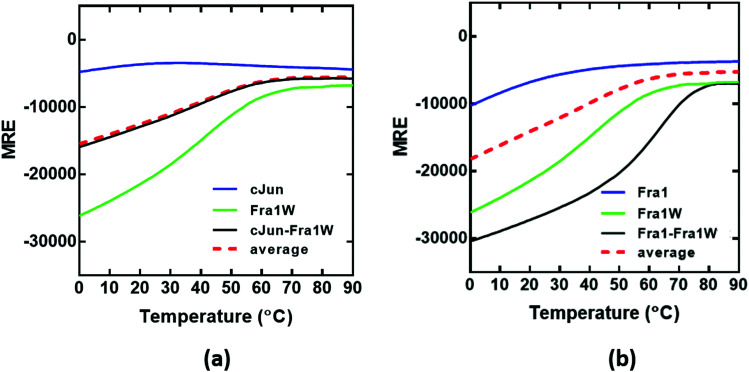
Having observed a significant increase in the global secondary structure content of the Fra1–Fra1W sample, we next sought to quantify the stability of the complex by performing thermal denaturation experiments (Fig. 7). In agreement with the spectra, this pattern of increased stability between undesired and desired complexes was also observed using thermal melts taken in 1 °C increments. Neither Fra1 or cJun in isolation formed a coiled coil complex; rather, only the upper baseline characteristic of the profiles was observed (Fig. 7a and b, blue). This is in agreement with spectral data and is indicative of a weakly populated helix that does not self-associate. However, when Fra1 was incubated with the Fra1W antagonist peptide, the intensity of the helical signal increased significantly and led to a transition midpoint of 64 °C (Fig. 7b, black line) while no interaction occurred between cJun and Fra1W; rather a superimposition of the cJun–Fra1W (Fig. 7a, black line; Tm = 40 °C) with the averaged homomeric cJun and Fra1W (Fig. 7a, red dash line) was observed. The instability of Fra1W (Fig. 7a and b, green line; Tm = 48 °C) in isolation, relative to Fra1–Fra1W is a considerable advantage (Tm = 48 °C vs. 64 °C), removing the possibility of homodimer formation as a potential off-target. As can be observed the peptide preferentially heterodimerises with Fra1.
Fig. 7. CD thermal denaturation profiles demonstrate that Fra1W interacts with Fra1 but not cJun. Shown are thermal stability of peptide pairs measured via temperature dependence of the CD signal at 222 nm. (a) The thermal denaturation profile cJun–Fra1W indicates no difference from the average of the component peptides (black line vs. red hash) indicating no interaction. (b) Fra1–Fra1W shows a substantial increase in the transition midpoint (Tm = 64 °C) relative to component peptides (black vs. red hash). All experiments were performed in 10 mM potassium phosphate and 100 mM potassium fluoride (pH 7.0). All spectra were recorded at 1 °C increments at a total peptide concentration of 150 μM and fitted to a two-state denaturation model.
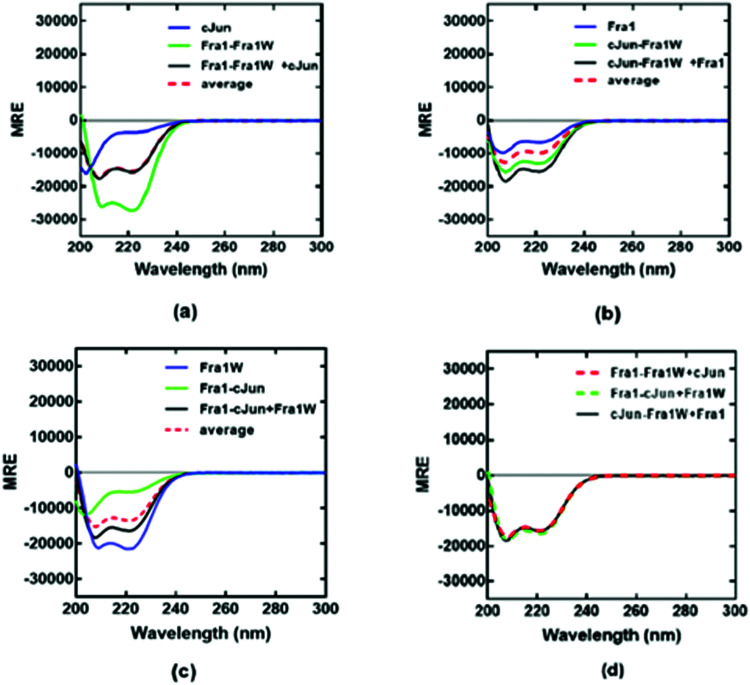
To provide further evidence for the preferential binding of Fra1W to Fra1 over cJun, and that Fra1W was able to interrupt a Fra1–cJun interaction, dimer exchange experiments were performed at equimolar concentrations of each peptide. First cJun was added to a heteromeric sample containing Fra1–Fra1W; in this case the component spectra of Fra1–Fra1W and cJun superimposed with that of the three combined, indicating that no exchange of binding partner had occurred (Fig. 8a; black observed vs. red hash average). However, when Fra1 was added to a heteromeric sample containing cJun–Fra1W, the CD signal increased from the average of the component samples (Fig. 8b; black observed vs. red hash average). Similarly, when Fra1W was added to a solution containing Fra1–cJun an increase in signal was observed, providing further evidence for the ability of Fra1W to compete off cJun from Fra1 (Fig. 8c). Reassuringly, the signals for the three combined peptides from all three experiments were found to superimpose (Fig. 8d), demonstrating that both samples had equilibrated to generate the same helical signature. These experiments provide firm evidence that Fra1W preferentially binds Fra1, interrupts a Fra1–cJun interaction, and that cJun is unable to interrupt the heterodimeric Fra1–Fra1W complex.
Fig. 8. CD dimer exchange experiments demonstrate that Fra1W binds Fra1 but not cJun. (a) Addition of cJun to a solution containing Fra1–Fra1W led to no change in signal. (b) Adding Fra1 to a solution containing cJun–Fra1W led to an increase in helical signature, consistent with dimer exchange. (d) Addition of Fra1W to a solution containing Fra1–cJun led to an increase in helical signature, consistent with dimer exchange. (d) equilibrated signals from mixtures (a)–(c) superimpose as expected. Spectra were measured at 20 °C at a total peptide concentration of 150 μM containing equimolar concentrations of each peptide and presented as mean residue ellipticity (MRE). All experiments were performed in 10 mM potassium phosphate and 100 mM potassium fluoride (pH 7.0). All three plots share the same y-axis.
Size-exclusion chromatography (SEC)
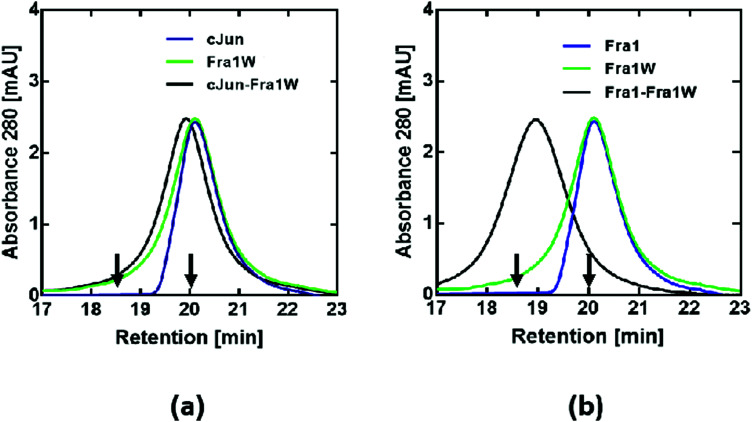
To further confirm that Fra1W preferentially and specifically binds to Fra1 in a dimeric state, size-exclusion chromatography (SEC) was performed. Monomeric profiles for cJun (Fig. 9a, blue line), Fra1 (Fig. 9b, blue line), Fra1W (Fig. 9a and b, green line) and cJun–Fra1W (Fig. 9a, black line) all eluted at approximately 20 min. These were in contrast to the dimeric profile of Fra1–Fra1W (Fig. 9b, black line), which eluted one minute earlier at approximately 19 min. In all cases, the elution profiles were consistent with predicted monomer/dimer patterns according to characterised cFos (monomer – 20 min) and cJun–FosW (dimer – 18.5 min) standards,25 demonstrating that the only observed dimer was the Fra1–Fra1W complex.
Fig. 9. SEC profiles indicate that Fra1W binds Fra1 but does not homodimerize or bind cJun. Shown are size exclusion chromatography profiles for (a) noninteracting and (b) interacting peptides. A peak at approximately 19 min for the Fra1–Fra1W mixture (b – black trace) represents a dimeric sample whilst cJun, Fra1, Fra1W and cJun–Fra1W generate a peak at approximately 20 min, indicating monomeric samples. These experiments, undertaken at a total peptide concentration of 20 μM, provide additional evidence for selectivity of the Fra1–Fra1W interaction. Arrows show previously characterised controls with elution times for a 32mer Fos monomeric peptide (20 min) and a 37mer cJun–FosW heterodimer (18.5 min).25.
Isothermal titration calorimetry (ITC)
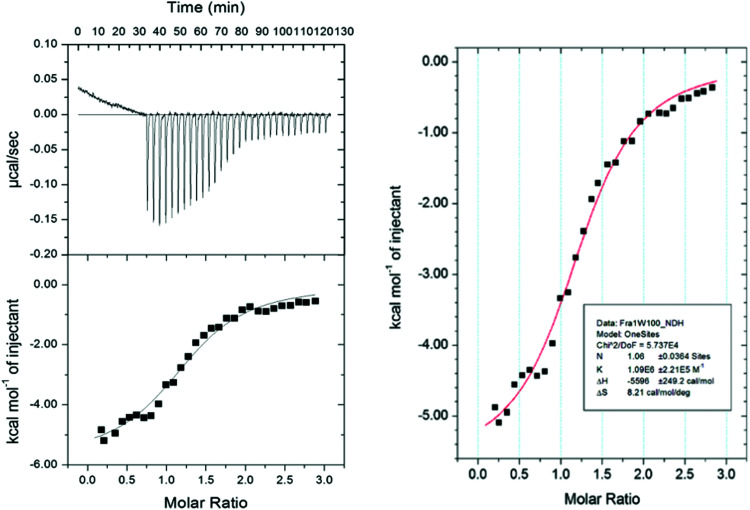
To provide further insight to the origin of the binding affinity (KD) between Fra1 and Fra1W, the relative contributions of enthalpy versus entropy to the affinities were dissected. Isothermal Titration Calorimetry (ITC) experiments were conducted to enable the free energy of binding to be split into entropic and enthalpic components (Fig. 10), while also providing a stoichiometric measure of binding (N = 1.06). The thermodynamic parameters determined from ITC measurements on Fra1–Fra1W further confirmed the interaction; titrating a solution of Fra1W into Fra1 elicited the expected sigmoidal binding curve of a high affinity interaction, with the fit deriving a KD of 917 nM (ΔG = −8.0 kcal mol−1). The free energy of binding was found to be predominantly driven by a favourable enthalpic component (ΔH = −5.6 kcal mol−1) with an additional favourable overall entropic component (TΔS = 2.4 kcal mol−1).
Fig. 10. Isothermal titration calorimetry analysis of the Fra1–Fra1W interaction. On the fitted data plot, the solid line represents the fit to the data based on the binding of a ligand to a macromolecule using the MicroCal (GE Healthcare) Origin software.26 See Materials and methods for further details.
Luciferase gene reporter
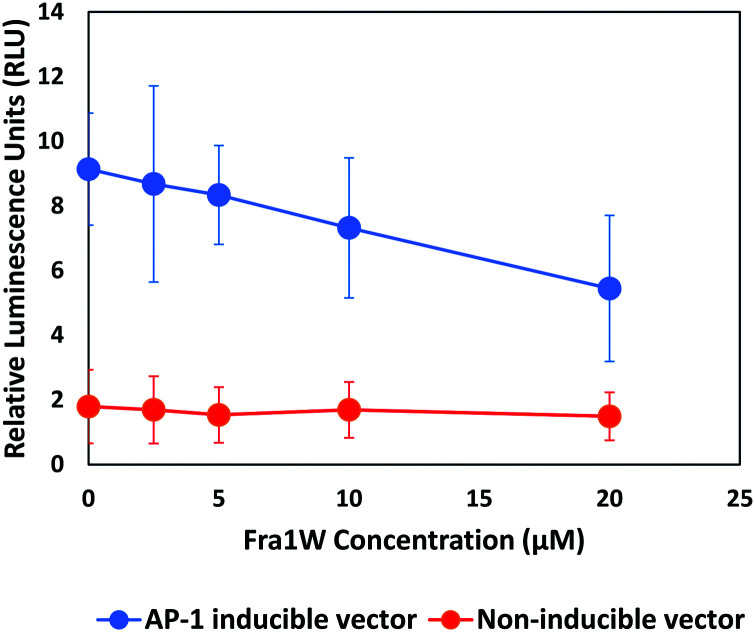
Having establishing target engagement for the Fra1W peptide, its ability to inhibit Fra1 transcriptional activity was assessed using an AP-1 luciferase gene reporter assay. An A549 lung carcinoma cell line expressing a high level of Fra127 was transfected either with a vector expressing a firefly luciferase gene under the control of multimerized AP-1 responsive elements located upstream of a minimal promoter, or with a non-inducible firefly luciferase vector as negative control. We synthesized a cell penetrant version of Fra1W peptide (Fra1W–NLS–Tat) and treated the cells with increasing amounts of the fusion peptide. AP-1 activity was instigated by the addition of 10 nM PMA six hours prior to the addition of the firefly luciferase substrate. Fra1W induced a dose-dependent reduction in luciferase activity (Fig. 11), demonstrating that when fused to a cell penetration domain, Fra1W peptide was able to enter the cell and impact upon AP-1 activity. Additionally, no cytotoxicity was observed in A549 cells after 24 hours treatment across the concentrations of the peptide tested (0 to 20 μM) (Fig. S6, ESI†).
Fig. 11. Fra1 antagonist peptide reduced AP-1 mediated transcriptional activity in A549 cells. Cells were induced with 10 nM PMA and the expression of the luciferase reporter gene from either AP-1 responsive elements (AP-1 inducible vector) or random response elements (non-inducible vector) were measured 24 h after treatment with Fra1W–NLS–Tat. The peptide reduced the transactivation of luciferase gene expression in a dose-dependent manner from the inducible AP-1 response element.
Conclusion
To date, the majority of research into Activator Protein 1 (AP-1) inhibition has focused on cJun and cFos. However, other AP-1 subunits, such as Fra1, are established oncogenic proteins that are implicated in a number of different cancers1–4 that include colon28 squamous cell,29 and lung carcinomas.27 Here we describe a semi-rational library design approach combined with in silico and intracellular paired library screening to demonstrate an effective strategy towards the identification of target-specific bZIP antagonists. In particular, the isCAN library screen20–22 paired with PCA has been used to identify peptides that selectively engage with Fra1, while removing members with a range of non-desired features such as the ability to homodimerize, those unable to outcompete target homodimers, and additionally considering potential library–competitor and target–competitor interactions (i.e. competitors cJun, JunB, JunD). Following the isCAN step, >99.8% of the library was removed, allowing the remaining 131 072 sequences to be accessible to the intracellular PCA, resulting in a highly selective nM affinity antagonist of Fra1. Of note within this process is that Fra1W was ranked 13th out of 485 peptides (top 3%) to emerge from the isCAN screen. Moreover, since residue variations within the 485 peptides degenerated to create a library of 131 072 for the PCA scan, the peptide identified is within the top 0.01% of all predicted sequences to enter the PCA step, giving considerable confidence in the system.
An important part of the screening approach is the inclusion of options that generate both favourable and compromised intermolecular contacts within the desired species. This overlooked prerequisite acts to define PPIs which are stable, while blocking the formation of otherwise energetically accessible alternatives. Formation of the Fra1–Fra1W heterodimer results from five favourable E–K electrostatic interactions between e and g residues. The formation of a Fra1W homodimer is destabilized via six unfavourable electrostatic K–K pairs. These provide greater scope for stabilization of antagonist–target heterodimeric complexes, destabilize antagonist homodimers, and enhance overall interaction specificity.25,30–32 Residues within the Fra1 core are atypical and less favourable for hydrophobic interaction; however, Fra1W displays a hydrophobic core, consisting of I, V, as well as smaller A sidechains, to establish favourable interactions with Fra1. Reassuringly, in combination with the electrostatic component, the permutation of these aliphatic hydrophobics within Fra1W does not disproportionately favour interaction as a homodimer or with cJun. Rather, it is shown that specificity is achieved using a combination of both hydrophobics and electrostatics. Heterodimerisation of Fra1W with cJun/JunB/JunD is prevented via four K/R repulsions. In vitro analysis via a combination of CD, SEC and ITC validates the isCAN → PCA approach and demonstrates that Fra1W is able to specifically interact with Fra1 while avoiding homodimerization or interactions with off-target cJun. Luciferase gene reporter experiments, in which Fra1W is fused to an NLS–Tat cell penetrating peptide, additionally demonstrates that the peptide can enter A549 lung cancer cells, impacting upon AP-1 Fra1 transcriptional activity in a dose dependent manner. Heterodimers of Fra1–Fra1W are established to be dimeric in nature and cannot be disrupted by the addition of cJun. Interaction with other Jun homologues is unlikely since (i) JunB and JunD were explicitly considered during the isCAN step and (ii) all Jun family members share the same a/d core (a major driver in coiled coil stability) with only two e/g residue differences between cJun and Jun B (Fig. S5 – g3 Q-to-E and e3 A-to-S, ESI;† JunD is identical at the interface). We are therefore confident that Fra1W does not interact with any Jun homologue.
Although the ability to select between Fos members, was not an aim of this study, we believe that it is unlikely to present an issue. In particular; (i) individual AP-1 members are known to be driven by unique temporal and tissue-specific patterns, impacting upon different target genes.36 Therefore, a key feature in targeting the correct Fos homologue is not only the ability to impart selectivity, but the ability to deliver the peptide to the particular cell in which the target protein homologue is overexpressed. This has been achieved for example by targeting cancer cells that overexpress specific populations of cell surface receptors that are highly expressed in specific cancers, thereby serving as physiological targets for therapeutic delivery. Indeed, receptor-mediated drug delivery presents an emerging opportunity to enhance therapeutic efficiency by accumulating the drug within the tissue of interest where the target resides, thereby reducing undesired, off-target effects;33 (ii) since Fra1 must heterodimerise with a Jun family member to become active, selectivity for Fra1 in the context of the Jun protein family remains key in blocking Fra1 driven transcriptional activity; (iii) as we have shown previously,17 native heterodimers between Jun/Fos family members are also non-specific according to affinities between the various combinations, again suggesting that unique temporal and tissue-specific expression patterns are the major drivers in determining the precise AP-1 composition; (iv) lastly, the Fos family exists with minimal differences between members, with cFos/FosB/Fra1/Fra2 all sharing an identical a/d core. There are only three minor e/g residue changes from Fra1 (Fig. S5 – e3 Q-to-E for FosB, e4 Q-to-L for cFos, and g5 Q-to-E for cFos/FosB/Fra2, ESI†). Overall, these changes are very modest, and therefore Fra1W is not expected to be capable of discerning between Fos family members.
Future structural biology approaches may be employed to provide further insight into the mechanism of Fra1–Fra1W interaction, while introduction of macrocyclic structures into the Fra1W framework may provide the ability to further strengthen binding activity. Addition of cell penetrating peptide motifs and/or other moieties to facilitate receptor-mediated drug delivery may be required to impart further selectivity in delivering peptide derivatives to their intracellular target. In conclusion, the isCAN → PCA library-based multidisciplinary approach harbours significant potential in the search for potent and selective PPI inhibitors, with the potential to deliver further insight into rational peptide-based drug design towards use in the clinic.
Experimental
A 75 582 720 member peptide library was designed by introducing semi-randomised residue options at positions corresponding to key interfacial positions within each heptad repeat of a coiled-coil motif (gabcdef). The library was next screened using isCAN software based on the bCIPA algorithm, which has been described in detail elsewhere.20–22,25,34 Briefly, the software provides a qualitative rank of affinity by estimating the thermal melting point (Tm) of every potential dimeric interaction within the system. In this library, every g and e position within the coiled coil, which are critical in forming electrostatic contacts within a coiled-coil sequence19 were semi-randomized to generate Q/E/K options, with a view to generating both potential attractive and repulsive options with the corresponding positions of the target (Fig. 2). Similarly, all a positions corresponding to the core region within a coiled-coil sequence (a1, a2, a4, a5) were semi-randomized to generate L/I/V/A options. The a3 position was semi-randomized to additionally generate an Asn option (L/I/V/A/N). All c and d positions were fixed as A and L, respectively, to impart helicity and further core hydrophobicity that is characteristic of the parallel dimeric coiled-coil motif.20 Using the in silico CANDI (isCAN) software, all peptide library members were next computationally screened for predicted affinities in the form of a Tm. During isCAN the stability of every member was considered as (i) a homodimer, (ii) with the Fra1 target, and (iii) as a potential heterodimer with off-target competitors cJun, JunB and JunD, as well as (iv) the stability of any potential target–target complex, or (v) target–competitor complexes. To distinguish between desired (library–target) and non-desired interactions (target–target, target–competitor, library–library, library–competitor interactions), a lowest acceptable predicted ΔTm was defined as 25 °C (Fig. 1). isCAN is split into two sections: the first set of calculations mirroring the PCA (isPCA) and the second introducing the competitor peptides (isCAN). This stepwise calculation ensures that processing time is not wasted on library members that are predicted to preferentially homodimerize or are unable to overcome the target homodimer (and are therefore not “PCA-successful”). A key concept in both is the predicted differences in Tm (ΔTm). It is the key determinant behind the separation of successful and unsuccessful peptides in the library. PCA-successful library members then have their desired state Tm compared with library member-competitor Tm values and the “CANDI-successful” library members are finally exported.20,22 The library subset remaining was next screened in order to reduce residue options >500 fold to create a small yet high quality library that was accessible to intracellular PCA screening (Fig. 3).
PCA and expression vector cloning
PCA has been extensively used to derive PPI antagonists of AP-1.17,35 Briefly, mDHFR was split and one half fused to the Fra1 leucine zipper target and the other half to the library. Only target binding library members bring two halves of mDHFR into the proximity with each other, render it active, and lead to colony formation under M9 selective conditions. Trimethoprim was used to selectively inhibit bacterial DHFR, thereby ensuring that colonies can arise only as the result of an interaction between Fra1 and a peptide library member. The Fra1 gene was synthesized using overlap extension polymerase chain reaction by two pair of primers: Fra1 forward: 5′-ATA ATA GCT AGC CTG ACC GAT TTT CTG CAG GCG GAA ACC GAT AAA CTG GAA GAT GAA AAA AGC GGC CTG CAG CGC G-3′; Fra1 reverse: 5′-ATA ATA CGG CGC GCC TTC CAG GCG TTC TTT CTG TTT CTG CAG TTC TTC AAT CTC GCG CTG CAG GCC GC-3′ and cloned into the pES300d vector system using NheI and AscI restriction sites.
PCA library construction
Primers were designed such that the desired library could be generated using overlap-extension PCR. Degenerate codons were introduced into a non-overlapping region of the primers to generate an approximate annealing temperature of 38 °C. Correct amplification was enabled via an elongated reverse primer and verified by agarose gel electrophoresis. The correct PCR product was then digested using NheI and AscI restriction enzymes for subcloning the library into the pES230d vector (restriction enzyme recognition sites shown). Primer sequences used were Fra1-Lib-forward: 5′-ATA ATT GCT AGC MAR RYA GCG GCA CTG RAR CAG AAG RYC TAT GCG CTG AAG CAG SAR AWC GCG GCC CTG-3′ and Fra1-Lib-reverse: 5′-AAA AAA AGG CGC GCC YTY CAG TGC CGC TRY YTY CTG YTY CAG TGC CGC GRY YTS TTT YTK CAG GGC CGC G-3′.
Single-step selection PCA
Escherichia coli XL-1 cells were used for construction and cloning of libraries as described previously.17 First, pES300d–Fra1 target and pREP4 (for expression of the Lac repressor protein; Qiagen) were co-transformed into BL21–gold cells (Stratagene) and plated onto LB agar with the appropriate antibiotics (kanamycin and chloramphenicol). These cells were next made electrocompetent before transformation with the pES230d–Fra1–PCA-library plasmid. Transformed cells were plated onto three different media. 1/20th of the cells were plated onto LB agar with three antibiotics (kanamycin, ampicillin, and chloramphenicol) as a positive control of transformation efficiency. Another 1/20th of the solution was plated onto M9 minimal agar containing 1 μg mL−1 trimethoprim and the same three antibiotics as a negative control. Finally, the remaining 90% of the transformed cells were plated onto M9 minimal agar in the presence of the three antibiotics, 1 μg mL−1 trimethoprim, and 1 mM isopropyl β-d-thiogalactopyranoside (IPTG) to induce expression of the two dihydrofolate reductase fragment-fused peptides. This single-step selection led to ∼200 colonies from the initial library of 131 072, meaning that 99.8% of all PCA library members were removed at this stage owing to their inability to effectively bind Fra1 or to rescue cell growth.
Competition selection PCA
To increase selection stringency, growth competition experiments were undertaken. Selected colonies were pooled from the plate and grown in M9 minimal media under selective conditions (containing kanamycin, ampicillin, chloramphenicol, trimethoprim, and IPTG), and serially diluted over passages. Using these sequential rounds of competition selection, subtle differences in growth rate can become amplified, increasing the stringency of selection relative to the single-step method. Competition selection therefore allows the most effective one or two sequences to be isolated from the whole population of Fra1 binders initially identified during single-step selection. At each passage, glycerol stocks were prepared, and sequencing results were obtained (Eurofins Genomics Germany GmbH, Germany) for DNA pools and individual colonies. For each passage, 50 μL of liquid culture was added to 50 mL of fresh M9 minimal media, resulting in an A600 of ∼0.01. Cells were incubated at 37 °C until an A600 of ∼0.4 was reached before moving to the next passage. Ten rounds of competition selection were performed before the pool was found to contain one clean sequence; Fra1W: KAAALKQKAYALKQQIAALKKQVAALKQKIAALK.
Peptide synthesis
Rink amide ChemMatrix resin was obtained from PCAS Biomatrix, Inc. (Saint-Jean-sur-Richelieu, QC). Fmoc-l-amino acids and benzotriazol-1-yl-oxytripyrrolidino-phosphonium hexafluorophosphate (PyBOP) were obtained from Merck. All other reagents were of peptide synthesis grade and obtained from Thermo Fisher Scientific (Loughborough, U.K.). Peptides were synthesized on a 0.1 mmol scale on a PCAS ChemMatrix Rink amide resin using a Liberty Blue microwave peptide synthesizer (CEM, Matthews, NC) employing Fmoc solid-phase techniques20 with repeated steps of coupling, deprotection, and washing (4 × 5 mL of dimethylformamide). Coupling was performed using Fmoc amino acid (5 equiv.), PyBOP (4.5 equiv.), and diisopropylethylamine (10 equiv.) in dimethylformamide (5 mL) and subjected to 35 W microwave irradiation at 90 °C for 30 min. Deprotection was performed as follows: piperidine (20%) in dimethylformamide was subjected to 30 W microwave irradiation at 80 °C for 5 min. Following synthesis, peptides were acetylated using acetic anhydride (3 equiv.) and diisopropylethylamine (4.5 equiv.) in dimethylformamide (2.63 mL) for 20 min, followed by cleavage from the resin with concomitant removal of side-chain-protecting groups by treatment with a cleavage mixture (10 mL) consisting of TFA (95%), triisopropylsilane (2.5%), and H2O (2.5%) for 4 h at room temperature. The suspended resin was removed by filtration, and the peptide was precipitated using four rounds of crashing in ice-cold diethyl ether, vortexing, and centrifuging. The pellet was then dissolved in a 1 : 1 MeCN/H2O mixture and freeze-dried. Purification was achieved via reverse-phase high-performance liquid chromatography (RP-HPLC) using a Phenomenex Jupiter Proteo (C18) reverse-phase column (4 μm, 90 Å, 21.2 mm inner diameter × 250 mm length). The following eluents were used: 0.1% TFA in H2O (a) and 0.1% TFA in ACN (b). The peptide was eluted by applying a linear gradient (at 15 mL min−1) of 20 to 50% of 0.1% TFA in ACN (b) over 30 min. The fractions that were collected were examined by electrospray MS, and those found to contain exclusively the desired product were pooled and lyophilized. Analysis of the purified final product by RP-HPLC indicated a purity of >95% (Fig. S4, ESI†).
Circular dichroism
CD was carried out using an Applied Photophysics Chirascan CD apparatus (Leatherhead, UK) using a 200 μL sample in a CD cell with a 1 mm path length. Samples contained 150 μM total peptide (Pt) concentration at equimolar concentration for heterodimeric solutions (i.e., 75 μM per peptide) and suspended in 10 mM potassium phosphate and 100 mM potassium fluoride at pH 7.0 prior to analysis. The CD spectra of samples were scanned between 300 nm and 190 nm in 1 nm steps, averaging 0.5 s at each wavelength. Three scans were averaged at 20 °C, 5 °C and once again at 20 °C after thermal denaturation to assess helical levels and the ability of the coiled-coil structure to refold.
Thermal denaturation experiments
Thermal denaturation experiments were performed at 150 μM of total protein concentration in 10 mM potassium phosphate and 100 mM potassium fluoride, pH 7, using an Applied Photophysics Chirascan CD instrument (Leatherhead, UK). The temperature ramp was set to stepping mode using 1 °C increments and paused for 30 s at each temperature before measuring ellipticity at 222 nm. For all temperature denaturation experiments, data collection was started at 0 °C, and at this temperature, the peptide solutions remained aqueous. Data collection continued to 90 °C. Data points for thermal denaturation profiles represent the averaged signal after 4 s of data collection. Melting profiles were ≥95% reversible with equilibrium denaturation curves fitted to a two-state model, derived via modification of the Gibbs–Helmholtz equation,34 to yield the melting temperature (Tm). Melting profiles for heterodimers are clearly distinct from averages of constituent homodimeric melts, indicating that helices form heterodimeric complexes, with the cooperative nature of the melting profiles suggesting an apparent two-state process. Tm values were determined by least-squares fitting of the denaturation assuming a two-state folding model widely used for coiled coils34 and provided an excellent fit to our data.
Isothermal titration calorimetry (ITC)
ITC measurements were made using a Microcal VP-ITC instrument with data collected and processed using the Origin 7.0 software package. All measurements were carried out at least two times. Briefly, all peptides were studied at 20 °C in 10 mM potassium phosphate and 100 mM potassium fluoride at pH 7.0. 500 μL of Fra1W was loaded into the syringe at 100 μM peptide concentration. 2000 μL of Fra1 was loaded into the cell at 10 μM. The experiment was undertaken by injecting 10 μL × 30 injections of Fra1W into the calorimetric cell. The change in thermal power as a function of each injection was automatically recorded using the Microcal Origin software and the raw data were integrated to yield ITC isotherms of heat release per injection as a function of Fra1W to Fra1 Molar ratio. No precipitation of protein was observed in any of the experiments undertaken. Following ITC measurements, the data were fit to a one-site model:26q(i) = ((nΔHVP)/2)[1 + (L/nP) + (Kd/nP)] − [[1 + (L/nP) + (Kd + nP)]2 − (4L/nP)]1/2where q(i) is the heat release (kcal mol−1) for the ith injection, n is the stoichiometry of heterodimerisation, V is the effective volume of protein sample loaded into the calorimetric cell (1.46 mL), P is the total Fra1 concentration in the calorimetric cell (μM) and L is the total Fra1W concentration in the calorimetric cell at the end of each injection (μM). This model is derived from the binding of a ligand to a macromolecule using the law of mass action (assuming a 1 : 1 stoichiometry) to extract the various thermodynamic parameters,26 namely the apparent equilibrium constant (KD) and the enthalpy change (ΔH) associated with heterodimerisation. The free energy change (ΔGbind) upon ligand binding can be calculated from the relationship:26ΔGbind = −RT ln KDwhere R is the universal molar gas constant (1.9872 cal K−1 mol−1), T is the absolute temperature in Kelvin (293.15 K) and KD is the dissociation constant of binding with units of mol L−1. Finally, the entropic contribution (TΔS) to the free energy of binding was calculated using the derived values of ΔH and ΔGbind.
Size-exclusion chromatography
Size-exclusion experiments were performed at room temperature using a Superdex Peptide 10/300 GL column (GE Healthcare Life Sciences) by injecting 100 μL of a 20 μM (total peptide concentration) sample in 10 mM potassium phosphate and 100 mM potassium fluoride, pH 7.0 and at a flow rate of 0.5 mL min−1. Elution profiles were recorded via absorbance measurements at A280.
Luciferase gene reporter experiments
The AP-1 reporter assay was performed in a A549 lung carcinoma cell line using an AP-1 reporter kit (BPS Bioscience, San Diego, CA, USA). Cells were seeded at a density of 20 000 cells per wells of a white opaque 96-well plate, and transfected with either the reporter vector or the negative control vector using TransIT-LT1 transfection reagent (Mirus Bio, WI, USA). Twenty-four hours post transfection, the culture medium was exchanged with low FBS assay medium and the cells were treated with given concentrations of Fra1W diluted in the assay medium. The AP-1 transcriptional activity was stimulated with 10 nM PMA 18 hours after peptide treatment. Six hours after PMA stimulation, the cells were lysed and the Firefly luciferase activity was measured using the Firefly luciferase reagent (BPS Bioscience, San Diego, CA, USA).
Measurement of cell viability
A549 cells were seeded at a density of 20 000 cells per wells of a black opaque 96-well plate. The cells were treated exactly as described in the Luciferase gene reporter experiment section. Twenty-four hours post peptide treatment, the cell viabilities were measured using CellTiter Blue (Promega Inc.) according to the manufacturer's instruction.
Author contributions
MY conducted experiments, and synthesized, purified and characterized peptides and Fra1. LG conducted the gene reporter experiments. JMM directed the research. All authors participated in experimental design, analysis of the data, and writing the paper.
Conflicts of interest
JAR, LG and BJK are employees of Sapience Therapeutics. JMM is an advisor to Sapience Therapeutics. There are no other conflicting interests to declare.
Supplementary Material
Acknowledgments
This work was supported by Sapience Therapeutics.
Electronic supplementary information (ESI) available. See DOI: 10.1039/d1cb00012h
References
- Young M. R. Colburn N. H. Gene. 2006;379:1–11. doi: 10.1016/j.gene.2006.05.001. [DOI] [PubMed] [Google Scholar]
- Kakumoto K. Sasai K. Sukezane T. Oneyama C. Ishimaru S. Shibutani K. et al. . Proc. Natl. Acad. Sci. U. S. A. 2006;103:5490–5495. doi: 10.1073/pnas.0601222103. [DOI] [PMC free article] [PubMed] [Google Scholar]
- Sayan A. E. Stanford R. Vickery R. Grigorenko E. Diesch J. Kulbicki K. et al. . Oncogene. 2012;31:1493–1503. doi: 10.1038/onc.2011.336. [DOI] [PubMed] [Google Scholar]
- Hong A. Moriceau G. Sun L. Lomeli S. Piva M. Damoiseaux R. et al. . Cancer Discovery. 2018;8:74–93. doi: 10.1158/2159-8290.CD-17-0682. [DOI] [PMC free article] [PubMed] [Google Scholar]
- Dang C. V. Reddy E. P. Shokat K. M. Soucek L. Nat. Rev. Cancer. 2017;17:502–508. doi: 10.1038/nrc.2017.36. [DOI] [PMC free article] [PubMed] [Google Scholar]
- Mason J. M. Future Med. Chem. 2010;2(12):1813–1822. doi: 10.4155/fmc.10.259. [DOI] [PubMed] [Google Scholar]
- Yu Y. B. Adv. Drug Delivery Rev. 2002;54:1113–1129. doi: 10.1016/S0169-409X(02)00058-3. [DOI] [PubMed] [Google Scholar]
- Acharya A. Ge Y. Wu H. DeGrado W. F. Voelz V. A. Gai F. J. Phys. Chem. B. 2019;123:1797. doi: 10.1021/acs.jpcb.8b12220. [DOI] [PMC free article] [PubMed] [Google Scholar]
- Wolfson D. N. Adv. Protein Chem. 2005;70:79–112. doi: 10.1016/S0065-3233(05)70004-8. [DOI] [PubMed] [Google Scholar]
- Mason J. M. Müller K. M. Arndt K. M. Methods Mol. Biol. 2007;352:35–70. doi: 10.1385/1-59745-187-8:35. [DOI] [PubMed] [Google Scholar]
- Muller K. M. Arndt K. M. Alber T. Methods Enzymol. 2000;328:261–282. doi: 10.1016/s0076-6879(00)28402-4. [DOI] [PubMed] [Google Scholar]
- Arndt K. M. Mueller K. M. Plueckthun A. J. Mol. Biol. 2001;312:221–228. doi: 10.1006/jmbi.2001.4915. [DOI] [PubMed] [Google Scholar]
- Pandya M. J. Cerasoli E. Joseph A. Stoneman R. G. Waite E. Woolfson D. N. J. Am. Chem. Soc. 2004;126:17016–17024. doi: 10.1021/ja045568c. [DOI] [PubMed] [Google Scholar]
- Schnarr N. A. Kennan A. J. J. Am. Chem. Soc. 2003;125:667–671. doi: 10.1021/ja027489b. [DOI] [PubMed] [Google Scholar]
- Lupas A. N. Gruber M. Adv. Protein Chem. 2005;70:37–78. doi: 10.1016/S0065-3233(05)70003-6. [DOI] [PubMed] [Google Scholar]
- Mason J. M. Arndt K. M. ChemBioChem. 2004;5:170–176. doi: 10.1002/cbic.200300781. [DOI] [PubMed] [Google Scholar]
- Mason J. M. Schmitz M. A. Müller K. M. Arndt K. M. Proc. Natl. Acad. Sci. U. S. A. 2006;103:8989–8994. doi: 10.1073/pnas.0509880103. [DOI] [PMC free article] [PubMed] [Google Scholar]
- Hagemann U. B. Mason J. M. Müller K. M. Arndt K. M. J. Mol. Biol. 2008;381:73–88. doi: 10.1016/j.jmb.2008.04.030. [DOI] [PubMed] [Google Scholar]
- Mason J. M. Müller K. M. Arndt K. M. Biochemistry. 2007;46:4804–4814. doi: 10.1021/bi602506p. [DOI] [PubMed] [Google Scholar]
- Lathbridge A. Mason J. M. Biochemistry. 2018;57:6108–6118. doi: 10.1021/acs.biochem.8b00782. [DOI] [PubMed] [Google Scholar]
- Lathbridge A. Mason J. M. ACS Chem. Biol. 2019;14:1293–1304. doi: 10.1021/acschembio.9b00265. [DOI] [PubMed] [Google Scholar]
- Lathbridge A. Michalowska A. Mason J. M. Biochemistry. 2020;59(4):530–540. doi: 10.1021/acs.biochem.9b00631. [DOI] [PubMed] [Google Scholar]
- Grigoryan G. Keating K. E. Curr. Opin. Struct. Biol. 2008;18(4):477–483. doi: 10.1016/j.sbi.2008.04.008. [DOI] [PMC free article] [PubMed] [Google Scholar]
- Rao T. Ruiz-Gómez G. Hill T. A. Hoang H. N. Fairlie D. P. Mason J. M. PLoS One. 2013;8:e59415. doi: 10.1371/journal.pone.0059415. [DOI] [PMC free article] [PubMed] [Google Scholar]
- Crooks R. O. Baxter D. Panek A. S. Lubben A. T. Mason J. M. J. Mol. Biol. 2016;428:385–398. doi: 10.1016/j.jmb.2015.11.022. [DOI] [PMC free article] [PubMed] [Google Scholar]
- Wiseman T. Williston S. Brandts J. F. Lin L. N. Anal. Biochem. 1989;179:131–137. doi: 10.1016/0003-2697(89)90213-3. [DOI] [PubMed] [Google Scholar]
- Vallejo A. Perurena N. Guruceaga E. Mazur P. K. Martinez-Canarias S. Zandueta C. et al. . Nat. Commun. 2017;8:14294. doi: 10.1038/ncomms14294. [DOI] [PMC free article] [PubMed] [Google Scholar]
- Iskit S. Schlicker A. Wessels L. Peeper D. S. Oncotarget. 2015;6(41):43146–43161. doi: 10.18632/oncotarget.6454. [DOI] [PMC free article] [PubMed] [Google Scholar]
- Hanson R. L. Brown R. B. Steele M. M. Grandgenett P. M. Grunkemeyer J. A. Hollingsworth M. A. Oncotarget. 2016;7(26):39996–40011. doi: 10.18632/oncotarget.9557. [DOI] [PMC free article] [PubMed] [Google Scholar]
- Fletcher J. M. Bartlett G. J. Boyle A. L. Danon J. J. Rush L. E. Lupas A. N. Woolfson D. N. ACS Chem. Biol. 2017;12:528–538. doi: 10.1021/acschembio.6b00935. [DOI] [PubMed] [Google Scholar]
- Lau S. Y. Taneja A. K. Hodges R. S. J. Biol. Chem. 1984;259:13253–13261. doi: 10.1016/S0021-9258(18)90686-1. [DOI] [PubMed] [Google Scholar]
- Zhou N. E. Kay C. M. Hodges R. S. J. Biol. Chem. 1992;267:2664–2670. doi: 10.1016/S0021-9258(18)45932-7. [DOI] [PubMed] [Google Scholar]
- Large D. E. Soucy J. R. Hebert J. Auguste D. T. Adv. Ther. 2019;2:1800091. doi: 10.1002/adtp.201800091. [DOI] [PMC free article] [PubMed] [Google Scholar]
- Mason J. M. Hagemann U. B. Arndt K. M. J. Biol. Chem. 2007;282:23015–23024. doi: 10.1074/jbc.M701828200. [DOI] [PubMed] [Google Scholar]
- Crooks R. O. Rao T. Mason J. M. J. Biol. Chem. 2011;286(34):29470–29479. doi: 10.1074/jbc.M111.221267. [DOI] [PMC free article] [PubMed] [Google Scholar]
- Brennan A. Leech J. T. Kad N. M. Mason J. M. J. Exp. Clin. Cancer Res. 2020;39:184. doi: 10.1186/s13046-020-01686-9. [DOI] [PMC free article] [PubMed] [Google Scholar]
Associated Data
This section collects any data citations, data availability statements, or supplementary materials included in this article.


