. 2021 Jul 22;10:e68955. doi: 10.7554/eLife.68955

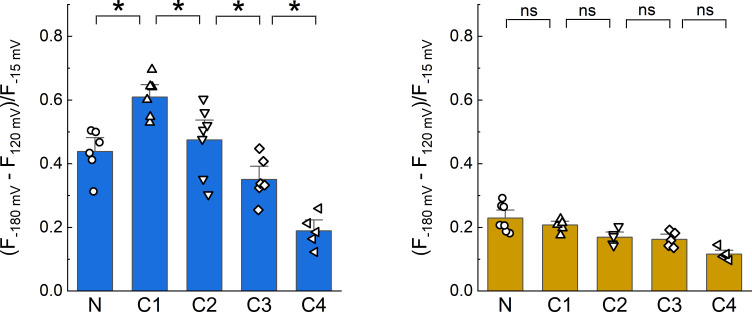
Figure 2. Dipicrylamine (DPA) quenching of CFP or YFP insertions in cASIC1 intracellular domains.

(A) Schematic of cASIC1 constructs used. The extracellular domain (ECD) and transmembrane helices (TM) are gray with amino and carboxy termini depicted in white. Letters within the carboxy tail indicate the amino acid sequence around the insertion site while the lower numbers give the position. (B) Example fluorescence traces for each of the CFP or YFP insertions. Voltage protocol and coloring is the same as in Figure 1B. (C and D) Quenching curves and summary plots for CFP (left) and YFP (right) insertions. Symbols denote individual cells (N = 5–7 cells) and error bars represent SEM. Asterisks mark significant differences with p values of 0.004 (N–C1), 0.0475 (C1–C2), 0.0483 (C2–C3), and 0.0163 (C3–C4) for CFP.

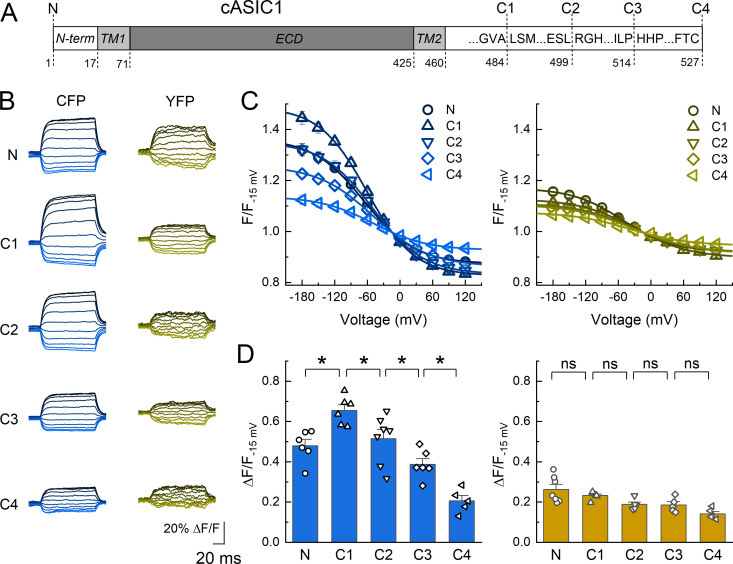
Figure 2.

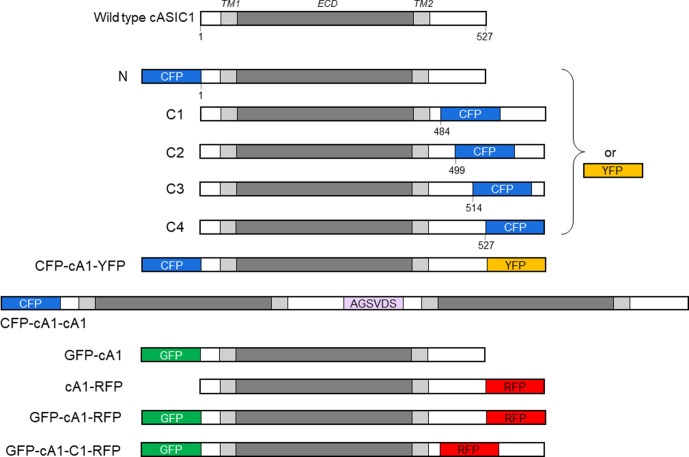
Figure 2—figure supplement 1. cASIC1 constructs used in this study.

Figure 2—figure supplement 1.

The extracellular domain (ECD) and transmembrane helices (TM) are gray with amino and carboxy termini depicted in white. Numbers indicate the amino acid position for insertion. The violet bar shows the amino acid linker between the first and second subunit in the cASIC1 dimer. CFP, YFP, GFP, and RFP represent mTurq2, mVenus, Gamillus, and tagRFP, respectively. Sizes of fluorescent protein (FP) insertions are not drawn to scale. See Materials and methods for further details.
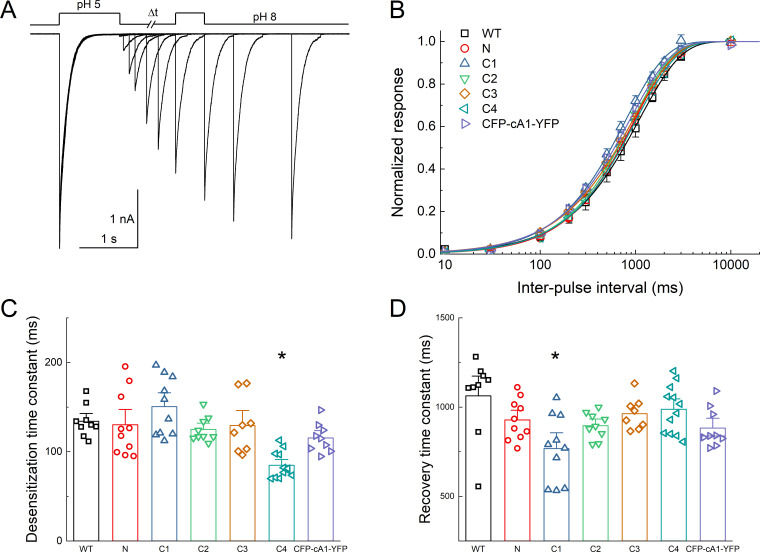
Figure 2—figure supplement 2. Fluorescent protein (FP) insertion does not substantially alter desensitization kinetics.

Figure 2—figure supplement 2.

(A) Outside-out patch recording of cASIC1 CFP at C3 during paired pulse stimulation protocol using pH 8 and pH 5. (B) Recovery from desensitization curves over various interpulse intervals for the indicated constructs. The recovery slope, m, ranged from 0.94 ± 0.08 to 1.06 ± 0.02 (mean ± SEM). (C and D) Summary of desensitization entry (C) and recovery (D) time constants for the indicated constructs. Symbols denote individual excised patches (N = 9–12 patches per construct). Asterisks indicate significant difference compared to wild type using randomization test. For C4 desensitization, p = 0.00012. For C1 recovery, p = 0.046. Error bars represent SEM in all panels.
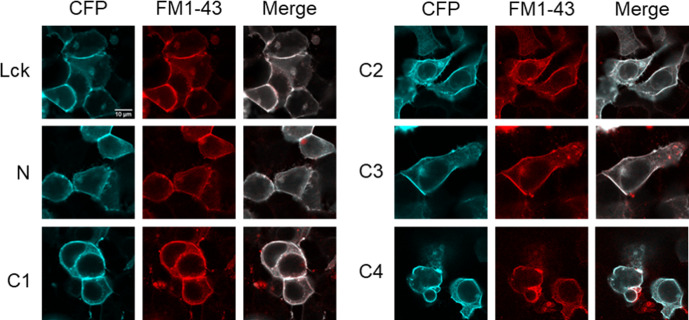
Figure 2—figure supplement 3. Lck-CFP and CFP-tagged cASIC1 constructs localize to the plasma membrane.

Figure 2—figure supplement 3.

Confocal images of HEK293T cells transfected with the indicated constructs 2 days prior. Plasma membrane was stained with FM1–43 (5 µM) immediately prior to imaging.
Figure 2—figure supplement 4. Dipicrylamine (DPA) quenching of CFP or YFP insertions in cASIC1 intracellular domains without Boltzmann fits.

Figure 2—figure supplement 4.

Summary plots of DPA quenching for CFP (left) and YFP (right) insertions analyzed by subtraction of fluorescence values at +120 mV from −180 mV without fitting to a model. Symbols denote individual cells (N = 5–7 cells) and error bars represent SEM. Asterisks mark significant differences with p-values of 0.005 (N–C1), 0.0373 (C1–C2), 0.0396 (C2–C3), and 0.013 (C3–C4) for CFP.
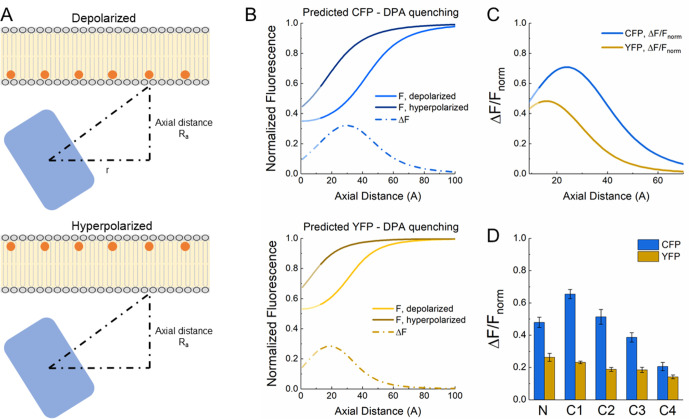
Figure 2—figure supplement 5. Theoretical analysis of fluorescent protein-dipicrylamine (FP-DPA) quenching.

Figure 2—figure supplement 5.

(A) Schematic of DPA quenching of a fluorophore positioned away from the plasma membrane. (B) Predicted quenching curves for CFP (upper) and YFP (lower) at depolarized (light color) or hyperpolarized (darker color) voltages. Dotted line depicts the difference between hyperpolarized and depolarized curves or ΔF as a function of axial distance. (C) ΔF versus distance curves normalized to fluorescence at hyperpolarized voltage or ΔF/Fnorm as a function of distance. (D) Plot of observed quenching (i.e. ΔF/Fnorm) for each FP insertion. Same data as in Figure 2D. Note similarity with predicted ΔF/Fnorm curves in panel C.
Figure 2—figure supplement 6. Distance in extracellular domain for reference.

Figure 2—figure supplement 6.

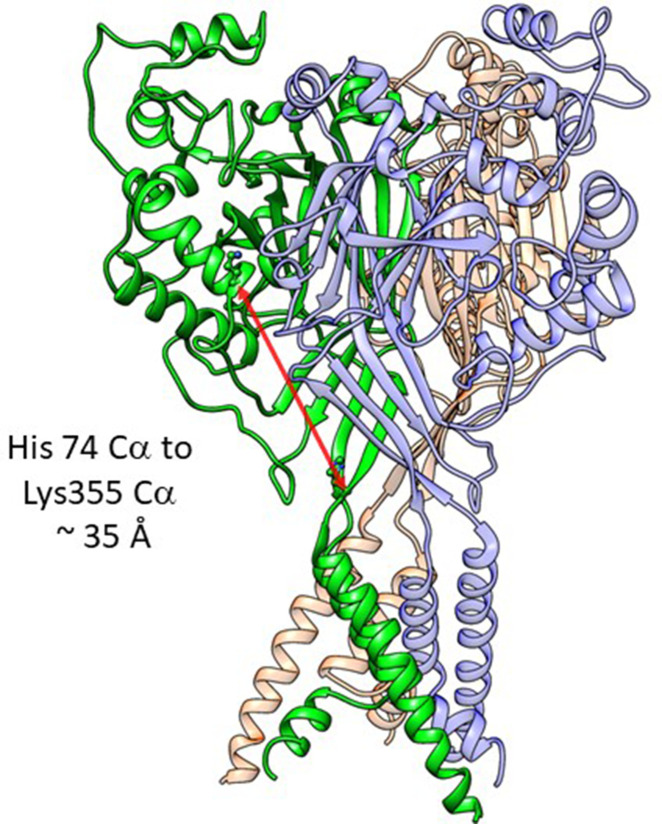
Structure of cASIC1 in the resting stats (PDB: 6VTL) with individual subunits colored green, red, and blue. The distance between the critical His74 and the Lys355 at the base of the thumb domain is shown in a red arrow and is approximately 35 Å.