Abstract
Genetic screens are a powerful approach to identify previously uncharacterized genes involved in specific biological processes. Several technologies have been developed for high-throughput screens using reagents such as RNAi or CRISPR, and each approach is associated with specific advantages and disadvantages. Variable Dose Analysis (VDA), is an RNAi-based method developed in Drosophila cells that improves signal-to-noise ratio compared to previous methods. VDA assays are performed by co-transfecting cells with a plasmid expressing shRNA, (a type of RNAi that can be easily expressed from a DNA plasmid) against a gene of interest and a second plasmid expressing a fluorescent reporter protein. Fluorescent protein expression, can be used as an indirect readout of shRNA expression and therefore target gene knockdown efficiency. Using this approach, we can measure phenotypes over a range of knockdown efficiencies in a single sample. When applied to genetic interaction screens, VDA results in improved consistency between screens and reliable detection of known interactions. Furthermore, because phenotypes are analyzed over a range of target gene knockdown efficiencies, VDA allows the detection of phenotypes and genetic interactions involving essential genes at sub-lethal knockdown efficiency. This therefore represents a powerful approach to high-throughput screening applicable to a wide range of biological questions.
Keywords: RNAi, High-throughput screening, Drosophila, Viability assay, Genetic interactions, Flow cytometry, Synthetic lethality, dsRNA, S2R+ cells , in vitro
Background
High throughput screens (HTS) are experiments in which the functions of many individual genes are systematically disrupted one at a time and the resulting phenotypes measured. Screens are generally performed by treating cells in culture with genetic or pharmacological reagents targeting individual gene functions and measuring the effects of these treatments on a phenotype of interest ( Mohr et al., 2014 ). Using this approach, it is possible to identify genes and pathways that function in a specific biological process. Alternatively, screens can be performed in healthy and disease model cell lines and results compared to study the mechanism of the disease or identify candidate therapeutic targets (Zhan and Boutros, 2016).
In addition to ‘single gene’ screens, it is possible to perform genetic interaction screens, in which pairs of genes are targeted, and assess how phenotypes vary compared to what is expected based on disruption of either gene alone. This approach can be used to map genetic interactions and gain insights into the structure and function of biological pathways and networks ( Tong et al., 2004 ; Fischer et al., 2015 ).
In Drosophila cells, genetic screens are often performed using long double stranded RNA (dsRNA) reagents. Simply by bathing cells in culture media containing dsRNA, the reagent is efficiently taken up and processed to inhibit the function of the target gene. Given the simplicity of this system, it is possible to perform screens on a genome scale with relative ease. However, there are a number of limitations associated with this approach. For example, background noise as well as incomplete or variable disruption of the target gene may result in a failure to detect all but the strongest phenotypes (Boutros and Ahringer, 2008). Moreover, false positives can occur when off-target effects lead to disruption of unintended genes ( Ma et al., 2006 ). Such limitations are even more problematic in genetic interaction screens when two genes must be efficiently and specifically inhibited at once.
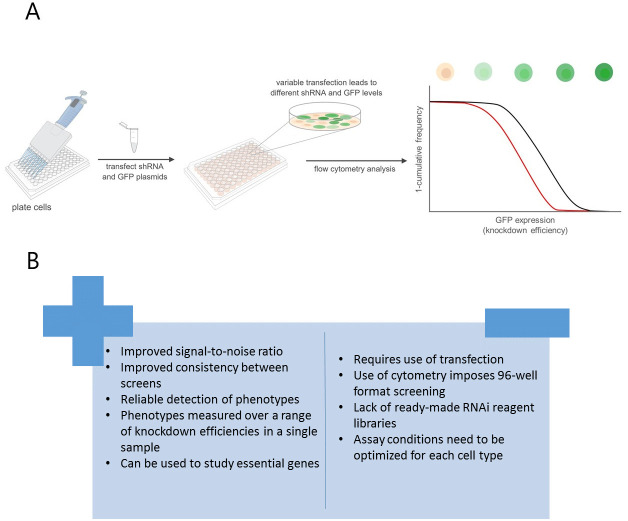
Variable dose analysis (VDA) is a novel approach to RNAi assays in which each cell within a population receives a different dose of short hairpin RNA (shRNA) ( Housden et al., 2017 ). Using a fluorescent reporter, the relative knockdown efficiency in each cell can be measured, and the relationship between the efficiency of target-gene disruption and a feature of interest analyzed in order to detect phenotypes (Figure 1A). This differs from previous methods, which typically measure the average phenotype over a population of cells and results in approximately a 2.5-fold increase in signal-to-noise ratio compared to standard dsRNA methods. In addition, VDA facilitates the study of essential genes because phenotypes can be measured at sub-lethal knockdown efficiency.
Figure 1. VDA provides improvement over dsRNA-based methods.
A. Schematic depicting the VDA HTS pipeline. Control shRNA in black, lethal shRNA in red. B. Advantages and disadvantages of VDA compared to dsRNA screens.
While VDA represents an improved approach to HTS in many ways, there are a number of disadvantages to this method and continued development will be necessary to remove these limitations (Figure 1B). For example, VDA requires the use of transfection, which increases reagent costs and reduces throughput compared to dsRNA-based methods. In addition, there are currently relatively few reagent libraries compatible with VDA although additional libraries are under construction. Finally, VDA may not be applicable to all cell types due to the need for efficient and variable transfection efficiency. Thus, cell types that are not easily transfected cannot be studied using this method. Nevertheless, although VDA has so far only been applied in Drosophila cells, it can in principle be applied to a wide variety of phenotypic readouts and cell types, making it an attractive alternative tool for HTS.
Materials and Reagents
Pipette tips (Gilson, catalog numbers: F167101, F167103) (storage conditions: RT)
NuncTM Cell Culture Treated flasks with filter caps (Thermo Scientific, catalog number: 136196) (storage conditions: RT)
96-well tissue culture plate (JET Biofil, catalog number: TCP011096) (storage conditions: RT)
96-well PCR plate (BRAND, catalog number: 781375) (storage conditions: RT)
Parafilm M (Bemis, catalog number: HS234526A) (storage conditions: RT)
paper towel (any brand)
Drosophila S2R+ cells (DGRC, catalog number: 150) (storage conditions: 25 °C)
FuGENE® HD transfection reagent (Promega, catalog number: E2311) (storage conditions: 4 °C)
Schneider’s Drosophila Medium (Gibco, catalog number: 21720024) (storage conditions: 4 °C)
One ShotTM Fetal Bovine Serum (Gibco, catalog number: A3382001) (storage conditions: -20 °C)
Penicillin-Streptomycin (Gibco, catalog number: 15070063) (storage conditions: -20 °C)
^pActin-GFP (storage conditions: -20 °C)
^pActin-Gal4 (storage conditions: -20 °C)
*shRNA library (storage conditions: -20 °C)
Phosphate Buffered Saline (PBS) (Gibco, catalog number: 20012019) (storage conditions: RT)
Culture media (see Recipes)
Notes:
^Available from the Housden lab.
*Available from the DRSC (fgr.hms.harvard.edu) or Housden lab.
RT: Room temperature.
Equipment
Flow cytometer (Beckman Coulter, model: CytoFlex S)
25 °C incubator (any supplier)
Tissue culture hood (any supplier)
Multichannel pipettes (Gilson, model: PIPETMAN®)
Humidifying chamber (N/A)
Software
Matlab (MathWorks)
Excel (Microsoft)
Procedure
Note: This protocol is optimized for Drosophila S2R+ cells. However, we expect it to be transferrable to any cell type that can be efficiently transfected. All steps involving manipulation of cultured cells should be performed using sterile technique in a suitable tissue culture hood.
-
Preparation of cells for transfection (or ‘Plating Cells’)
Culture cells using standard methods in culture media so that they are approximately 80% confluent on the day of transfection.
On the day of transfection, plate 1.5 x 10⁴ cells in 100 µl culture media per well of a 96-well plate.
Place plated cells in a 25 °C incubator for 20 min to 1 h to allow for adhesion prior to addition of transfection mixture (see Step B3).
Note: The seeding density of cells should be optimized for each cell type and growth condition.
-
Transfection protocol using FuGENE® HD transfection reagent
Notes:
The following transfection protocol will result in ten-fold more transfection mixture than is necessary. This is to prevent the need to pipette very small volumes.
While we typically use FuGENE® HD reagent, we expect this method to work with any similar reagent.
-
Defrost shRNA library plates with each shRNA at 45 ng/µl in water.
Note: Library plates should contain positive and negative control reagents, with at least 5 wells of each to allow assessment of noise in the resulting screen data.
-
In a 96-well PCR plate, mix 90 ng shRNA plasmid, 20 ng actin-GFP, 90 ng actin-GAL4.
Note: Although in theory the three plasmids should be delivered together, a higher ratio of shRNA to GFP is needed to minimize the chance that cells would be transfected with GFP but without corresponding delivery of shRNA. In cases where only shRNA is delivered, the cells will be GFP negative and will therefore not be analyzed during cytometry.
Add the appropriate amount of filter-sterilized PBS to bring total volume to 10 µl.
-
Add 0.6 µl of FuGENE® HD transfection reagent to each well and mix gently by pipetting.
Note: Add FuGENE® HD transfection reagent directly to the DNA mixture. Do not allow undiluted reagent to contact the sides of the tube. Avoid introducing bubbles when mixing.
Incubate for 20 min at room temperature in a sterile tissue culture hood.
-
Transfer 1 µl of transfection mixture from each well of the PCR plate to the cell culture plate, careful to not introduce any air bubbles.
Note: Avoid edge effects by leaving the edge wells untransfected.
-
Seal the 96-well plate with Parafilm and incubate cells at 25 °C for 5 days in a humidifying chamber.
Note: A simple humidifying chamber can be constructed from a plastic bin or Tupperware containing a moist paper towel. Check periodically to make sure the paper towel remains moist and add more water if necessary.
-
Collect data using flow cytometry
Initialize and configure the flow cytometer according to the manufacturer’s instructions.
Adjust acquisition settings to record 20,000 events per sample (“All Events”). Adjust gain or laser power settings if necessary to ensure all events are within the detectable range. Make sure that the same settings are applied to every well in the plate.
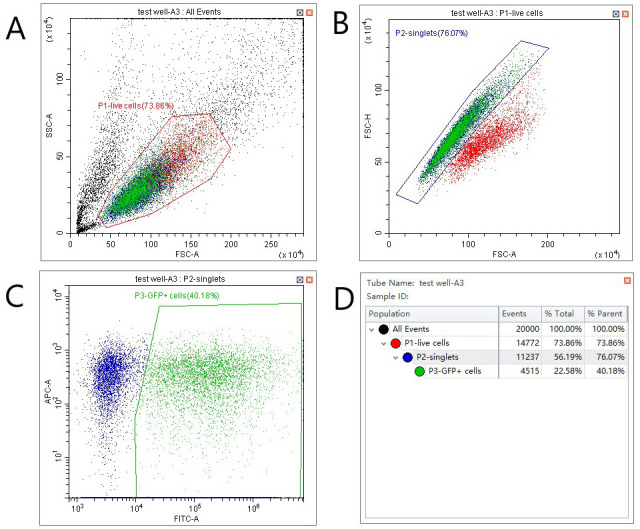
Load the plate and acquire data, following the gating strategy shown in Figure 2. Note that the specific methods to load the plate, set up gates and acquire data will vary depending on the cytometer used. Follow manufacturer’s instructions to ensure appropriate set-up. A helpful explanation of the basics of flow cytometry as well as methods used to analyze and interpret data can be found in Jaroszeski and Radcliff (1999).
-
Export .fcs files for all GFP-expressing cells (Gate P3) for further analysis.
Note: VDA does not require a very high transfection efficiency. However, low efficiency (< 20%) can indicate unhealthy cells, which may affect results.
Figure 2. Gating strategy for VDA assays.

A. Select live cells by plotting forward vs. side scatter and setting a gate as shown. B. Distinguish single cells from doublets by plotting forward scatter–area against forward scatter–height. C. Identify GFP positive cells by plotting GFP fluorescence (FITC filter in this case) against an unused and spectrally distinct filter (APC in this case). D. Statistics view to assess transfection efficiency (P3, % parent).
Data analysis
Data analysis requires a customized approach depending on the specific cytometer used because .fcs file formats vary between machines. Some cytometers can export data directly in text or excel format whereas others require third-party software to extract data. A Matlab script that works with most cytometers can be obtained here: uk.mathworks.com/matlabcentral/fileexchange/9608-fca_readfcs.
Load the .fcs data as described above.
Extract well locations, forward scatter (FSC) data as a proxy for cell size and GFP expression data from the appropriate filter channels.
Divide each GFP value by the corresponding FSC value to normalize for cell size variation.
Generate 500 bins based on the minimum and maximum GFP values and enter data into the bins to obtain a distribution of cells over GFP intensity.
Normalize the area under each distribution curve to 1 by dividing all values by the sum of values for each sample. This removes effects of variable cell number between samples.
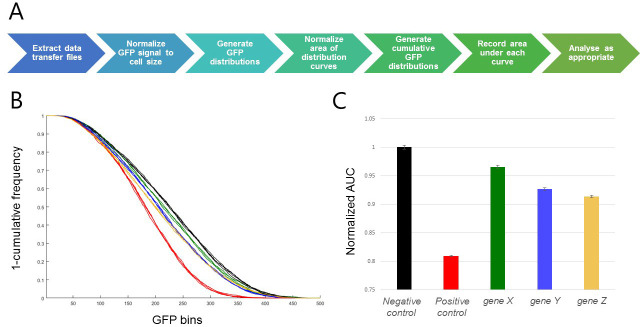
Generate an inverted cumulative GFP distribution plot (see Figure 3). Note that inversion of the cumulative distribution is primarily for visualization purposes and is not a necessary step. Record the area under the curve for each well.
Figure 3. Representative results.
A. Visualization of the data analysis workflow. B. Inverted cumulative GFP distribution plot [Gene X (green), Gene Y (blue), Gene Z (gold), negative control (black; shRNA targeting the white gene, a well-characterized gene known to have no viability effect in these cells) and positive control (red; shRNA targeting the thread gene, an apoptosis inhibitor which robustly induces cell death when inhibited)]. C. Bar graph of area under curve. Error bars represent SEM for 3 replicate wells of each target gene, and 4 replicate wells of each control in a single 96-well plate. In this case, areas have been normalized to the negative control sample.
Note: Statistical tests specific to the biological question under investigation can be used to determine RNAi reagents that cause phenotypes significantly different from the positive and negative controls.
Notes
We recommend setting up at least 3 biological replicates of each VDA assay plate.
As can be seen in Figure 3, VDA should produce very distinct curves. The curves for control reagents (or reagents used in multiple replicates) should be very tight, almost right on top of each other. Variability might be due to low transfection efficiency or cell conditions (i.e., cell density or health).
Recipes
-
Culture media
500 ml of Schneider’s media
50 ml of fetal bovine serum (FBS)
5 ml of penicillin/streptomycin
Filter sterilized
Acknowledgments
This work was supported by the Department of Defense Grant W81XWH16-1-0127. We acknowledge help and support from Norbert Perrimon, Stephanie Mohr, members of the Perrimon lab and the Drosophila RNAi Screening Center in developing the VDA protocols presented here. This protocol is optimized from previously published methods ( Housden et al., 2017 ).
Competing interests
The authors have nothing to disclose.
Citation
Readers should cite both the Bio-protocol article and the original research article where this protocol was used.
References
- 1. Boutros M. and Ahringer J.(2008). The art and design of genetic screens: RNA interference. Nat Rev Genet 9(7): 554-566. [DOI] [PubMed] [Google Scholar]
- 2. Fischer B., Sandmann T., Horn T., Billmann M., Chaudhary V., Huber W. and Boutros M.(2015). A map of directional genetic interactions in a metazoan cell. Elife 4: e05464. [DOI] [PMC free article] [PubMed] [Google Scholar]
- 3. Housden B. E., Li Z., Kelley C., Wang Y., Hu Y., Valvezan A. J., Manning B. D. and Perrimon N.(2017). Improved detection of synthetic lethal interactions in Drosophila cells using variable dose analysis(VDA) . Proc Natl Acad Sci U S A 114(50): E10755-E10762. [DOI] [PMC free article] [PubMed] [Google Scholar]
- 4. Jaroszeski M.J. and Radcliff G.(1999). Fundamentals of flow cytometry. Mol Biotechnol 11(1): 37-53. [DOI] [PubMed] [Google Scholar]
- 5. Ma Y., Creanga A., Lum L. and Beachy P. A.(2006). Prevalence of off-target effects in Drosophila RNA interference screens . Nature 443(7109): 359-363. [DOI] [PubMed] [Google Scholar]
- 6. Mohr S. E., Smith J. A., Shamu C. E., Neumuller R. A. and Perrimon N.(2014). RNAi screening comes of age: improved techniques and complementary approaches. Nat Rev Mol Cell Biol 15(9): 591-600. [DOI] [PMC free article] [PubMed] [Google Scholar]
- 7. Tong A. H., Lesage G., Bader G. D., Ding H., Xu H., Xin X., Young J., Berriz G. F., Brost R. L., Chang M., Chen Y., Cheng X., Chua G., Friesen H., Goldberg D. S., Haynes J., Humphries C., He G., Hussein S., Ke L., Krogan N., Li Z., Levinson J. N., Lu H., Menard P., Munyana C., Parsons A. B., Ryan O., Tonikian R., Roberts T., Sdicu A. M., Shapiro J., Sheikh B., Suter B., Wong S. L., Zhang L. V., Zhu H., Burd C. G., Munro S., Sander C., Rine J., Greenblatt J., Peter M., Bretscher A., Bell G., Roth F. P., Brown G. W., Andrews B., Bussey H. and Boone C.(2004). Global mapping of the yeast genetic interaction network. Science 303(5659): 808-813. [DOI] [PubMed] [Google Scholar]
- 8. Zhan T. and Boutros M.(2016). Towards a compendium of essential genes- From model organisms to synthetic lethality in cancer cells. Crit Rev Biochem Mol Biol 51(2): 74-85. [DOI] [PMC free article] [PubMed] [Google Scholar]


