Abstract
In this paper, we introduce a nanocomposite as a humidity-sensitive sound absorber. The nanocomposites were prepared using hydrogel polymer (HP) as a matrix and graphene oxide (GO) as a filler. Results show that the surface energy of the nanocomposite is 58.4 mJ m−2, and GO sheets increase the nanocomposite porosity from 2.6716 cm2 g−1 (for HP) up to 3.246 cm2 g−1. In addition, the diameter of nanocomposite pores is 8.5202 nm lower than that of HP (10.274 nm). To study the effect of humidity on the sound absorption, we exposed them to moisture for 30 and 60 min and then measured sound absorption. Results show an absorption peak for the HP at 1022 Hz with an attenuation value of 30%, while the nanocomposite shows two main peaks around 1898 and 3300 Hz. In addition, results show that sound absorption peaks shift to higher frequencies according to humidification time.
Subject terms: Applied physics, Nanoscale materials
Introduction
Sound absorbers have attracted remarkable attention in recent years due to their promising application in industry and life1–3. Sound-based devices can be divided into two categories with amorphous and crystal structures4,5. Phonon crystals have been widely studied to fabricate sound-based devices6. For instance, Xue-Feng et al. designed and simulated acoustic crystals to transfer the sound in one direction. Such a system is made from square steel blocks and can control the frequency of transmitted sound by mechanical rotation of the blocks7. In addition, by creating defects in a two-dimensional cylindrical grid immersed in water, one can conduct the sound waves and control their frequency8. In addition, topological acoustic insulators are interesting due to their applications as sound absorbers9,10.
Among various sound absorber materials, nanocomposites are promising for sound-based devices11. Typically, porous materials are applied as a sound absorber, and many studies have been performed to understand the absorption mechanism of these materials12. The propagation of sound is affected by environmental conditions, and sound absorption is dependent on ambient humidity and temperature13,14.
The low-cost and biocompatibility of hydrogel polymers introduce them as a promising candidate for sound absorbing in the transportation and construction industries15. Hydrogels are hydrophilic polymer with cross-linking and swollen ability, which retains large amounts of water. The moisture absorption of hydrogels by hydrophilic functional groups and their dissolution resistance are desirable to fabricate efficient sound absorbers16. The swelling behavior has a significant effect on the physical and mechanical properties of the final hydrogel, and environmental humidity and temperature affect the hydrogel-based sound absorber. Adding GO to the HP can improve its mechanical, thermal, hydrophilicity, and swelling properties. In addition, the properties of HP can be improved by varying concentrations of cross-linking agents in nano-composites11,12. Surrounding the reinforcing phase by hydrogel can improve sound absorption and increase the dissipation coefficient6,11. The size of the pores in a sound absorber determines the frequency of sound absorption17–19. Controlling the sound in resonant cavities, acoustic diodes, thermoelectric is the subject of recent researches20,21, and sound waves can be controlled by phonon crystals20. To achieve an impedance-tunable sound absorber, one should make it sensitive to the external actuator. Synthesizing low-cost and efficient tunable sound absorbers is a challenge in acoustic science22,23. As reported, reinforcing phases such as GO can be used as a reinforcing phase of composite to fabricate an efficient electromagnetic and sound wave absorber11,24,25.
In this paper, we used HP as a base polymer to fabricate humidity-sensitive sound absorber coating. GO was used to modify its surface energy and sound absorption, and the sound absorption of the prepared samples was measured after exposure to moisture at different times. In addition, the sound absorption peak of HP shifts from 1022 Hz to 2000 and 3538 Hz after humidification, showing hydrogen bond formation due to absorbed moisture that reinforces the polymer. However, for HGO samples, the frequency of sound absorption peak is 1898 Hz, which changes to higher values by humidification for 30 and 60 min, respectively. This paper is organized as follows: in the materials and method section, we present the composite preparation and characterization methods. In the results and discussion section, we discuss the prepared sample composition and porosity. Finally, we present sound absorption results and discuss the effect of humidity on sound absorption of the prepared samples.
Materials and methods
GO synthesis
GO was synthesized using the improved hummers method as reported previously by us11,26. In a typical method, we dissolved 0.1 g of graphite with 15 ml of sulfuric acid (98%) and then stirred for 15 min at 25 °C. Afterward, we added 0.3 g of KMnO4 to the solution and placed it in a water/ice bath for 5 min. Afterward, KMnO4 was removed by H2O2 at 40 °C, and then graphite oxide was exfoliated by ultra-sonication. Finally, the solution was placed in a centrifuge with a speed of 1200 RPM to separate GO from graphite oxide, as reported previously by us11.
Composite synthesis
First, we milled the 500 g of potassium polyacrylate (from Atieh Energy Company) for 60 min to obtain a powder. The resulting powder dissolved in 100 ml of deionized water and then stirred for 30 min at 35 °C. Afterward, we added 5 ml of hydrochloric acid (37%) with 100 ml of deionized water to the resulting mixture. Finally, we dried the resulting solution in an oven at 70 °C for 12 h. To dope the GO in HP toward obtaining the most humidity-sensitive sample, we added 20 ml of GO solution with a concentration of 2 g l−1 to the primary solution and then dispersed it for 30 min by sonication. The prepared polymers for measuring the sound absorption were made using a laser cutting machine of 3 cm in diameter and 1 cm in thickness. The sound absorption measurement conditions were performed according to Table 1.
Table 1.
Environmental conditions for measuring sound absorption.
| Atmospheric pressure (Pa) | 88,310 |
| Temperature (°C) | 27 |
| Humidity (%) | 38 |
| Sound speed (m s−1) | 347 |
| Air density (kg m−2) | 1 |
Characterization
FTIR spectroscopy was performed by Thermo scientific model Nicolet iS10. Field emission scanning electron microscopy (FESEM) and X-ray diffraction spectroscopy (EDX) was done by MIRA3 from TSCAN Company. Brunauer Emmett Teller’s (BET) experiment was performed using a Belsorp mini II from Microtrac Bel Corp. The weight of HGO for BET analysis was 0.0586 and 0.0547 g. Impedance Tube was utilized from Manufacturer of BSWA Technology Company Model: BSWA, SW477 + SW422. Raman spectroscopy was performed using Handheld Raman Analyzer (Firstguard) from Rigaku by an exciting wavelength of 1064 nm. Thermogravimetric analysis (TGA) was done by TGA-DTA (Q600) from TA Company, and Transmission Electron Microscopy (TEM) images were recorded by Philips EM208S 100 kV.
Results and discussions
Composite characterization
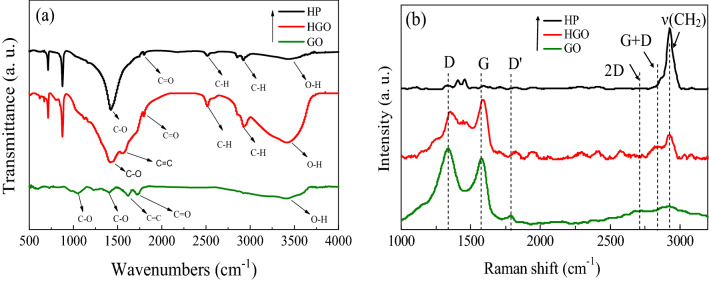
FTIR is a powerful method to determine functional groups of the prepared nanocomposite27. Figure 1a shows the FTIR spectra for GO, HP, and an HGO. In a typical FTIR spectrum for GO, the peaks at 3405, 1622, and 1732 cm−1 are attributed to O–H, C=O, and C=C stretching modes. In addition, the peak observed at 1053, and 1395 cm−1 are attributed to the C–O stretching and bending modes. The peak at 2923 cm−1 is related to the C–H, and two peaks at 1799 and 2315 cm−1 are attributed to C=O and C–O, respectively. O–H peak also appeared at ~ 3500 cm−1 with a relative intensity of 2.1 compared to C=C in agreement with previous reports11,28. As shown, the peak intensity of the O–H functional group increases for HP due to GO in the HGO. This can be attributed to O–H functional groups in GO and adsorbed moisture. In addition, there is an extra peak in the HGO spectrum at 1622 cm−1, corresponding to the C=C bond in GO. As shown, there is no considerable change in the spectrum after reinforcing the polymer by GO.
Figure 1.
(a) Raman and (b) FTIR spectrum of GO, HP, and HGO.
Raman spectroscopy was utilized to examine the GO sheets in the HGO. Carbonic materials show G and D peaks typically at ~ 1580 and ~ 1350 cm−1, respectively29,30. The G band is attributed to E2g phonon, and the D peak is due to a breathing mode of κ-point phonons with A1g symmetry. The D band exhibits local defects of graphene oxide and graphite platelets. Raman spectra of the GO, HP, and HGO are presented in Fig. 1b. As shown, the G and D peaks for HGO respectively are seen at ~ 1603 and ~ 1372 cm−1, while these are disappeared in the HP spectrum. The G (at ~ 1582) and 2D peaks (at ~ 2680 cm−1) are also used to determine the layer number of GO and graphene31–33. As shown in Fig. 1b, the 2D band of GO at 2681 cm−1 overlaps with the G + D band at ~ 2850 and 3000 cm−1 showing the existence of single and few-layer graphene28.
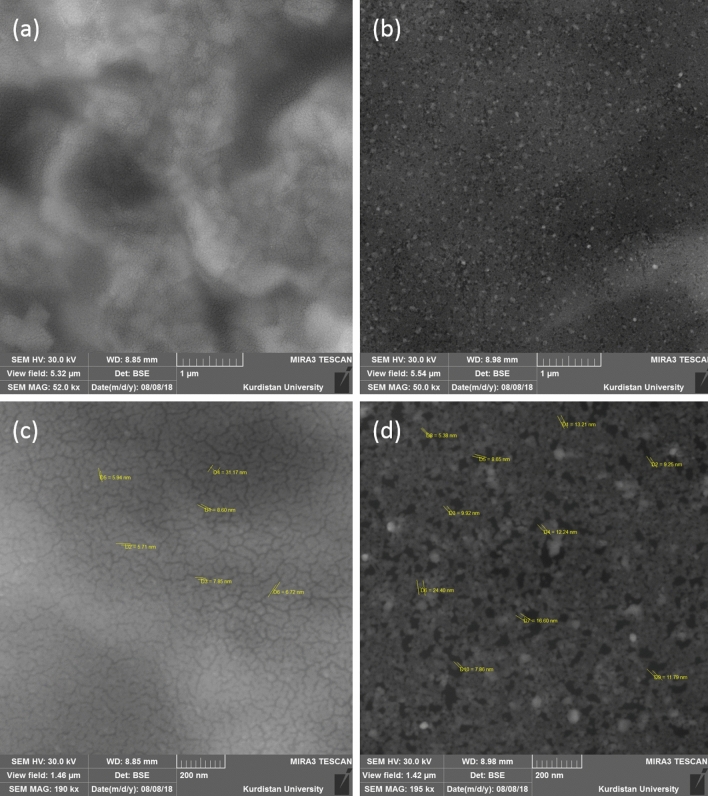
The morphology of the prepared samples was investigated by FESEM. Figure 2 shows the porous surface of the prepared composite. In addition, there are some cracks on the surface of HP, while the surface of HGO has some micropores with a pore size of 5–16 nm. As shown, the porosity of the HGO seems more than the HP, which will be discussed later. In addition, the TEM image in Fig. 3 shows the presence of GO sheets inside HP and created pores in agreement with FESEM results.
Figure 2.
FESEM image of HP and HGO at the scale of 1 µm and 200 nm. (a), and (c) show HP surface; (b) and (d) exhibit HGO surface.
Figure 3.
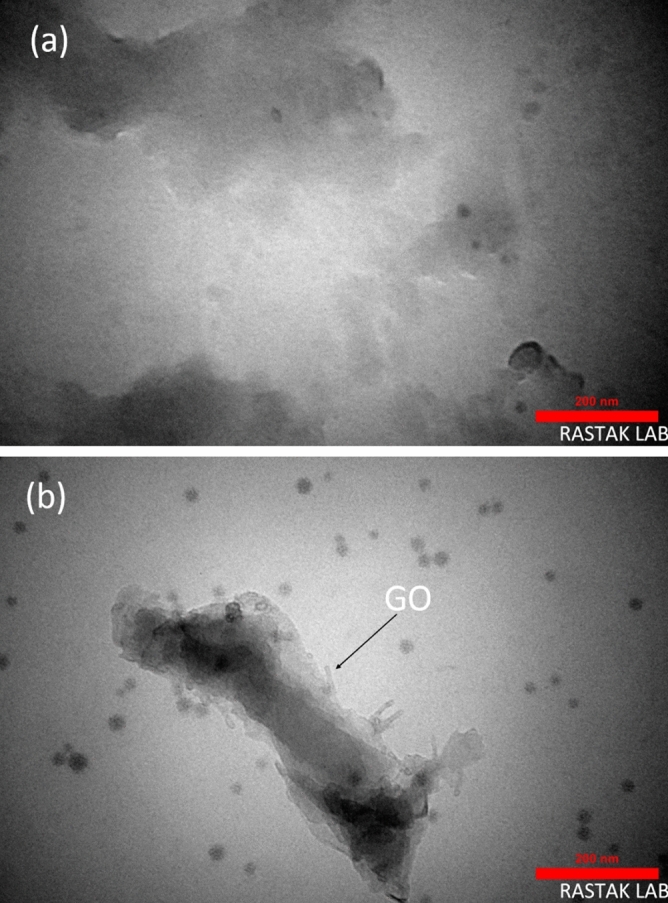
TEM image of (a) HP and (b) HGO with the scale bar of 200 nm.
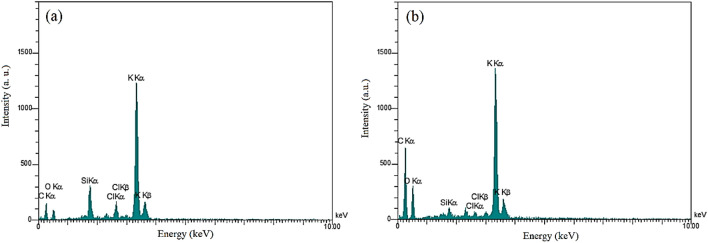
To perform elemental analysis of the samples, we used the EDX experiment. The results of EDX are shown in Fig. 4 and Table 2. As shown in Fig. 4a, about 49.04% of HP is carbon with 15.55% oxygen. However, according to Fig. 4b and Table 2 for the HGO, 65.98% of the composite is carbon, and 18.75% is oxygen. Results show that carbon and oxygen in HGO are more than HP due to GO, which agrees with FTIR results.
Figure 4.
EDX Spectrum of (a) HP, and (b) HGO.
Table 2.
Quantitative results obtained from the EDX spectrum of HP and HGO.
| Element | Shell | Weight% | Atomic% | ||
|---|---|---|---|---|---|
| HP | HGO | HP | HGO | ||
| C | K | 27.12 | 47.08 | 49.04 | 65.98 |
| O | K | 11.46 | 17.82 | 15.55 | 18.75 |
| Si | K | 4.95 | 0.73 | 3.83 | 0.44 |
| Cl | K | 4.01 | 0.78 | 2.45 | 0.37 |
| K | K | 52.46 | 33.60 | 29.13 | 14.46 |
TGA residuum was used to quantify loaded species amount into the polymers. As shown in Fig. 5a, HP weight in TGA has two main steps. The first step (below 250 °C) is attributed to the moisture, and the second step (above 250 °C) is associated with the degradation of the hydrogels that can be several stages depending on the polymer structure. Similar behavior is observed for HGO, and as shown in Fig. 5, in the first step, moisture is released slowly at 230–310 °C with a maximum release rate at 305 °C (Fig. 5b). The different release kinetics of HP and HGO is due to the different interactions between the water molecules in HP and HGO.
Figure 5.
TGA and DTG for (a) HP and (b) HGO.
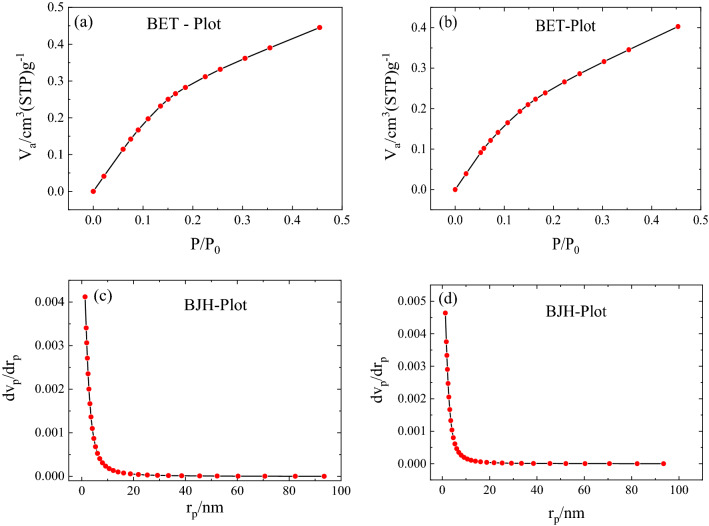
Another factor in sound absorption is the porosity of sound absorbers12. Polymer surface area was investigated using BET analysis from N2 adsorption–desorption isotherms, and results show 3.2416 m2 g−1 and 2.6716 m2 g−1 specific surface areas for HGO and HP, respectively. In addition, the average diameter of the pores in the HP is 10.274 nm, while this is 8.520 nm for HGO. The BET experiment was performed by the adsorption and desorption of nitrogen isomers at 77 K. According to BET theory, the gas adoption can be done in multi-layered form, without any reaction with adjacent molecules34. Typically the increasing trend at low pressure shows micropores, and the hysteresis loop at high pressure is attributed to meso/macropores. As shown in Fig. 6, the absorption and desorption graph of the HP shows type III isotherm indicating weak interaction in the first layer between absorbent and absorber34. However, as presented in Table 3, the HGO shows more porosity than the HP, while pore size calculations by the BJH model based on the Kelvin equation give a value of 2.58 nm for both samples35,36. It is known that BET calculation measures the surface areas, and results can be larger according to enhanced interactions of the gas inside the pores37. However, the BJH model gives the pore radius from adsorbed/desorbed volume at a given pressure according to the following formula38:
| 1 |
where and are the surface tension of gas and the molar volume of the adsorbate, respectively. In this model, cylindrical pores are considered, and the Kelvin radius () is taken equal to the mesopores radius minus the thickness of the adsorbed film. Since the pores in TEM and FESEM images are not cylindrical therefore one gets a smaller pore size than the mean pore size from the BET model.
Figure 6.
(a) and (b) show the BET plot of HP and HGO, and (c) and (d) present the BJH plot of HP and HGO, respectively. The corresponding data are presented in Table 3.
Table 3.
BET and BJH analysis details for HP and HGO.
| Analysis | Sample | Special surface area (cm2 g−1) | Total volume of pore (cm2 g−1) | Mean pore diameter (BET)/pore diameter (BJH) (nm) |
|---|---|---|---|---|
| BET | HP | 2.672 | 0.00686 | 10.27 |
| HGO | 3.242 | 0.00690 | 8.52 | |
| BJH | HP | 8.299 | 0.00823 | 2.58 |
| HGO | 8.939 | 0.00945 | 2.58 |
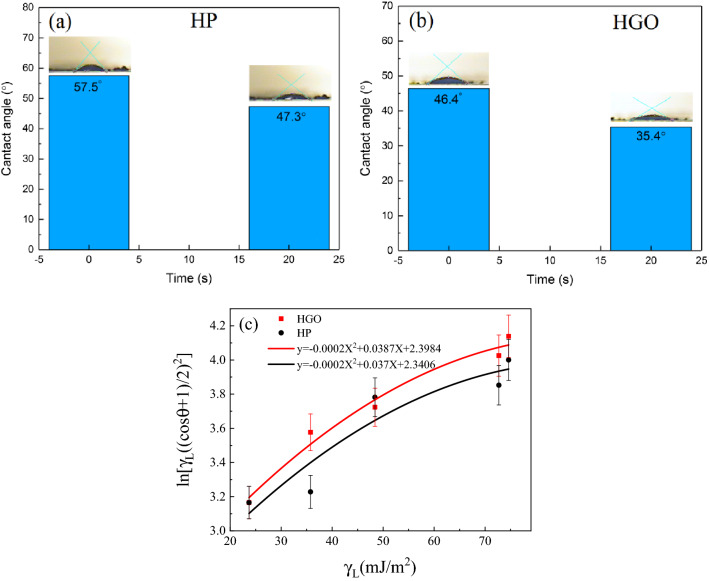
The contact angle of water droplets was measured on the surface of the HP and HGO. We recorded the contact angle of the droplet for at least 10 points on the surface, immediately and after 20 s. The mean contact angle of the water droplets on the HP and HGO surface is 52.4° and 40.9° at first, respectively (Fig. 7a,b). Using the Neumann method, we obtained the surface energy by the following formula:
| 2 |
Figure 7.
(a) and (b) the mean contact angle of water droplets on the HP and HGO immediately after dropping, and after 20 s, (c) The fitted curve on contact angle results of various liquids to calculate the surface energy of HP and HGO.
In Eq. (2), , , and θ represent the surface tension of the liquid, sample, and the contact angle of a droplet, respectively. To obtain the surface energy, we measured the contact angle of various liquids (including ethylene glycol, water, acetone, DMF, and H2O2) on the surface. Corresponding error bars in Fig. 7c were obtained by averaging the values at different points. By plotting versus and fitting a second-order curve (Fig. 7c), β is determined as , and surface energy of HP and HGO is calculated as 51.5 and 58.4 , respectively. Results confirm that the hydrophilicity of the HP increases due to GO in the polymer39. Adding GO as a reinforcing phase increases the surface porosity that enhances the surface roughness, leading to the increase of surface hydrophilicity according to the well-known Wenzel model40.
Sound absorption
To measure the sound absorption, we used a two-microphone impedance tube with a diameter of 3 cm (BSWA model 422). The absorption coefficient, reflection, impedance, and sound admittance were measured by the impedance tube. Sound reflection measurement was carried out using the transfer function method, according to Eq. (2):
| 3 |
where and are the real and imaginary components of the reflected wave, respectively. is the sample distance from the farther microphone. and are also the transfer function for the incident and reflected wave, and is the transfer function between the two microphones. Finally, the absorption of sound was obtained from41:
| 4 |
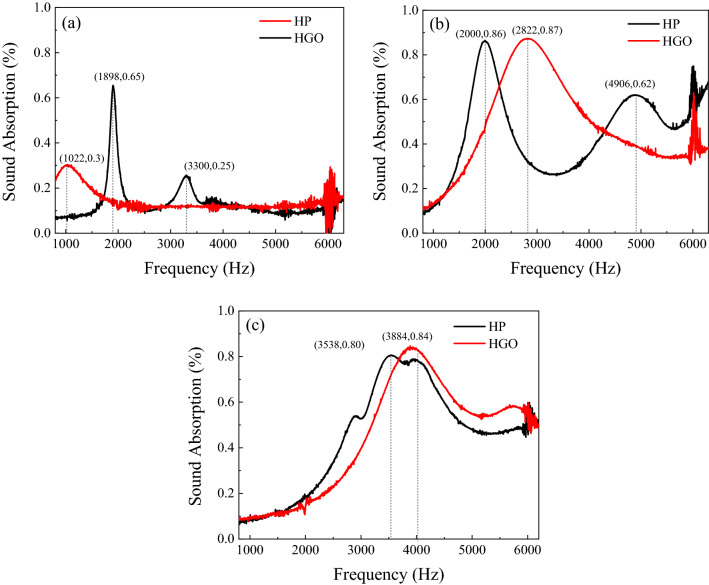
To study the humidity effect on the sound absorption of the prepared samples, we exposed them to the humidity (100% RH) for 30 and 60 min. As shown in Fig. 8a, the main absorption peak appears at 1898 Hz with an absorption coefficient of 0.65, while the second absorption peak is seen at a frequency of 3300 Hz with an absorption value of 0.25. However, for the HP, we see an absorption peak at 1022 Hz with a value of 0.3. The difference in the frequency of the absorption peak between HP and HGO can be attributed to the pores’ diameter42. By exposing the HGO to the humidity for 30 min, the peak shifts to the frequency of 2822 Hz with an absorption coefficient of 0.87 (Fig. 8b). However, for HP samples, the absorption peak appears at 2000 and 4906 Hz with absorption values of 0.88 and 0.62, respectively. In addition, HGO and HP after 60 min humidity exposure show the peak at 3884 and 3538 Hz, respectively (Fig. 8c). As a result, the frequency difference between HGO and bare HP decreases from 822 to 346 Hz by increasing the humidification time to 60 min.
Figure 8.
Sound absorption of (a) as-prepared, (b) after 30 min humidification, and (c) after 60 min humidification.
Results in Fig. 8 show an increase in sound absorption due to humidity. Sound absorbents can reduce sound energy by converting vibrating energy into heat43,44. As shown in Fig. 8, sound absorption in HGO is greater than HP, and the moisture increases the intensity of sound absorption peak for HGO with the values of 0.87 and 0.84. The humidification process is repeatable, and the prepared samples can be recovered by heating for 1 h, while in the air atmosphere, it takes a month.
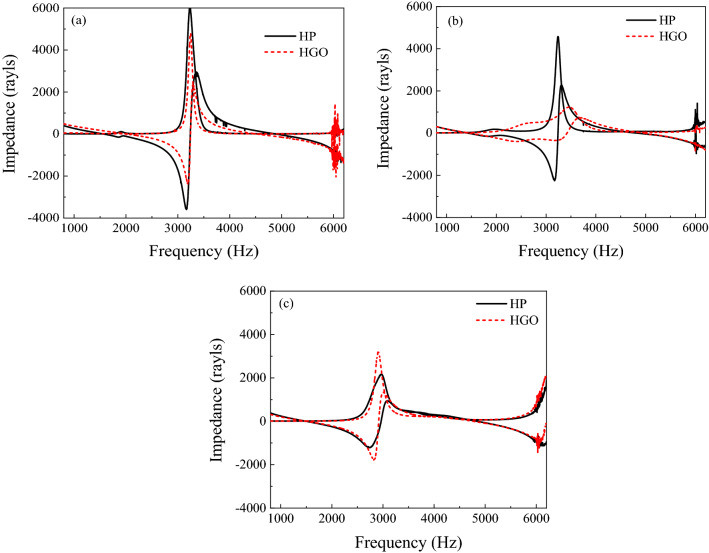
According to the Helmholtz theorem, in a resonance condition, the impedance becomes zero44. Figure 9a shows acoustic impedance for the HGO, which is zero in the range of 1500–2000 Hz and 3000–3500 Hz. According to the Helmholtz plot, when the acoustic impedance is zero, resonance occurs in system11. Figure 9a shows the maximum impedance domain in the frequency range of 2000–3000 Hz for HP and HGO, indicating the coating’s resistance to sound waves. As shown in Fig. 9b, the acoustic impedance for HGO has the highest amplitude at the frequency range of 2500–3000 Hz. Figure 9c also shows that the acoustic impedance at 2500–4500 Hz for HGO has the highest amplitude. Acoustic impedance is the ratio of applied sound pressure to the speed of the matching particle11. Therefore, at such a frequency of sound, one sees maximum sound absorption of the prepared samples.
Figure 9.
Acoustic impedance of HGO and HP after humidification for (a) 0, (b) 30, and (c) 60 min.
Conclusions
In summary, sound absorbers were prepared based on HP and GO, and then sound absorption was measured. We show that GO increases the surface energy of the nanocomposite as well as sound absorption. FESEM and BET results show a porous structure for HP while doping it by GO as the reinforcing phase increases porosity. The sound absorption was studied using an impedance tube in the frequency range of 1000–6000 Hz. Results show that the HGO shows two main peaks around 1898 and 3300 Hz, while HP exhibits one peak at 1022 Hz. In addition, moisture exposure tunes the sound absorption, and two absorption peaks shift to 2000 and 4906 Hz.
Acknowledgements
We thanks University of Zanjan for financial supports.
Author contributions
A.K., formal analysis investigation, writing-original draft preparation, writing-review and editing, R.R., conceptualization and supervision, methodology, writing-review and editing, H.H., writing-review, editing and Y.A., supervision. All authors have read and agreed to the published version of the manuscript.
Data availability
The data presented in this study are available on request from the corresponding author.
Competing interests
The authors declare no competing interests.
Footnotes
Publisher's note
Springer Nature remains neutral with regard to jurisdictional claims in published maps and institutional affiliations.
References
- 1.Cheng B, Gao N, Zhang R, Hou H. Design and experimental investigation of broadband quasi-perfect composite loaded sound absorber at low frequencies. Appl. Acoust. 2021;178:108026. doi: 10.1016/j.apacoust.2021.108026. [DOI] [Google Scholar]
- 2.Yu T, et al. Acoustic insulation and absorption mechanism of metallic hollow spheres composites with different polymer matrix. Compos. Struct. 2020;248:112566. doi: 10.1016/j.compstruct.2020.112566. [DOI] [Google Scholar]
- 3.Yang X, et al. Multi-layer polymer-metal structures for acoustic impedance matching in high-frequency broadband ultrasonic transducers design. Appl. Acoust. 2020;160:107123. doi: 10.1016/j.apacoust.2019.107123. [DOI] [Google Scholar]
- 4.Balaji PS, Karthik SelvaKumar K. Applications of nonlinearity in passive vibration control: A review. J. Vib. Eng. Technol. 2021;9:183–213. doi: 10.1007/s42417-020-00216-3. [DOI] [Google Scholar]
- 5.Vural DC, Leggett AJ. Universal sound absorption in amorphous solids: A theory of elastically coupled generic blocks. J. Non-Cryst. Solids. 2011;357:3528–3537. doi: 10.1016/j.jnoncrysol.2011.06.035. [DOI] [Google Scholar]
- 6.Lu M-H, Feng L, Chen Y-F. Phononic crystals and acoustic metamaterials. Mater. Today. 2009;12:34–42. doi: 10.1016/S1369-7021(09)70315-3. [DOI] [Google Scholar]
- 7.Li X-F, et al. Tunable unidirectional sound propagation through a sonic-crystal-based acoustic diode. Phys. Rev. Lett. 2011;106:084301. doi: 10.1103/PhysRevLett.106.084301. [DOI] [PubMed] [Google Scholar]
- 8.Khelif A, et al. Trapping and guiding of acoustic waves by defect modes in a full-band-gap ultrasonic crystal. Phys. Rev. B. 2003;68:214301. doi: 10.1103/PhysRevB.68.214301. [DOI] [Google Scholar]
- 9.He C, et al. Acoustic topological insulator and robust one-way sound transport. Nat. Phys. 2016;12:1124. doi: 10.1038/nphys3867. [DOI] [Google Scholar]
- 10.He H, et al. Topological negative refraction of surface acoustic waves in a Weyl phononic crystal. Nature. 2018;560:61. doi: 10.1038/s41586-018-0367-9. [DOI] [PubMed] [Google Scholar]
- 11.Qamoshi K, Rasuli R. Subwavelength structure for sound absorption from graphene oxide-doped polyvinylpyrrolidone nanofibers. Appl. Phys. A. 2016;122:788. doi: 10.1007/s00339-016-0332-0. [DOI] [Google Scholar]
- 12.Shen Y, Jiang G. The influence of production parameters on sound absorption of activated carbon fiber felts. J. Text. Inst. 2016;107:1144–1149. doi: 10.1080/00405000.2015.1097083. [DOI] [Google Scholar]
- 13.Otsuru T, Tomiku R, Okamoto N, Yamauchi S. Sound absorption deviation measured using pressure–velocity sensors by ensemble averaging technique under different relative humidity conditions. Appl. Acoust. 2017;122:121–127. doi: 10.1016/j.apacoust.2017.02.015. [DOI] [Google Scholar]
- 14.Yilmazer S, Ozdeniz MB. The effect of moisture content on sound absorption of expanded perlite plates. Build. Environ. 2005;40:311–318. doi: 10.1016/j.buildenv.2004.07.004. [DOI] [Google Scholar]
- 15.Sun X, Agate S, Salem KS, Lucia L, Pal L. Hydrogel-based sensor networks: Compositions, properties, and applications—A review. ACS Appl. Bio Mater. 2020;4:140–162. doi: 10.1021/acsabm.0c01011. [DOI] [PubMed] [Google Scholar]
- 16.Thompson BR, et al. Sound transmission loss of hierarchically porous composites produced by hydrogel templating and viscous trapping techniques. Mater. Chem. Front. 2017;1:2627–2637. doi: 10.1039/C7QM00371D. [DOI] [Google Scholar]
- 17.Gao N, Wu J, Lu K, Zhong H. Hybrid composite meta-porous structure for improving and broadening sound absorption. Mech. Syst. Signal Process. 2021;154:107504. doi: 10.1016/j.ymssp.2020.107504. [DOI] [Google Scholar]
- 18.Opiela KC, Zieliński TG. Microstructural design, manufacturing and dual-scale modelling of an adaptable porous composite sound absorber. Compos. Part B Eng. 2020;187:107833. doi: 10.1016/j.compositesb.2020.107833. [DOI] [Google Scholar]
- 19.Xie S, Yang S, Yang C, Wang D. Sound absorption performance of a filled honeycomb composite structure. Appl. Acoust. 2020;162:107202. doi: 10.1016/j.apacoust.2019.107202. [DOI] [Google Scholar]
- 20.Zhu J, Zhu X, Yin X, Wang Y, Zhang X. Unidirectional extraordinary sound transmission with mode-selective resonant materials. Phys. Rev. Appl. 2020;13:041001. doi: 10.1103/PhysRevApplied.13.041001. [DOI] [Google Scholar]
- 21.Liu J, Guo H, Wang T. A review of acoustic metamaterials and phononic crystals. Curr. Comput.-Aided Drug Des. 2020;10:305. [Google Scholar]
- 22.Thomazelli R, Bertoli S. An experimental study on the optimization of the production and efficiency of tunable Helmholtz absorbers for the modal control of small rooms. Build. Acoust. 2019;26:69–91. doi: 10.1177/1351010X19829870. [DOI] [Google Scholar]
- 23.Li Y, et al. Superbroad-band actively tunable acoustic metamaterials driven from poly (ethylene terephthalate)/Carbon nanotube nanocomposite membranes. Nano Res. 2021;14:100–107. doi: 10.1007/s12274-020-3048-6. [DOI] [Google Scholar]
- 24.Liu P, et al. Synthesis of lightweight N-doped graphene foams with open reticular structure for high-efficiency electromagnetic wave absorption. Chem. Eng. J. 2019;368:285–298. doi: 10.1016/j.cej.2019.02.193. [DOI] [Google Scholar]
- 25.Wang Y, Di X, Wu X, Li X. MOF-derived nanoporous carbon/Co/Co3O4/CNTs/RGO composite with hierarchical structure as a high-efficiency electromagnetic wave absorber. J. Alloy. Compd. 2020;846:156215. doi: 10.1016/j.jallcom.2020.156215. [DOI] [Google Scholar]
- 26.Shahriary L, Athawale AA. Graphene oxide synthesized by using modified hummers approach. Int. J. Renew. Energy Environ. Eng. 2014;2:58–63. [Google Scholar]
- 27.Ingle Jr, J. D. & Crouch, S. R. Spectrochemical analysis. (1988).
- 28.Rasuli R, Mokarian Z, Karimi R, Shabanzadeh H, Abedini Y. Wettability modification of graphene oxide by removal of carboxyl functional groups using non-thermal effects of microwave. Thin Solid Films. 2015;589:364–368. doi: 10.1016/j.tsf.2015.06.002. [DOI] [Google Scholar]
- 29.Akhavan O. The effect of heat treatment on formation of graphene thin films from graphene oxide nanosheets. Carbon. 2009;48:509–519. doi: 10.1016/j.carbon.2009.09.069. [DOI] [Google Scholar]
- 30.Akhavan O. Bacteriorhodopsin as a superior substitute for hydrazine in chemical reduction of single-layer graphene oxide sheets. Carbon. 2015;81:158–166. doi: 10.1016/j.carbon.2014.09.044. [DOI] [Google Scholar]
- 31.Gao L, et al. Repeated growth and bubbling transfer of graphene with millimetre-size single-crystal grains using platinum. Nat. Commun. 2012;3:699. doi: 10.1038/ncomms1702. [DOI] [PMC free article] [PubMed] [Google Scholar]
- 32.Chae SJ, et al. Synthesis of large-area graphene layers on poly-nickel substrate by chemical vapor deposition: Wrinkle formation. Adv. Mater. 2009;21:2328–2333. doi: 10.1002/adma.200803016. [DOI] [Google Scholar]
- 33.Calizo I, Balandin AA, Bao W, Miao F, Lau CN. Temperature dependence of the Raman spectra of graphene and graphene multilayers. Nano Lett. 2007;7:2645–2649. doi: 10.1021/nl071033g. [DOI] [PubMed] [Google Scholar]
- 34.Chen W, Li F, Yu J, Liu L. A facile and novel route to high surface area ceria-based nanopowders by salt-assisted solution combustion synthesis. Mater. Sci. Eng. B. 2006;133:151–156. doi: 10.1016/j.mseb.2006.06.020. [DOI] [Google Scholar]
- 35.Liu P, et al. Hollow engineering to Co@N-doped carbon nanocages via synergistic protecting-etching strategy for ultrahigh microwave absorption. Adv. Funct. Mater. 2021;1:10. doi: 10.1002/adfm.202102812. [DOI] [Google Scholar]
- 36.Wang Y, Di X, Lu Z, Wu X. Rational construction of hierarchical Co@C@NPC nanocomposites derived from bimetallic hybrid ZIFs/biomass for boosting the microwave absorption. J. Colloid Interface Sci. 2021;589:462–471. doi: 10.1016/j.jcis.2021.01.013. [DOI] [PubMed] [Google Scholar]
- 37.Barrett EP, Joyner LG, Halenda PP. The determination of pore volume and area distributions in porous substances. I. Computations from nitrogen isotherms. J. Am. Chem. Soc. 1951;73:373–380. doi: 10.1021/ja01145a126. [DOI] [Google Scholar]
- 38.Medeiros-Costa IC, Laroche C, Pérez-Pellitero J, Coasne B. Characterization of hierarchical zeolites: Combining adsorption/intrusion, electron microscopy, diffraction and spectroscopic techniques. Microporous Mesoporous Mater. 2019;287:167–176. doi: 10.1016/j.micromeso.2019.05.057. [DOI] [Google Scholar]
- 39.D’urso B, Simpson J, Kalyanaraman M. Emergence of superhydrophobic behavior on vertically aligned nanocone arrays. Appl. Phys. Lett. 2007;90:044102. doi: 10.1063/1.2433039. [DOI] [Google Scholar]
- 40.Allahyari P, Rasuli R, Servati M, Alizadeh M. Superhydrophobic and low-hysteresis coating based on rubber-modified TiO2/SiO2 nanoparticles. Bull. Mater. Sci. 2021;44:85. doi: 10.1007/s12034-021-02384-8. [DOI] [Google Scholar]
- 41.Novak, C., Ule, H. & Cert, J. K. I. B. In INTER-NOISE and NOISE-CON Congress and Conference Proceedings. 815–822 (Institute of Noise Control Engineering).
- 42.Maldovan M. Sound and heat revolutions in phononics. Nature. 2013;503:209. doi: 10.1038/nature12608. [DOI] [PubMed] [Google Scholar]
- 43.Rabbi, A., Bahrambeygi, H., Nasouri, K., Shoushtari, A. M. & Babaei, M. R. Manufacturing of PAN or PU nanofiber layers/PET nonwoven composite as highly effective sound absorbers. Adv. Polym. Technol.33, 21425–21432 (2014).
- 44.Cox T, d’Antonio P. Acoustic Absorbers and Diffusers: Theory, Design and Application. CRC Press; 2016. [Google Scholar]
Associated Data
This section collects any data citations, data availability statements, or supplementary materials included in this article.
Data Availability Statement
The data presented in this study are available on request from the corresponding author.


