

Abstract
Background
Irinotecan (CPT11) is an important drug for small cell lung cancer (SCLC) chemotherapy (CTx). UDP‐glucuronosyltransferase 1A1 (UGT1A1) polymorphisms can influence CPT11‐related toxicity. This study aimed to assess prevalence of UGT1A1 polymorphisms and their association with clinical outcomes in patients with SCLC on CPT11‐CTx.
Methods
An observational cohort of treatment‐naïve patients with SCLC was given CPT11‐platinum doublet at a referral center in North India over 3 years. Clinical outcomes assessed were hematological and gastrointestinal toxicity (Common Terminology Criteria for Adverse Events, version 3.0), response rates (RECIST), and overall survival (OS). Peripheral blood was drawn from all enrolled patients just prior to CPT11‐CTx initiation, and genomic DNA was isolated. Genotyping was done by polymerase chain reaction (PCR)–restriction fragment length polymorphism for UGT1A1*7, UGT1A1*6, and UGT1A1*27 and by PCR‐DNA sequencing for UGT1A1*28. Patients were classified as homozygous wild‐type (WT/WT), heterozygous mutant (WT/M), or homozygous mutant (M/M) for each polymorphism assessed.
Results
Of 140 patients enrolled, no mutant alleles were found for UGT1A1*27 or UGT1A1*7. Frequency of UGT1A1*6 polymorphisms (n = 111) was 89.2% for WT/WT, 8.1% for WT/M, and 2.7% for M/M. For UGT1A1*28 (n = 102), this was 41.2% for WT/WT, 43.1% for WT/M, and 15.7% for M/M. UGT1A1*6 WT/WT patients tolerated >95% predicted CPT11 dose more frequently (59.6% vs. 25.0% in WT/M‐M/M combined group; p = .026). The UGT1A1*6 WT/M‐M/M group also experienced severe (grade ≥3) diarrhea (41.7% vs. 17.2% in WT/WT; p = .044) and mucositis (41.7% vs. 8.1% in WT/WT; p = .005) more frequently. On multivariate logistic regression analysis, UGT1A1*6 WT/M‐M/M status was the only variable associated with occurrence of both mucositis (odds ratio [OR], 10.4) and severe diarrhea (OR, 4.8). UGT1A1*28 WT/M‐M/M patients had better OS (320 days [95% confidence interval, 203–437] vs. 216 days [95% confidence interval, 140–292] in WT/WT group; p = .047). On multivariate Cox proportional hazards analysis, UGT1A1*28 WT/M‐M/M status was independently associated with better OS (hazard ratio, 0.35), whereas lack of objective radiological response, moderate/heavy smoking, and increasing age were associated with worse OS.
Conclusion
UGT1A1*6 and UGT1A1*28 polymorphisms were associated with increased gastrointestinal toxicity and improved OS, respectively, in North Indian patients with SCLC receiving CPT11‐CTx.
Implications for Practice
UGT1A1 gene polymorphisms are known to influence irinotecan‐related toxicity. In this prospective cohort study of patients with small cell lung cancer receiving first‐line irinotecan‐platinum chemotherapy, the prevalence of UGT1A1*6 polymorphisms was found to be 10.8% UGT1A1*6 and 58.8% UGT1A1*28 homo/heterozygous mutant, respectively. UGT1A1*6 homo/heterozygous mutant status was associated with severe diarrhea and mucositis. UGT1A1*28 homo/heterozygous mutant status was independently associated with improved overall survival.
Keywords: UGT1A1, Small cell lung cancer, Polymorphism, Toxicity, Survival
Short abstract
This article describes the prevalence of UGT1A1 polymorphisms in a cohort of 140 patients with treatment‐naïve small cell lung cancer (SCLC) and assesses the association of UGT1A1 polymorphisms with clinical outcomes in patients treated with irinotecan‐based chemotherapy for SCLC.
Introduction
Lung cancer is the leading cause of cancer‐related deaths globally. Small cell lung cancer (SCLC) accounts for approximately 20% of all lung cancers in India [1]. Standard treatment of SCLC is platinum‐based doublet chemotherapy (commonly cisplatin or carboplatin combined with either etoposide or irinotecan). Irinotecan (CPT11) has displayed promising results in several malignancies such as lung and colorectal cancers. Irinotecan is a camptothecin analog that is mainly converted by carboxylesterase to an active metabolite, SN‐38 (7‐ethyl‐10‐hydroxycamptothecin), a potent topoisomerase I inhibitor. Subsequently, SN‐38 is conjugated to an inactive glucuronic acid conjugate (SN‐38G) by UDP‐glucuronosyltransferase 1A1 (UGT1A1) [2]. Large interindividual variability in the pharmacokinetics of active metabolite SN‐38 is an important factor influencing clinical outcomes and toxicity (including myelosuppression and diarrhea) of irinotecan‐based chemotherapy and is explained in part by genetic variation [3, 4, 5].
Common side effects of irinotecan are gastrointestinal effects (diarrhea, nausea, vomiting) and cytopenias (neutropenia, leukopenia, anemia) [6]. The UGT enzyme has three isoenzymes, 1A1, 1A7, and 1A9, and their genes are characterized by polymorphism. UGT1A1 is the main isoform of UGTs involved in the formation of SN‐38G. Genetic polymorphisms of the UGT1A1 gene can explain the variability of irinotecan‐related toxicity among patients, particularly UGT1A1*28, the presence of which predicts CPT11‐induced neutropenia. UGT1A1*28, characterized by an extra seventh dinucleotide (TA) insertion in the (TA)6TAA‐box in the promoter region, is the most common, leading to decreased converting activity of SN‐38 to SN‐38G and resulting in increased plasma SN‐38 level and severe irinotecan toxicity. UGT1A1*28 allele is associated with reduced levels of enzyme. Therefore, individuals with the wild genotype sequence (*1/*1) who have average levels of the enzyme will metabolize SN‐38 more quickly than those who are either heterozygous (*1/*28) or homozygous (*28/*28) for this allele. Higher or more prolonged UGT1A1*28 variant exposure to the active form of irinotecan is thought to explain many of the adverse drug events associated with irinotecan use, including severe neutropenia and severe diarrhea. Thus, if irinotecan dosage can be modified on the basis of patients’ UGT1A1 genotype, some proportion of these adverse events might be avoided [7]. UGT1A1*6 and *27 alleles, two variants in exon 1 of the UGT1A1 gene, are found mainly among individuals of Asian descent and have also been indicated to affect enzyme function [8]. The frequency of the UGT1A1*28 variant allele has been reported to be 30%–45% in White, African, and Indian populations, which is approximately twice that of the 10%–20% frequency reported in East Asian populations. UGT1A1*6 has been detected in 16%–40% of Asian individuals, but it is extremely rare in White and African populations [9]. UGT1A1*6 and/or UGT1A1*28 polymorphism status thus may be potential biomarkers for predicting irinotecan‐related severe toxicities in the Asian population [9].
To best of our knowledge, there are no Indian data available about irinotecan‐related adverse effects and their correlation with UGT1A1 polymorphisms in patients with SCLC. We evaluated UGT1A1 polymorphisms in patients with SCLC undergoing irinotecan‐based chemotherapy in this prospective study and correlated them with various clinical outcomes.
Materials and Methods
Sample Collection and Study Design
The current study enrolled patients with SCLC presenting to the lung cancer clinic of the authors’ institute. Consecutive newly diagnosed patients with cytologically or histologically proven SCLC were enrolled over a 3‐year period (January 2013 to December 2015). The study was reviewed and approved by the institutional ethics committee. Informed written consent was obtained from all participants.
Patients were evaluated at baseline for complete blood count, renal function tests, liver function tests, chest radiograph, and contrast enhanced computed tomography scan of thorax (including upper abdomen). Imaging of brain was not mandatory but typically was requested if there was suspicion of brain metastases on clinical evaluation. Demographic characteristics (including age, gender, and performance status [PS]), histological type, stage of disease, and details of smoking status were noted for all patients and were described in detail in our previous publications [10, 11, 12, 13]. Cumulative smoking exposure was calculated by the smoking index, which is defined as number of bidis and cigarettes smoked in a day multiplied by number of years of smoking [1]. Smokers were also assessed for quitting status. Complete blood count was done on day 10 of the first chemotherapy cycle and also of subsequent cycles, if indicated. Complete blood count and renal and liver function tests were also done prior to each cycle of chemotherapy and 3–4 weeks after the last cycle of chemotherapy.
Chemotherapy Regimen
The regimen primarily used was irinotecan 100 mg/m2 plus cisplatin 60 mg/m2 each on day 1 of a 3‐week cycle. An alternate regimen was irinotecan 65 mg/m2 plus cisplatin 30 mg/m2 each on days 1 and 8 of a 3‐week cycle [10]. As per normal protocol followed at our institute, four cycles of chemotherapy were administered before tumor response assessment. In presence of unacceptable toxicity or clinicoradiological suggestion of disease progression, tumor response assessment was performed prior to completion of four cycles and chemotherapy was stopped, if indicated. Patients with an objective response to treatment received two additional cycles (maximum of six cycles). Tumor response assessment was done using RECIST version 1.0 criteria. Adverse events (AEs) were noted and classified as per common toxicity criteria version 3.0 (all patients who received at least one cycle of chemotherapy). AEs were managed as per standard protocols of our clinic [14]. Any patient for whom outpatient management was either not feasible or not effective was admitted, including those with febrile neutropenia or with grade 3 or higher gastrointestinal AEs. Any other AEs that were due to chemotherapy were also noted.
Follow‐up was every 3 weeks during chemotherapy and thereafter at 3‐month intervals during the rest of the study period. Overall survival (OS) was calculated from date of initiation of chemotherapy to date of death or date of last follow‐up. February 15, 2019, was taken as the cutoff for OS analysis.
DNA Extraction
On the day of and prior to administration of irinotecan‐based chemotherapy, 10 mL of peripheral blood was collected for genetic polymorphism assessment. Genomic DNA was isolated from clotted blood. Briefly, blood (4 mL) was washed three times with 320 mM sucrose, 1.5% Triton X‐100, 20 mM Tris‐HCl (pH 8.0), and 5 mM MgCl2 to remove red cells. The White Blood Cell (WBC) pellet as obtained was lysed by resuspending it in WBC lysis buffer, which consisted of 400 mM Tris‐HCl (pH 8.0), 200 mM NaCl, 80 mM EDTA, 1% SDS, and 100 μg/mL proteinase K. The pellet was then incubated at 45°C overnight. Deproteinization was carried out by a solution of phenol, chloroform, and isoamyl alcohol (25:24:1). After mixing and centrifugation at 8,000 rpm for 7 minutes, the aqueous phase was transferred to a fresh tube and the step was repeated once again. Finally, the aqueous phase was transferred, and DNA was precipitated by the addition of an equal volume of chilled isopropanol. DNA was recovered after centrifugation at 10,000 rpm for 5 minutes, washed with ice‐cold 70% ethanol, and finally resuspended in 200 μL of sterile Tris‐EDTA buffer. The quality and quantity of DNA were determined by agarose gel electrophoresis and spectrophotometric analysis using NanoDrop (NanoDrop ND‐1000 spectrophotometer, Thermo Fisher Scientific, Waltham, MA). DNA was diluted to 100 ng/μl and was stored at −20°C for further use as template.
Genotyping
The genetic polymorphisms that were studied in the present study are listed in supplemental online Table 1. For the genotyping of UGT1A1*6, polymerase chain reaction (PCR)–restriction fragment length polymorphism (RFLP) was performed. The amplification of UGT1A1*6 was carried out using primers designed to amplify a 146–base pair (bp) segment. The forward and reverse primers were 5’‐AGATACTGTTGATCCCAGTG‐3’ and 5’‐CTTCAAGGTGTAAAATGGTC‐3’, respectively. PCR was subjected to a volume of 15 μL containing 0.2 mM of each deoxynucleoside triphosphate, 50 mM KCl, 10 mM Tris‐HCl (pH 8.3), 1.5 mM MgCl2, 0.5 mM of each primer (Eurofinn Genomics, Bengaluru, India), and 5 units of Taq polymerase (DNAzyme II DNA Polymerase, Thermo Fisher Scientific). PCR conditions were as follows: 95°C for 5 minutes followed by 25 cycles of 94°C for 30 seconds, 54°C for 40 seconds, and 72°C for 40 seconds (Bio‐Rad T‐100 PCR Thermal Cycler, Hercules, CA). PCR product (10 μL) was digested with 2 units of Avall (New England Biolabs, Ipswich, MA) at 37°C.
For UGT1A1*27, the PCR‐RFLP approach was used to evaluate the genotyping. The PCR amplifications were performed using forward and reverse primers (Eurofinn Genomics) 5’‐CACTGTATTCTTCTTGCATG‐ 3’ and 5’‐CGATCCAAAGTAATACATCTG‐3’, respectively, designed to amplify a 425‐bp segment. PCR conditions were as follows: 95°C for 5 minutes followed by 25 cycles of 94°C for 30 seconds, 52°C for 40 seconds, and 72°C for 40 seconds (Bio‐Rad T‐100 PCR Thermal Cycler). PCR product (10 μL) was digested with 2.5 units of BsrI (New England Biolabs) at 65°C.
The genotyping of UGT1A1*7 was performed through PCR‐RFLP, and the PCR amplifications was performed using forward and reverse primers 5’‐GTGGAGTTTGTGATGAGGCA‐ 3’ and 5’‐GGAAATGACTAGGGAATGGT‐3’ (Eurofinn Genomics), respectively, designed to amplify a 270‐bp segment. PCR conditions were as follows: 95°C for 5 minutes followed by 25 cycles of 94°C for 30 seconds, 62°C for 40 seconds, and 72°C for 40 seconds (Bio‐Rad T‐100 PCR Thermal Cycler). PCR product (10 μL) was digested with 2 units of AvaIl (New England Biolabs) at 37°C.
Similarly, UGT1A1*29 genotyping was performed using the PCR‐RFLP method. For UGT1A1*29, amplifications were performed using nested PCR. For primary PCR, forward and reverse primers used were 5’‐GAAGTAAAGGAGAGGAAAAT‐3’ and 5’‐TTTTATCATGAATGCCATGACC‐3’, respectively (Eurofinn Genomics). PCR conditions were as follows: 95°C for 5 minutes followed by 25 cycles of 94°C for 30 seconds, 52°C for 40 seconds, and 72°C for 40 seconds (PCR Thermal Cycler). For secondary PCR, forward and reverse primers were 5’‐TCCTCCCTATTTTGCATCTCAGGTCACCCGATGGCC‐3’ and 5’‐TGAATGCCATGACCAAA‐3’ designed to amplify a 285‐bp segment. PCR conditions were as follows: 95°C for 5 minutes followed by 25 cycles of 94°C for 30 seconds, 58°C for 40 seconds, and 72°C for 40 seconds (Bio‐Rad T‐100 PCR Thermal Cycler). PCR product (10 μL) was digested with 2 units of Sau961 (New England Biolabs) at 37°C. Restriction fragments were analyzed by 2.5% agarose gel electrophoresis and ethidium bromide staining.
For UGT1A1*28 analysis, promoter fragments, depending on the number of TA repeats, were amplified by PCR with the forward and reverse primers 5′‐GTCACGTGACACAGTCAAAC ‐3′ and 5′‐TTTGCTCCTGCCAGAGGTT‐3′ (Eurofinn Genomics), respectively. PCR conditions were as follows: 95°C for 5 minutes followed by 25 cycles of 94°C for 30 seconds, 62°C for 40 seconds, and 72°C for 40 seconds (Bio‐Rad T‐100 PCR Thermal Cycler). Aliquots of PCR products were electrophoresed on 1.7% agarose gel to check their quality. For single‐stranded conformational polymorphism (SSCP) analysis, 6 μL of PCR products was mixed with equal volume of formamide loading buffer (95% formamide, 0.05% xylene cyanol, 0.05% bromophenol blue, 20 mM NaOH, and 20 mM EDTA). The mixture was heated at 95°C–97°C for 3 minutes, then immediately transferred to ice. The total volume was loaded on 14% (37:1) polyacrylamide gels. Electrophoresis was run in an electrophoresis unit (Bio‐Rad) in 0.5× TBE buffer (50 mM Tris‐borate, pH 8.3, and 0.5 mM EDTA) at a constant power of 20 Watts at 9°C for 3.5 hours. After electrophoresis, SSCP patterns were visualized by silver staining.
Statistical Analysis
Genotypic calculations regarding frequencies of polymorphisms were done using the statistical software Medcalc version 15.5.5 (Medcalc Software, Ostend, Belgium) wherein the Hardy‐Weinberg equilibrium theory (p2 + 2pq + q2 = 1, where p is the frequency of the wild‐type allele and q is the frequency of the variant allele) was used. Data were analyzed using SPSS statistical software (version 22.0). Descriptive data are presented as mean ± SD, median (interquartile range), or numbers and percentages. Comparison between groups was done using the chi‐square test for categorical variables (Fisher's exact test for 2×2 comparison) and unpaired Student's t test for continuous variables (Mann‐Whitney U test for data not normally distributed). Logistic regression analysis was carried out for factors associated with occurrence of toxicity and calculation of odds ratio with 95% confidence intervals (CIs). OS was calculated from the start of treatment to the date of last follow‐up or death. Survival curves were plotted and median OS was calculated by Kaplan‐Meier method, and group differences were compared using the log‐rank test. Factors affecting OS were assessed using the univariate and multivariate Cox proportional hazards regression analysis and calculation of hazard ratio with 95% CI. For all analyses, a value of p < .05 was taken as significant.
Results
Demographic Characteristics
Of 223 patients with SCLC diagnosed during the study period, 155 patients who were planned for irinotecan‐based chemotherapy and consented to having blood samples collected for genetic analysis were planned for enrollment. Among these, 15 patients did not receive chemotherapy and were excluded from analysis (Fig. 1).
Figure 1.
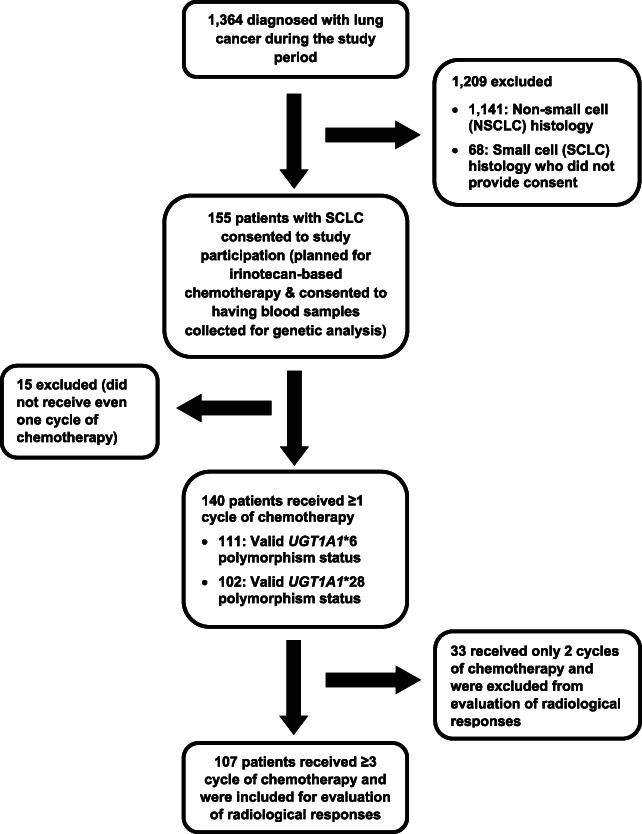
Flow of patients in the study. Abbreviations: NSCLC, non‐small cell lung cancer; SCLC, small cell lung cancer.
Of 140 patients, the majority (n = 119; 85%) were men and had advanced disease (stage IIIB, n = 65, 46.4%; stage IV, n = 66, 47.1%). Extrathoracic metastasis was seen in 43 (30.7%) Seventy‐seven patients (55%) had limited disease, whereas 63 (45%) patients had extensive disease. Distribution of Eastern Cooperative Oncology Group (ECOG) PS was ≥2 in 66 (47.1%) and <2 in 74 (52.9%).
In the context of smoking habits, 92.9% of this cohort (n = 130) were current/ex‐smokers, of whom 15 (10.7%) were still smoking at diagnosis and 94 (67.1%) had quit smoking within the last 6 months. Based on smoking index (SI), 88 (67.7%) were heavy smokers (SI ≥ 300), 14 (10.8%) were light smokers (SI ≤ 100), and the remaining 28 patients (21.5%) were moderate smokers (SI = 101–300). The majority of smokers (n = 121; 93.1%) used to smoke bidis.
Chemotherapy Details
Out of 140 patients, the majority (n = 128; 91.4%) received the day 1–only regimen. Also, 58 patients (41.4%) received thoracic radiation, and 39 patients (27.9%) received prophylactic cranial irradiation (PCI). One hundred seventeen patients received at least two cycles, and 107 received at least three cycles of chemotherapy; the latter were eligible for assessment of radiological responses. Distribution of radiological responses were 9 (8.4%) patients with complete responses (CRs), 70 (65.4%) with partial responses (PRs), 21 (19.6%) with stable disease, and 7 (6.5%) with progressive disease. Objective response rate (CR + PR) was thus 73.8%. Cumulative nongastrointestinal and nonhematological toxicities are described in supplemental online Table 2.
Frequencies and Descriptive Genotyping Data
Genotypic frequencies in case of UGT1A1*6 polymorphism could be determined for 111 patients of whom 99 patients (89.2%) were homozygous wild‐type (WT/WT), 9 (8.1%) patients were heterozygous mutant (WT/M), and 3 (2.7%) patients were homozygous mutant (M/M). Distribution of UGT1A1*28 polymorphisms was as follows: 42 (41.2%) patients were homozygous wild‐type (WT/WT), 44 (43.1%) patients were heterozygous mutant (WT/M), and 16 (15.7%) patients were homozygous mutant (M/M). The genotyping data were indeterminable and thus unavailable for rest of the cases. However, in case of other three polymorphic sites, namely, UGT1A1*27, UGT1A1*7, and UGT1A1*29, all the patients were reported to carry WT/WT genotype. As there were few cases in UGT1A1*6 WT/M group, we combined UGT1A1*6 WT/M and M/M cases for purpose of comparison with UGT1A1*6 WT/WT group. Seven patients had UGT1A1*6 WT/M‐M/M and UGT1A1*28 WT/M‐M/M simultaneously.
Relationship of UGT1A1 Polymorphisms with Clinicodemographic Data and Chemotherapy Delivery/ Tolerance
Baseline demographic characteristics were similar between WT/WT and homo/heterozygous mutant (M/M‐WT/M) groups (Table 1). The UGT1A1*6 mutant (WT/M‐M/M) group had lower irinotecan dose delivery as well as higher incidence of severe (grade ≥3) diarrhea and (any grade) mucositis compared with the WT/WT group (Table 2). Similarly, for UGT1A1*28 analysis, we combined WT/M and M/M groups into the homo/heterozygous mutant (M/M‐WT/M) group. The WT/M‐M/M group had longer duration of diarrhea and higher rates of PCI compared with the WT/WT group.
Table 1.
Genotypic distribution of patients with SCLC according to UGT1A1*28 and UGT1A1*6 polymorphisms and association with demographic variables
| Variables | Study population (n = 140), n (%) | UGT1A1*28 homozygous wild (n = 42), n (%) | UGT1A1*28 homo/ heterozygous mutant (n = 60), n (%) | p value | UGT1A1*6 homozygous wild (n = 99), n (%) | UGT1A1*6 homo/ heterozygous mutant (n = 12), n (%) | p value |
|---|---|---|---|---|---|---|---|
| Age, mean ± SD, years | 58.1 ± 9.3 | 57.5 ± 9.0 | 58.7 ± 8.9 | .519 | 58.0 ± 9.5 | 56.9 ± 10.1 | .720 |
| Gender | .992 | .104 | |||||
| Male | 119 (85.0) | 35 (83.3) | 50 (83.3) | 85 (85.9) | 8 (66.7) | ||
| Female | 21 (15.0) | 7 (16.7) | 10 (16.7) | 14 (14.1) | 4 (33.3) | ||
| Smoking status | .617 | .976 | |||||
| Nonsmoker | 10 (07.1) | 3 (07.1) | 6 (10.0) | 8 (08.1) | 1 (08.3) | ||
| Current/ex‐smoker | 130 (92.9) | 39 (92.9) | 54 (90.0) | 91(91.9) | 11 (91.7) | ||
| Quitting status | .058 | .342 | |||||
| <6 months ago | 94 (72.3) | 23 (59.0) | 44 (81.5) | .031 a | 66 (72.5) | 10 (90.9) | |
| >6 months ago | 21 (16.2) | 8 (20.5) | 5 (09.3) | 13 (14.3) | 0 (0.0) | ||
| Still smoking | 15 (11.5) | 8 (20.5) | 5 (09.3) | 12 (13.2) | 1 (09.1) | ||
| Smoking index b | .792 | .347 | |||||
| 1–100 | 14 (10.0) | 5 (11.9) | 4 (06.7) | 10 (10.1) | 3 (25.0) | ||
| 101–300 | 28 (20.0) | 7 (16.7) | 11 (18.3) | 17 (17.2) | 3 (25.0) | ||
| >300 | 88 (62.9) | 27 (64.3)0 | 39 (65.0) | 64 (64.6) | 5 (41.7) | ||
| Nonsmoker | 10 (07.1) | 3 (07.1) | 6 (10.0) | 8 (08.1) | 1 (08.3) | ||
| BMI group | .684 | .877 | |||||
| <18.5 | 46 (32.9) | 15 (35.7) | 17 (28.3) | 31 (31.3) | 3 (25.0) | ||
| 18.5–22.9 | 64 (45.7) | 19 (45.2) | 32 (53.3) | 48 (48.5) | 6 (50.0) | ||
| ≥23 | 30 (21.4) | 8 (19.1) | 11 (18.3) | 20 (20.2) | 3 (25.0) | ||
| ECOG PS group | .730 | .818 | |||||
| –1 | 74 (52.9) | 19 (45.2) | 31 (51.7) | 50 (49.5) | 6 (50.0) | ||
| 2 | 39 (27.9) | 12 (28.6) | 17 (28.3) | 31 (31.3) | 3 (25.0) | ||
| 3 | 27 (19.3) | 11 (26.2) | 12 (20.0) | 18 (18.2) | 3 (25.0) | ||
| Stage group | .403 | .600 | |||||
| I–IIIA | 9 (06.4) | 4 (09.5) | 2 (03.3) | 7 (07.1) | 0 (0.0) | ||
| IIIB | 65 (46.4) | 19 (45.2) | 27 (45.0) | 43 (43.4) | 5 (41.7) | ||
| IV | 66 (47.1) | 19 (45.2) | 31 (51.7) | 49 (49.5) | 7 (58.3) | ||
| ET metastases | .859 | .887 | |||||
| No | 97 (69.3) | 28 (66.7) | 41 (68.3) | 68 (68.7) | 8 (66.7) | ||
| Yes | 43 (30.7) | 14 (33.3) | 19 (31.7) | 31 (31.3) | 4 (33.3) | ||
| SCLC stage | .636 | .869 | |||||
| LD | 77 (55.0) | 23 (54.8) | 30 (50.0) | 52 (52.5) | 6 (50.0) | ||
| ED | 63 (45.0) | 19 (45.2) | 30 (50.0) | 47 (47.5) | 6 (50.0) |
Patients who quit smoking >6 months ago versus those who were either currently smoking at diagnosis or had quit <6 months ago.
Smoking index = number of cigarettes + bidis smoked per day × years of tobacco use.
Abbreviations: BMI, body mass index; ECOG, Eastern Cooperative Oncology Group; ED, extensive disease; ET, extrathoracic; LD, limited disease; PS, performance status; SCLC, small cell lung cancer.
Table 2.
Genotypic distribution of patients with small cell lung cancer according to UGT1A1*28 and UGT1A1*6 polymorphisms and association with chemotherapy delivery and tolerance
| Variables | UGT1A1*28 homozygous wild (n = 42) | UGT1A1*28 homo/ heterozygous mutant (n = 60) | p value | UGT1A1*6 homozygous wild (n = 99) | UGT1A1*6 homo/ heterozygous mutant (n = 12) | p value |
|---|---|---|---|---|---|---|
| Chemotherapy cycles, mean ± SD | 4.4 ± 1.9 | 4.3 ± 2.0 | .783 | 4.4 ± 2.0 | 4.0 ± 2.2 | .501 |
| Chemotherapy regimen, n (%) | .835 | .295 | ||||
| Days 1 and 8 | 4 (09.5) | 5 (08.3) | 8 (08.1) | 2 (16.7) | ||
| Day 1 | 38 (90.5) | 55 (91.7) | 91 (91.9) | 10 (83.3) | ||
| Maximum dose of platinum (as % of predicted), mean ± SD | 94.3 ± 7.0 | 94.6 ± 7.7 | .827 | 94.2 ± 7.9 | 92.8 ± 5.6 | .457 |
| Maximum dose of platinum, n (%) | .554 | |||||
| ≥95% of predicted | 23 (56.1) | 34 (56.7) | .766 | 54 (54.6) | 5 (41.7) | |
| ≥90% to <95% of predicted | 11 (26.8) | 13 (21.7) | 24 (24.2) | 3 (25.0) | ||
| <90% of predicted | 7 (17.1) | 13 (21.7) | 20 (20.2) | 4 (33.3) | ||
| Maximum dose of irinotecan (as % of predicted), mean ± SD | 95.1 ± 6.9 | 93.4 ± 7.6 | .234 | 94.0 ± 7.8 | 89.4 ± 9.1 | .041 |
| Maximum dose of irinotecan, n (%) | .620 | .026 | ||||
| ≥95% of predicted | 26 (63.4) | 33 (55.0) | 59 (59.6) | 3 (25.0) | ||
| ≥90% and <95% of predicted | 9 (22.0) | 14 (23.3) | 18 (18.2) | 6 (50.0) | ||
| <90% of predicted | 6 (14.6) | 13 (21.7) | 21 (21.2) | 3 (25.0) | ||
| Minimum dose of platinum (as % of predicted), mean ± SD | 86.2 ± 9.7 | 84.3 ± 10.2 | .396 | 84.8 ± 10.4 | 85.4 ± 05.8 | .809 |
| Minimum dose of irinotecan (as % of predicted), mean ± SD | 86.0 ± 9.2 | 82.2 ± 12.3 | .110 | 83.6 ± 11.5 | 81.9 ± 11.1 | .682 |
| Vomiting, n (%) | ||||||
| Any grade | 22 (52.4) | 31 (51.7) | .943 | 44 (44.4) | 8 (66.7) | .221 |
| Severe (grade ≥3) | 8 (19.0) | 5 (08.3) | .137 | 11 (11.1) | 2 (16.7) | .631 |
| Vomiting duration (days), mean ± SD | 6.1 ± 4.9 | 4.0 ± 3.4 | .103 | 4.9 ± 4.3 | 3.7 ± 3.1 | .405 |
| Diarrhea, n (%) | ||||||
| Any grade | 19 (45.2) | 35 (58.3) | .229 | 51 (51.5) | 7 (58.3) | .764 |
| Severe (grade ≥3) | 6 (14.3) | 17 (28.3) | .148 | 17 (17.2) | 5 (41.7) | .044 |
| Diarrhea duration (days), mean ± SD | 3.8 ± 2.2 | 6.2 ± 4.8 | .022 | 4.9 ± 3.6 | 4.5 ± 3.8 | .818 |
| Constipation (any grade), n (%) | 10 (23.8) | 19 (31.7) | .504 | 27 (27.3) | 5 (41.7) | .322 |
| Constipation duration (days), mean ± SD | 7.6 ± 7.0 | 5.0 ± 4.2 | .291 | 5.3 ± 4.4 | 8.2 ± 6.6 | .386 |
| Mucositis (any grade), n (%) | 4 (9.5) | 7 (11.7) | .731 | 8 (8.1) | 5 (41.7) | .005 |
| Mucositis duration (days), mean ± SD | 8.0 ± 5.7 | 6.4 ± 6.4 | .685 | 6.8 ± 5.8 | 6.8 ± 5.9 | .988 |
| Anemia, n (%) | ||||||
| Any grade | 33 (78.6) | 49 (81.7) | .801 | 79 (79.8) | 11 (91.7) | .457 |
| Severe (grade ≥3) | 3 (7.1) | 4 (6.7) | .925 | 12 (12.1) | 0 (0.0) | .356 |
| Leukopenia, n (%) | ||||||
| Any grade | 22 (52.4) | 30 (50.0) | .843 | 47 (47.5) | 7 (58.3) | .550 |
| Severe (grade ≥3) | 2 (4.8) | 2 (3.3) | .715 | 4 (4.0) | 1 (8.3) | .442 |
| Neutropenia, n (%) | ||||||
| Any grade | 20 (47.6) | 27 (45.0) | .842 | 40 (40.4) | 8 (66.7) | .122 |
| Severe (grade ≥3) | 6 (14.3) | 10 (16.7) | .790 | 13 (13.1) | 3 (25.0) | .376 |
| Thrombocytopenia, n (%) | ||||||
| Any grade | 11 (26.2) | 21 (35.0) | .391 | 30 (30.3) | 6 (50.0) | .198 |
| Severe (grade ≥3) | 0 (0.0) | 2 (3.3) | .511 | 1 (1.0) | 1 (8.3) | .205 |
| Thoracic radiation, n (%) | 13 (31.0) | 25 (41.7) | .271 | 39 (39.4) | 5 (41.7) | .879 |
| PCI, n (%) | 5 (11.9) | 18 (30.0) | .031 | 24 (24.2) | 3 (25.0) | .954 |
Abbreviation: PCI, prophylactic cranial irradiation.
Logistic Regression Analysis for Association Between UGT1A1 Polymorphisms and Diarrhea/Mucositis
Furthermore, logistic regression analysis was done to assess the relationship of UGT1A1*6 polymorphism with severe diarrhea (Table 3) and mucositis (Table 4). Patients with WT/M‐M/M status had 3.7 and 4.8 times higher risk of severe diarrhea than those with WT/WT status on univariate and multivariate analysis, respectively. UGT1A1*6 WT/M‐M/M status was associated with mucositis, which was statistically significant on both univariate and multivariate analysis.
Table 3.
Logistic regression analyses for factors associated with severe (grade 3/4) diarrhea
| Variable | Univariate analysis | Multivariate analysis | ||
|---|---|---|---|---|
| Odds ratio (95% CI) | p value | Odds ratio (95% CI) | p value | |
| Age a | 1.07 (1.01–1.13) | .020 | 1.07 (1.00–1.14) | .036 |
| Gender | ||||
| Male | 1 | |||
| Female | 0.43 (0.09–2.02) | .285 | ||
| Body mass index a | 1.06 (0.93–1.21) | .365 | ||
| ECOG PS | ||||
| ECOG 0–1 | 1 | |||
| ECOG 2 | 0.38 (0.10–1.43) | .152 | ||
| ECOG ≥3 | 1.76 (0.59–5.21) | .308 | ||
| Extrathoracic metastasis | ||||
| No | 1 | |||
| Yes | 0.41 (0.13–1.30) | .130 | ||
| TNM stage | ||||
| I–IIIB | 1 | |||
| IV | 1.04 (0.42–2.60) | .930 | ||
| LD‐ED stage | ||||
| LD | 1 | |||
| ED | 0.95 (0.38–2.39) | .917 | ||
| Cycles a | 1.37 (0.91–2.07) | .133 | ||
| Maximum % dose of irinotecan group | ||||
| ≥95% | 1 | |||
| ≥90% but <95% | 1.64 (0.53–5.03) | .390 | ||
| <90% | 1.83 (0.59–5.68) | .296 | ||
| Maximum % dose of irinotecan a | 0.97 (0.92–1.02) | .258 | ||
| Maximum % dose of platinum group | ||||
| ≥95% | 1 | |||
| ≥90% but <95% | 1.26 (0.39–4.09) | .700 | ||
| <90% | 3.87 (1.26–11.83) | .018 | ||
| Maximum % dose of platinum a | 0.94 (0.88–1.01) | .078 | 0.95 (0.88–1.02) | .128 |
| UGT1A1*6 group | ||||
| Homozygous wild type | 1 | |||
| Homo/heterozygous mutant | 3.68 (0.88–15.35) | .074 | 4.90 (1.00–23.96) | .050 |
| UGT1A1*28 group | ||||
| Homozygous wild type | 1 | |||
| Homo/heterozygous mutant | 2.17 (0.69–6.77) | .184 | 1.09 (0.76–1.58) | .631 |
Used as a continuous variable.
Abbreviations: CI, confidence interval; ECOG, Eastern Cooperative Oncology Group; ED, extensive disease; LD, limited disease; PS, performance status.
Table 4.
Logistic regression analyses for factors associated with mucositis
| Variable | Univariate analysis | Multivariate analysis | ||
|---|---|---|---|---|
| Odds ratio (95% CI) | p value | Odds ratio (95% CI) | p value | |
| Age a | 0.94 (0.89–1.00) | .051 | 0.97 (0.90–1.03) | .311 |
| Gender | ||||
| Male | 1 | |||
| Female | 3.65 (1.15–11.56) | .028 | 1.80 (0.41–7.94) | .438 |
| Body mass index a | 0.88 (0.74–1.05) | .149 | ||
| Karnofsky PS | ||||
| KPS 90–100 | 1 | |||
| KPS 80 | 1.47 (0.36–5.97) | .594 | ||
| KPS ≤70 | 1.84 (0.51–6.66) | .354 | ||
| ECOG PS | ||||
| ECOG 0–1 | 1 | |||
| ECOG 2 | 1.40 (0.41–4.82) | .591 | ||
| ECOG ≥3 | 2.31 (0.65–8.22) | .196 | ||
| Extrathoracic metastasis | ||||
| No | 1 | |||
| Yes | 1.27 (0.43–3.76) | .662 | ||
| TNM stage | ||||
| I–IIIB | 1 | |||
| IV | 1.75 (0.62–4.96) | .295 | ||
| LD‐ED stage | ||||
| LD | 1 | |||
| ED | 1.49 (0.53–4.18) | .448 | ||
| Smoking status | ||||
| Nonsmoker | ||||
| Current/ex‐smoker | 1.58 (0.19–13.36) | .673 | ||
| Cycles a | 1.22 (0.79–1.88) | .362 | ||
| Maximum % dose of irinotecan group | ||||
| ≥95% | 1 | |||
| ≥90% but <95% | 1.45 (0.44–4.76) | .540 | ||
| <90% | 0.55 (0.11–2.73) | .467 | ||
| Maximum % dose of irinotecan a | 0.98 (0.92–1.04) | .552 | ||
| Maximum % dose of platinum group | ||||
| ≥95% | 1 | |||
| ≥90% but <95% | 0.62 (0.16–2.42) | .494 | ||
| <90% | 0.91 (0.23–3.66) | .899 | ||
| Maximum % dose of platinum a | 1.00 (0.93–1.08) | .977 | ||
| UGT1A1*6 group | ||||
| Homozygous wild type | 1 | |||
| Homo/heterozygous mutant | 11.88 (2.64–53.39) | .001 | 10.36 (2.22–48.24) | .001 |
| UGT1A1*28 group | ||||
| Homozygous wild type | 1 | |||
| Homo/heterozygous mutant | 1.29 (0.35–4.80) | .702 | ||
Used as a continuous variable.
Abbreviations: CI, confidence interval; ECOG, Eastern Cooperative Oncology Group; ED, extensive disease; KPS, Karnofsky performance status; LD, limited disease; PS, performance status.
Objective Radiological Responses and UGT1A1 Polymorphisms
There was no difference in objective response rates for either UGT1A1*6 (CR + PR = 75.0% for WT/WT vs. 87.5% for WT/M‐M/M; p = .773) or UGT1A1*28 (CR + PR = 67.6% for WT/WT vs. 77.8% for WT/M‐M/M; p = .451) polymorphism status.
OS and Association with UGT1A1 Polymorphisms
Median OS was 276 days (95% CI, 213–339) (equivalent to median 9.2 months; 95% CI, 7.1–11.3). The UGT1A1*28 WT/M‐M/M group had significantly better OS (Fig. 2) compared with the WT/WT group (median 320 days vs. 216 days [10.7 vs. 7.2 months]; p = .047). The UGT1A1*6 WT/M‐M/M group had similar OS as the WT/WT group (median 305 days vs. 267 days [10.2 vs. 8.9 months]; p = .99). Table 5 summarizes the univariate and multivariate Cox hazards regression analysis carried out to identify various clinical parameters and UGT1A1 polymorphism status that were associated with OS. On univariate analysis, age, female gender, moderate to heavy smokers (SI ≥ 100), occurrence of neutropenia (any grade) or leukopenia (any grade) as well as UGT1A1*28 mutant status (WT/M‐M/M), objective radiological response (partial/complete response), receipt of thoracic radiation, and receipt of PCI were all associated with OS. Two multivariate models were used, one in which only baseline demographic variables found significant (p < .010) on univariate analyses were included and the other in which treatment‐related variables were also included. In multivariate analyses, worse OS was independently associated with age, lack of objective radiological response, and moderate/heavy smoking, whereas better OS was independently associated with UGT1A1*28 WT/M‐M/M status.
Figure 2.

Probability of overall survival (OS) for patients grouped on the basis of UGT1A1*28 polymorphism status (Kaplan‐Meier analysis). UGT1A1*28 homo/heterozygous mutant patients had better OS (320 days; 95% confidence interval [CI], 203–437) than homozygous wild‐type group (216 days; 95% CI, 140–292; log‐rank p = .047).
Table 5.
Cox's proportional hazard analyses for factors affecting overall survival
| Variable | Univariate analysis | Multivariate analysis (model 1) | Multivariate analysis (model 2) | |||
|---|---|---|---|---|---|---|
| Hazard ratio (95% CI) | p value | Hazard ratio (95% CI) | p value | Hazard ratio (95% CI) | p value | |
| Age a | 1.04 (1.02–1.07) | <.001 | 1.04 (1.01–1.07) | .005 | 1.05 (1.02–1.08) | .001 |
| Gender | ||||||
| Male | 1 | 1 | ||||
| Female | 0.50 (0.28–0.87) | .015 | 1.98 (0.60–6.53) | .259 | ||
| Body mass index a | 1.01 (0.95–1.07) | .795 | ||||
| Smoking index | ||||||
| ≤100 | 1 | 1 | ||||
| >100 | 2.04 (1.17–3.56) | .012 | 4.70 (1.36–16.25) | .015 | ||
| TNM stage | ||||||
| I–IIIB | 1 | |||||
| IV | 0.91 (0.63–1.33) | .624 | ||||
| LD‐ED stage | ||||||
| LD | 1 | |||||
| ED | 0.95 (0.65–1.39) | .798 | ||||
| Extrathoracic metastasis | ||||||
| No | 1 | |||||
| Yes | 1.10 (0.74–1.64) | .641 | ||||
| ECOG PS | ||||||
| ECOG 0–1 | 1 | |||||
| ECOG ≥2 | 0.90 (0.62–1.30) | .565 | ||||
| UGT1A1*6 group | ||||||
| Homo‐WT | 1 | |||||
| Homo/hetero‐M | 1.01 (0.53–1.89) | .995 | ||||
| UGT1A1*28 group | ||||||
| Homo‐WT | 1 | 1 | ||||
| Homo/hetero‐M | 0.63 (0.39–0.99) | .049 | 0.53 (0.32–0.86) | .010 | 0.35 (0.19–0.64) | .001 |
| Maximum % dose of irinotecan a | 0.98 (0.96–1.01) | .181 | 0.97 (0.94–1.01) | .117 | ||
| Maximum % dose of platinum a | 0.98 (0.96–1.01) | .212 | 0.99 (0.95–1.02) | .434 | ||
| Leukopenia | ||||||
| None | 1 | |||||
| Any grade | 0.52 (0.35–0.76) | .001 | ||||
| Neutropenia | ||||||
| None | 1 | 1 | ||||
| Any grade | 0.54 (0.37–0.80) | .002 | 0.60 (0.35–1.02) | .060 | ||
| Thoracic radiation | ||||||
| Yes | 1 | |||||
| No | 2.16 (1.46–3.18) | <.001 | ||||
| PCI | ||||||
| Yes | 1 | |||||
| No | 1.95 (1.27–3.01) | .002 | ||||
| Radiological response | ||||||
| Yes (CR + PR) | 1 | 1 | ||||
| No (SD + PD) | 1.81 (1.13–2.89) | .014 | 2.08 (1.08–4.01) | .028 | ||
Used as a continuous variable.
Abbreviations: CI, confidence interval; CR, complete response; ECOG, Eastern Cooperative Oncology Group; ED, extensive disease; Homo/hetero‐M, homozygous or heterozygous mutant; Homo‐WT, homozygous wild type; LD, limited disease; PCI, prophylactic cranial irradiation; PD, progressive disease; PR, partial response; PS, performance status; SD, stable disease.
Discussion
This was a prospective study aimed at assessing the association between UGT1A1 polymorphisms and clinical outcomes with irinotecan‐based chemotherapy for SCLC in a North Indian cohort. This study found UGT1A1*6 and UGT1A1*28 polymorphisms in 10.8% and 53.8% of patients, respectively, with the majority in both instances being heterozygous mutant. Presence of UGT1A1*6 mutant (WT/M‐M/M) status was independently associated with occurrence of severe diarrhea as well as mucositis, and consequently, the maximum dose of irinotecan that could be delivered to the mutant group was significantly lower than the WT/WT group. UGT1A1*28 mutant (WT/M‐M/M) status, on the other hand, was independently associated with better survival (OS). Thus UGT1A1*28 mutant status was a positive prognostic biomarker for OS, whereas UGT1A1*6 mutant status was a (negative) predictive biomarker for severe diarrhea and mucositis in this SCLC cohort treated with irinotecan‐platinum chemotherapy.
The reason for using irinotecan‐platinum as first‐line treatment of SCLC has been explained in detail in our previous publication related to management of lung cancer in resource‐constrained settings [10]. This was largely related to the fact that patients who were living in remote geographical regions and undergoing treatment at our center typically made single‐day visits for chemotherapy, whereas etoposide administration is typically done as a continuous 3‐day regimen, which requires patients to stay overnight. This is also the reason why the majority of patients received the day 1–only regimen (single visit vs. two visits needed during the 3‐week cycle period for the days 1 and 8 regimen). However, irrespective of the polymorphism status, in all groups, the median number of cycles was at least four and the (mean) maximum and minimum doses of platinum were approximately 95% and 85%, respectively (as percentage of predicted). Even for the UGT1A1*6 WT/M‐M/M group, the (mean) maximum and minimum doses of irinotecan were approximately 90% and 82%, respectively (despite dose reductions).
It is worthwhile to mention here that the demographic profile of patients with SCLC in this study (including mean age, gender, and body mass index distribution) was consistent with the general epidemiological profile reported by us in the recent past [1, 15, 16]. However, as compared with the general lung cancer population at our center of which SCLC comprises around 20% of all cases, the current study cohort being limited to only patients with SCLC, was dominated by current/ex‐smokers and by moderate/heavy smokers (SI > 100). Also, patients with ECOG PS ≥2 (typically excluded from randomized trials) constituted a substantial percentage of our cohort (in line with what is typically seen in our clinic in a real‐world setting) [17].
Putting the results of our study in the context of previously published literature on UGT1A1 polymorphisms and irinotecan‐based chemotherapy for SCLC, a Korean study (n = 81) by Han et al. [18] found UGT1A1*6 polymorphisms to be associated with severe neutropenia, severe diarrhea, and shorter progression‐free survival and OS. Xiao et al. in a Chinese cohort (n = 67) of patients with extensive SCLC reported association of severe neutropenia and diarrhea with UGT1A1*6 polymorphisms and of severe thrombocytopenia with UGT1A1*28 polymorphisms [19]. In addition to SCLC, these polymorphisms have also been assessed in non‐small cell lung cancer. Association of severe neutropenia has been reported with UGT1A1*28 polymorphisms in a North American study (n = 42) by Pillot et al. [20] and with UGT1A1*6 polymorphisms in a Korean study (n = 107) by Han et al. [21]. Surprisingly, UGT1A1*6 and UGT1A1*28 homozygous polymorphism status was associated with severe neutropenia in Japanese cohort (n = 55) of patients with SCLC treated with etoposide‐platinum (and not irinotecan) [22].
The strengths of our study include a prospective evaluation of UGT1A1 polymorphism status in a South Asian cohort of patients with SCLC treated with irinotecan‐platinum chemotherapy and having sample size comparable to or larger than most studies reported from other parts of Asia (Japan, China, and Korea). We believe this is the first study from this region to assess this genetic polymorphism in patients with lung cancer. Demonstration of clear association of UGT1A1*28 mutant status with better OS and of UGT1A1*6 mutant status with severe diarrhea and mucositis in this SCLC cohort indicates that polymorphism status may indeed play both prognostic and predictive roles. However, we did not find any correlation of UGT1A1 polymorphism status and occurrence of any cytopenia, including severe neutropenia. There are several possible explanations for this. First, there are no previous data from an Indian/South Asian population regarding UGT1A1 polymorphisms and racial differences in context of polymorphisms, and consequently their association with different toxicities may vary significantly. Second, dose intensity of irinotecan and cisplatin used in majority of patients in the current study of 100 mg/m2 and 60 mg/m2 each on day 1 of a 3‐week cycle (corresponding to 33.3 mg/m2 per week and 20 mg/m2 per week) was significantly less than that used in previous studies from other parts of the world.
The important question is whether UGT1A1 polymorphism status should be checked routinely prior to treatment with irinotecan‐based chemotherapy. This is especially relevant to resource‐constrained settings like ours where such testing may not be easily available. Harada et al. retrospectively studied 136 Japanese patients with lung cancer treated with irinotecan‐based chemotherapy, half of whom underwent UGT1A1 polymorphism testing prior to treatment initiation [23]. They found that such testing did not reduce the incidence of AEs and stressed that early identification and treatment of AEs was perhaps more important. Occurrence of severe AEs, even if UGT1A1 polymorphisms are present, is also possibly linked to the dose of irinotecan used, as was reported in a Chinese study by Bai et al. [24]. The association of UGT1A1*6 polymorphisms with severe diarrhea was evident in only patients with colorectal cancer but not in patients with lung cancer who received a lower irinotecan dose than the former. Konaka et al., based on a Japanese study (n = 31), suggested that among patients with UGT1A1 polymorphisms, a dose reduction of approximately 20% could lead to chemotherapy administration with lesser AEs but similar efficacy [25].
The limitations of our study include inability to assess polymorphism status in all enrolled patients with UGT1A1*6 and UGT1A1*28 status being finally determined in approximately 80% and 75% of all enrolled patients. In most cases, genotyping failure was attributable to insufficient sample and consequently issues related to DNA extraction. In some cases, quality of DNA available was insufficient to conduct genotyping analysis. As per the study plan, blood sample was drawn only once (prior to chemotherapy initiation), and perhaps having kept a provision, in the study design, of repeat sampling for the patients in whom the initial attempt at genomic analysis was indeterminate may have helped reduced the overall frequency of indeterminate results. Another contributing factor to this could have been the fact that we employed techniques such as RFLP and SSCP, which might be less sensitive compared with real‐time PCR and sequencing methods. However, the former techniques are less expensive and therefore have greater applicability in resource‐constrained settings like ours. We used very stringent methods for optimizing the SSCP techniques, and the genotyping results were confirmed by re‐genotyping. All the results (100%) of the second genotyping were in agreement with the ones obtained previously. The relatively higher frequency of UGT1A1*28 polymorphism, as seen in our study, is consistent with previous observations from a Singapore‐based study wherein it was statistically more common in Indian ethnicity patients compared with East Asian (Chinese) or Malay ethnicities [26]. Another limitation to be pointed out here is that patients underwent repeat imaging for response assessment after a minimum of three cycles had been administered (as per the protocol of our Lung Cancer Clinic), which in this case was when 107 of 140 patients had enrolled. Consequently, we cannot rule out the possibility of early progression being one of the reasons for the 33 patients receiving fewer than three cycles. Finally, results of this study cannot be generalized to patients with SCLC who are preferentially treated with etoposide‐based regimens (that is particularly important for limited stage in which concurrent chemoradiation is given). Had the current study been conducted in the form of a randomized trial (wherein the control arm had received etoposide‐platinum), the prognostic and predictive value of UGT1A1 polymorphisms may have been substantiated more accurately.
Conclusion
This prospective study demonstrates that UGT1A1 polymorphisms (especially UGT1A1*6 and UGT1A1*28) possibly influence clinical outcomes (increased gastrointestinal toxicity and improved overall survival, respectively) among North Indian patients with SCLC receiving irinotecan‐based chemotherapy. The results of our study and other previously published studies warrant conduct of a prospective randomized trial in which patients with UGT1A1 polymorphisms (especially UGT1A1*6) detected at baseline are randomized to receive high‐ and low‐dose irinotecan with the aim of assessing whether reduced dose regimens can be associated with similar efficacy while reducing the incidence of AEs. Conduct of a randomized trial preferably with a comprehensive genomic analysis could also help to validate the prognostic role of UGT1A1*28 polymorphism status on OS and rule out other genomic confounders.
Author Contributions
Conception/design: Siddharth Sharma, Digambar Behera, Navneet Singh
Provision of study material or patients: Siddharth Sharma, Digambar Behera, Navneet Singh
Collection and/or assembly of data: Ankan Bandyopadhyay, Siddharth Sharma, Navneet Singh
Data analysis and interpretation: Siddharth Sharma, Navneet Singh
Manuscript writing: Ankan Bandyopadhyay, Siddharth Sharma, Digambar Behera, Navneet Singh
Final approval of manuscript: Ankan Bandyopadhyay, Siddharth Sharma, Digambar Behera, Navneet Singh
Disclosures
The authors indicated no financial relationships.
Supporting information
See http://www.TheOncologist.com for supplemental material available online.
Table S1: Genetic variations in UGT1A1 gene
Table S2: Cumulative non‐hematological & non‐gastrointestinal toxicity profile of the study population
Acknowledgments
This work was supported in part by an ad hoc research grant from the Indian Council of Medical Research, New Delhi, India (grant no. 5/13/126/2011/NCD‐III).
No part of this article may be reproduced, stored, or transmitted in any form or for any means without the prior permission in writing from the copyright holder. For information on purchasing reprints contact commercialreprints@wiley.com. For permission information contact permissions@wiley.com.
Disclosures of potential conflicts of interest may be found at the end of this article.
References
- 1. Singh N, Aggarwal AN, Gupta D et al. Quantified smoking status and non‐small cell lung cancer stage at presentation: Analysis of a North Indian cohort and a systematic review of literature. J Thorac Dis 2012;4:474–484. [DOI] [PMC free article] [PubMed] [Google Scholar]
- 2. Iyer L, King CD, Whitington PF et al. Genetic predisposition to the metabolism of irinotecan (CPT‐11). Role of uridine diphosphate glucuronosyltransferase isoform 1A1 in the glucuronidation of its active metabolite (SN‐38) in human liver microsomes. J Clin Invest 1998;101:847–854. [DOI] [PMC free article] [PubMed] [Google Scholar]
- 3. Ando Y, Saka H, Ando M et al. Polymorphisms of UDP‐glucuronosyltransferase gene and irinotecan toxicity: A pharmacogenetic analysis. Cancer Res 2000;60:6921–6926. [PubMed] [Google Scholar]
- 4. Sai K, Saeki M, Saito Y et al. UGT1A1 haplotypes associated with reduced glucuronidation and increased serum bilirubin in irinotecan‐administered Japanese patients with cancer. Clin Pharmacol Ther 2004;75:501–515. [DOI] [PubMed] [Google Scholar]
- 5. Kitagawa C, Ando M, Ando Y et al. Genetic polymorphism in the phenobarbital‐responsive enhancer module of the UDP‐glucuronosyltransferase 1A1 gene and irinotecan toxicity. Pharmacogenet Genomics 2005;15:35–41. [DOI] [PubMed] [Google Scholar]
- 6. Yamamoto N, Takahashi T, Kunikane H et al. Phase I/II pharmacokinetic and pharmacogenomic study of UGT1A1 polymorphism in elderly patients with advanced non‐small cell lung cancer treated with irinotecan. Clin Pharmacol Ther 2009;85:149–154. [DOI] [PubMed] [Google Scholar]
- 7. Palomaki GE, Bradley LA, Douglas MP et al. Can UGT1A1 genotyping reduce morbidity and mortality in patients with metastatic colorectal cancer treated with irinotecan? An evidence‐based review. Genet Med 2009;11:21–34. [DOI] [PMC free article] [PubMed] [Google Scholar]
- 8. Araki K, Fujita K, Ando Y et al. Pharmacogenetic impact of polymorphisms in the coding region of the UGT1A1 gene on SN‐38 glucuronidation in Japanese patients with cancer. Cancer Sci 2006;97:1255–1259. [DOI] [PMC free article] [PubMed] [Google Scholar]
- 9. Hoskins JM, Marcuello E, Altes A et al. Irinotecan pharmacogenetics: Influence of pharmacodynamic genes. Clin Cancer Res 2008;14:1788–1796. [DOI] [PubMed] [Google Scholar]
- 10. Singh N, Aggarwal AN, Behera D. Management of advanced lung cancer in resource‐constrained settings: A perspective from India. Expert Rev Anticancer Ther 2012;12:1479–1495. [DOI] [PubMed] [Google Scholar]
- 11. Singh N, Mootha VK, Madan K et al. Tumor cavitation among lung cancer patients receiving first‐line chemotherapy at a tertiary care centre in India: Association with histology and overall survival. Med Oncol 2013;30:602.23673987 [Google Scholar]
- 12. Singh N, Singh PS, Aggarwal AN et al. Comorbidity assessment using Charlson comorbidity index and simplified comorbidity score and its association with clinical outcomes during first‐line chemotherapy for lung cancer. Clin Lung Cancer 2016;17:205–213.e201. [DOI] [PubMed] [Google Scholar]
- 13. Yenge LB, Behera D, Garg M et al. Comparison of symptom score and bronchoscopy‐based assessment with conventional computed tomography‐based assessment of response to chemotherapy in lung cancer. J Glob Oncol 2017;3:370–379. [DOI] [PMC free article] [PubMed] [Google Scholar]
- 14. Muthu V, Mylliemngap B, Prasad KT et al. Adverse effects observed in lung cancer patients undergoing first‐line chemotherapy and effectiveness of supportive care drugs in a resource‐limited setting. Lung India 2019;36:32–37. [DOI] [PMC free article] [PubMed] [Google Scholar]
- 15. Singh N, Aggarwal AN, Gupta D et al. Unchanging clinico‐epidemiological profile of lung cancer in north India over three decades. Cancer Epidemiol 2010;34:101–104. [DOI] [PubMed] [Google Scholar]
- 16. Kaur H, Sehgal IS, Bal A et al. Evolving epidemiology of lung cancer in India: Reducing non‐small cell lung cancer‐not otherwise specified and quantifying tobacco smoke exposure are the key. Indian J Cancer 2017;54:285–290. [DOI] [PubMed] [Google Scholar]
- 17. Prasad KT, Kaur H, Muthu V et al. Interconversion of two commonly used performance tools: An analysis of 5844 paired assessments in 1501 lung cancer patients. World J Clin Oncol 2018;9:140–147. [DOI] [PMC free article] [PubMed] [Google Scholar]
- 18. Han JY, Lim HS, Shin ES et al. Comprehensive analysis of UGT1A polymorphisms predictive for pharmacokinetics and treatment outcome in patients with non‐small‐cell lung cancer treated with irinotecan and cisplatin. J Clin Oncol 2006;24:2237–2244. [DOI] [PubMed] [Google Scholar]
- 19. Xiao XG, Xia S, Zou M et al. The relationship between UGT1A1 gene polymorphism and irinotecan effect on extensive‐stage small‐cell lung cancer. Onco Targets Ther 2015;8:3575–3583. [DOI] [PMC free article] [PubMed] [Google Scholar]
- 20. Pillot GA, Read WL, Hennenfent KL et al. A phase II study of irinotecan and carboplatin in advanced non‐small cell lung cancer with pharmacogenomic analysis: Final report. J Thorac Oncol 2006;1:972–978. [PubMed] [Google Scholar]
- 21. Han JY, Lim HS, Park YH et al. Integrated pharmacogenetic prediction of irinotecan pharmacokinetics and toxicity in patients with advanced non‐small cell lung cancer. Lung Cancer 2009;63:115–120. [DOI] [PubMed] [Google Scholar]
- 22. Negoro Y, Yano R, Yoshimura M et al. Influence of UGT1A1 polymorphism on etoposide plus platinum‐induced neutropenia in Japanese patients with small‐cell lung cancer. Int J Clin Oncol 2019;24:256–261. [DOI] [PubMed] [Google Scholar]
- 23. Harada T, Saito H, Karino F et al. Clinical usefulness of testing for UDP glucuronosyltransferase 1 family, polypeptide A1 polymorphism prior to the initiation of irinotecan‐based chemotherapy. Mol Clin Oncol 2014;2:737–743. [DOI] [PMC free article] [PubMed] [Google Scholar]
- 24. Bai Y, Wu HW, Ma X et al. Relationship between UGT1A1*6/*28 gene polymorphisms and the efficacy and toxicity of irinotecan‐based chemotherapy. Onco Targets Ther 2017;10:3071–3081. [DOI] [PMC free article] [PubMed] [Google Scholar]
- 25. Konaka K, Sakurada T, Saito T et al. Study on the optimal dose of irinotecan for patients with heterozygous uridine diphosphate‐glucuronosyltransferase 1A1 (UGT1A1). Biol Pharm Bull 2019;42:1839–1845. [DOI] [PubMed] [Google Scholar]
- 26. Balram C, Sabapathy K, Fei G et al. Genetic polymorphisms of UDP‐glucuronosyltransferase in Asians: UGT1A1* 28 is a common allele in Indians. Pharmacogenetics 2002;12:81–83. [DOI] [PubMed] [Google Scholar]
Associated Data
This section collects any data citations, data availability statements, or supplementary materials included in this article.
Supplementary Materials
See http://www.TheOncologist.com for supplemental material available online.
Table S1: Genetic variations in UGT1A1 gene
Table S2: Cumulative non‐hematological & non‐gastrointestinal toxicity profile of the study population