

Abstract
Background
Clinical outcomes of patients with glioma are still poor, even after standard treatments, including surgery combined with radiotherapy and chemotherapy. New therapeutic strategies and targets for glioma are urgently needed. Plasminogen activator urokinase receptor (PLAUR), a highly glycosylated integral membrane protein, is reported to modulate plasminogen activation and extracellular matrix degradation in many malignant cancers, but its role in gliomas remains unclear.
Methods
Glioma samples with mRNA sequencing data and clinical information from the Chinese Glioma Genome Atlas (n = 310) data set and The Cancer Genome Atlas (n = 611) data set were collected for this study. Analyses using Kaplan‐Meier plots, time‐dependent receiver operating characteristic curves, Cox regression, and nomograms were conducted to evaluate the prognostic performance of PLAUR expression. Analyses using Metascape, ESTIMATE, EPIC, and immunohistochemical staining were performed to reveal the potential biological mechanism. The statistical analysis and graphical work were completed using SPSS, R language, and GraphPad Prism.
Results
PLAUR was highly expressed in phenotypes associated with glioma malignancy and could serve as an independent prognostic indicator. Functional analysis revealed the correlation between PLAUR and immune response. Further studies found that samples with higher PLAUR expression were infiltrated with fewer CD8 T cells and many more M2 macrophages. Strong positive correlation was demonstrated between PLAUR expression and some immunosuppressive markers, including immune checkpoints and cytokines. These findings were also confirmed in patient samples.
Conclusion
Our results elucidated the clinical significance and immunosuppressive effect of PLAUR in gliomas, which might provide some clues in glioma immunotherapy.
Implications for Practice
Although the efficacy of immunotherapy has been verified in other tumors, its application in glioma is impeded because of the unique microenvironment. Tumor‐associated macrophages, which are particularly abundant in a glioma mass, contribute much to the immunosuppressive microenvironment and offer new opportunities in glioma immunotherapy. The results of this study identified plasminogen activator urokinase receptor (PLAUR) expression as a potential marker to predict the infiltration of macrophages and the status of immune microenvironment in patients with glioma, suggesting that treatment decisions could be based on PLAUR level when administering immunotherapeutics. The soluble PLAUR in blood and other body fluids would make this approach easy to implement in the clinic.
Keywords: Plasminogen activator urokinase receptor, Glioma, Prognosis, Immune response, Immunosuppressive phenotype
Short abstract
New therapeutic strategies and targets for glioma are urgently needed. This study investigated PLAUR expression and its role in glioma prognosis, focusing on the clinical, molecular, and immunological characteristics of PLAUR to provide novel insights into glioma treatment.
Introduction
Glioma is the most prevalent primary central nervous system tumor and is notorious for its malignancy and unfavorable prognosis [1, 2]. Despite standard treatment, including surgery combined with radiotherapy and chemotherapy, the most aggressive type of glioma remains a leading cause of cancer death, with a median survival time of 14.4 months and a 5‐year survival rate of 10% [3, 4]. The World Health Organization (WHO) 2016 classification of glioma affirms the importance of molecular diagnosis and also stimulates research on genetic aberrations [5]. Several targeted therapies and approaches have been tested in clinical trials, such as the platelet‐derived growth factor receptor inhibitor and the IDH1 inhibitor [5, 6]. Noncancerous cells that are recruited to the tumor microenvironment are drawing more and more attention for their contributory functions to malignancy [7, 8]. In the glioma microenvironment, noncancerous cells are composed of endothelial cells, infiltrating and resident immune cells, and other glial cells. Immune cells, especially macrophages, are especially of concern because macrophages constitute 30% of the glioma mass [9, 10]. Tumor‐associated macrophages (TAMs), including peripheral originated macrophages and resident microglia, play a prominent role in glioma invasion. For example, TAMs secreting transforming growth factor β (TGF‐β) induce the expression of matrix metalloproteinases‐2 (MMP‐2) and suppress the expression of tissue inhibitor of metalloproteinases‐2 [11, 12]. Glioma‐derived versican induces expression of membrane type 1 matrix metalloprotease in microglia and promotes tumor expansion [13]. The invasiveness of glioma stem‐like cells can also be enhanced by TGF‐β, which increases the production of MMP‐9 in these stem cells [14]. In addition, the release of interleukin‐10 (IL‐10) has been reported to promote glioma growth and invasion [15]. Besides the effect on glioma invasiveness, TAMs also suppress antitumoral immune response in glioma microenvironment [16, 17]. In summary, the importance of TAMs is being realized, and they deserve more study.
The gene plasminogen activator urokinase receptor (PLAUR) encodes a glycosyl‐phosphatidylinositol–anchored membrane protein named urokinase plasminogen activator receptor [18]. The urokinase‐type plasminogen activation system plays a key role in tissue remodeling and extracellular matrix degradation [19, 20], which leads to invasion and metastasis, a pivotal characteristic of malignant tumors. Overexpression of the urokinase plasminogen activator receptor has been determined in many malignant tumors [21, 22, 23], and inhibition of PLAUR can decrease tumor invasion, metastasis, and angiogenesis [24, 25]. In addition, some studies have indicated that tumoral and macrophage PLAUR can promote tumor invasiveness and that macrophages can increase the expression of PLAUR in tumor cells. These results suggested that PLAUR may be involved in tumor immunity and prompted us to explore further [26, 27]. In this study, we systematically investigated PLAUR expression and its role in glioma prognosis using clinical samples and data from the Chinese Glioma Genome Atlas (CGGA) and The Cancer Genome Atlas (TCGA) data sets, focusing on the clinical, molecular, and immunological characteristics of PLAUR, which might provide novel insights into glioma treatment.
Materials and Methods
Patients and Samples
All RNA sequencing data and clinical information of patients with diffuse glioma were obtained from two independent data sets of TCGA (http://cancergenome.nih.gov/) and the CGGA (http://www.cgga.org.cn). The establishment and management of our CGGA data bank have been described previously [28]. The raw data from these data sets were centralized and standardized through the scale function in R language before analysis. This study was approved by the institutional review board of Beijing Tiantan Hospital, and all patients signed informed consent.
Immunohistochemistry
Immunohistochemical test was performed using formalin‐fixed, paraffin‐embedded tissues. Five‐micrometer‐thick sections were dewaxed in xylene, rehydrated in graded ethanol, and rinsed in distilled water. After antigen retrieval with Tris‐Ethylene diamine tetraacetic acid buffer (pH 9.0), the sections were incubated with primary antibodies for 2 hours at room temperature (anti‐CD163 antibody, 1:200 dilution, Abcam, Cambridge, MA; anti‐Iba1 antibody, 1:200 dilution, Proteintech, Rosemont, IL) or for 2 hours at room temperature (anti–IL‐10 antibody, 1:200 dilution, Proteintech; anti–TGF‐β1 antibody, 1:200 dilution, Proteintech). After washing with phosphate‐buffered saline, the sections were incubated with appropriate secondary antibodies at room temperature for 1 hour. Then the sections were stained with diaminobenzidine solution, counterstained with hematoxylin, dehydrated, and sealed. Each stained slide was individually reviewed and scored by two neuropathologists independently.
Bioinformatic Analyses and Statistical Analysis
Statistical analyses and figure generation were performed with SPSS software (version 16.0; IBM SPSS, Chicago, IL), R software (version 3.6.1), and GraphPad Prism (version 7.0; GraphPad Software, La Jolla, CA). Kaplan‐Meier survival analysis, time‐dependent receiver operating characteristic (ROC) curve, and Cox regression analysis were performed to evaluate the potential of PLAUR as a prognostic factor in glioma. Pearson correlation analysis was conducted to calculate correlation coefficients between PLAUR and other genes. Gene ontology analysis and Kyoto Encyclopedia of Genes and Genomes (KEGG) analysis were applied to analyze enriched pathways via two online tools, Metascape (http://metascape.org/) and DAVID (the Database for Annotation, Visualization, and Integrated Discovery; http://david.ncifcrf.gov/), respectively. ESTIMATE package and EPIC (https://gfellerlab.shinyapps.io/EPIC_1-1/) were applied to evaluate immune score and immune cell infiltration. The “ggcorrplot” package and “circlize” package were used to visualize the correlation between PLAUR and other genes. A p value less than .05 was considered statistically significant.
Results
PLAUR High Expression Could Be a Sign for Glioma Malignancy
To clarify the landscape of PLAUR expression in glioma, the RNA sequencing data of 921 glioma samples were downloaded from the CGGA and TCGA data sets for analysis according to the WHO classification and molecular subtypes. Clinical and molecular characteristics of patients are provided in supplemental online Table 1. We found that the expression of PLAUR increased significantly along with grade progression (Fig. 1A; supplemental online Fig. 1A). The mesenchymal subtype showed the highest PLAUR expression level compared with the other subtypes (Fig. 1B; supplemental online Fig. 1B). These findings are consistent with previous analyses using the TCGA database performed by others [29]. The high expression level of PLAUR was concentrated in MGMT promoter unmethylated and IDH wild‐type (IDH‐wt) glioma, respectively (Fig. 1C and D; supplemental online Fig. 1C and D). Then we investigated PLAUR expression in lower grade glioma (LGG; WHO grade II and III glioma) and glioblastoma (GBM; WHO grade IV glioma) separately, with IDH mutation status and 1p/19q codeletion status taken into account. In both LGG and GBM, patients with IDH‐wt had the highest PLAUR expression level (Fig. 1E and F; supplemental online Fig. 1E and F). Immunostaining of PLAUR in gliomas with different grades and IDH status was also performed. Representative images in Figure 1G show that grade IV had the highest PLAUR expression and that grade II had the lowest. Supplemental online Figure 1 shows that the expression level of PLAUR is higher in IDH‐wt tissues. These results implied that high PLAUR expression could be a sign for glioma malignancy.
Figure 1.
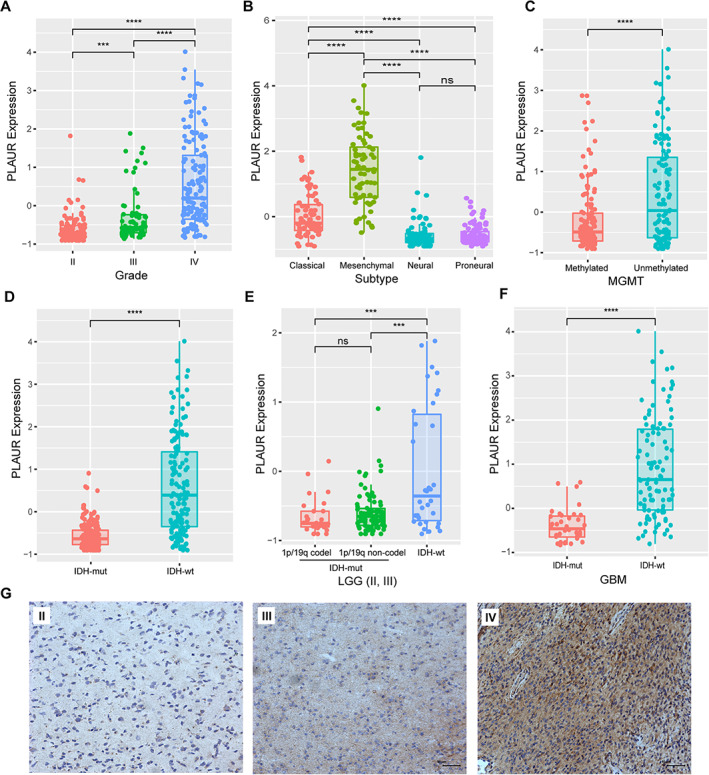
Molecular characteristics of PLAUR in patients from the Chinese Glioma Genome Atlas data set. (A): PLAUR expression according to World Health Organization grade. (B): PLAUR expression according to molecular subtypes. (C): PLAUR expression according to MGMT promoter status. (D): PLAUR expression according to different IDH mutation status. (E): PLAUR expression in LGG stratified with IDH mutation status and 1p/19q codeletion status. (F): PLAUR expression in GBM stratified with IDH mutation status. (G): Representative images of PLAUR immunostaining in different grades of glioma (bar, 50 μm).Abbreviations: codel, codeletion; GBM, glioblastoma; IDH‐mut, IDH mutant; IDH‐wt, IDH wild‐type; LGG, lower grade glioma; ns, not significant; PLAUR, plasminogen activator urokinase receptor. ***, p < .001; ****, p < .0001.
High Expression of PLAUR Indicated Poor Prognosis of Patients with Glioma
Because these results showed the relevance between PLAUR expression and glioma malignancy, we next analyzed the potential of PLAUR in predicting patient prognosis. We first divided the patients into two groups based on median PLAUR expression level to conduct Kaplan‐Meier survival analysis. As shown in Figure 2A and D, higher PLAUR expression was associated with shorter overall survival. When survival analysis was further performed in LGG and GBM separately, the prognostic tendency that high PLAUR expression was associated with decreased survival still existed (Fig. 2B, C, E, and F). We then evaluated the prediction accuracy of PLAUR for 1‐, 3‐, and 5‐year survival by performing time‐dependent ROC curve analysis. Figure 2G and supplemental online Figure 2A showed high time‐dependent area under curve of PLAUR expression in the CGGA (1‐year, 0.7810; 3‐year, 0.8437; 5‐year, 0.8688) and TCGA (1‐year, 0.8528; 3‐year, 0.8485; 5‐year, 0.8074) data sets. In addition, we performed univariable and multivariable Cox regression analyses to investigate the independent prognostic significance of PLAUR expression in the CGGA and TCGA data sets. As shown in Figure 2H, PLAUR served as an independent prognostic factor of patient survival (p < .001), even after other clinical factors, such as age, grade, IDH mutation status, MGMT promoter methylation, and radiotherapy, were taken into account. This significance was verified in TCGA data set (p < .001, supplemental online Fig. 2B). These findings indicated that PLAUR expression was an independent unfavorable prognostic biomarker in patients with glioma.
Figure 2.
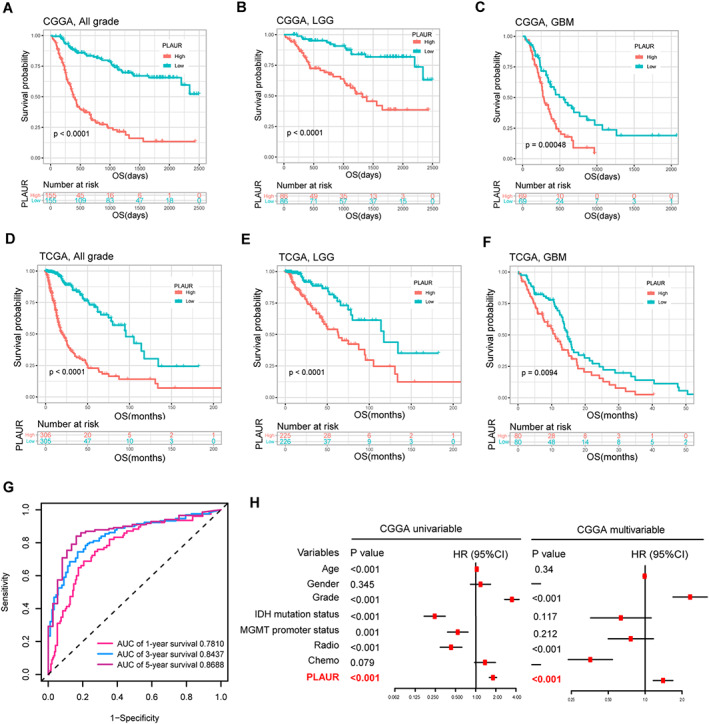
Survival analysis and prognostic validity of PLAUR expression. (A, D): Survival analysis in all grade glioma in the CGGA and TCGA data sets. (B, E): Survival analysis in LGG in the CGGA and TCGA data sets. (C, F): Survival analysis in GBM in the CGGA and TCGA data sets. (G): Time‐dependent receiver operating characteristic analysis of PLAUR for 1‐, 3‐, and 5‐year overall survival of patients with glioma in the CGGA data set. (H): Univariable and multivariable Cox regression analysis of PLAUR expression and several other clinical variables in the CGGA data set.Abbreviations: AUC, area under curve; CGGA, Chinese Glioma Genome Atlas; Chemo, chemotherapy; CI, confidence interval; GBM, glioblastoma; HR, hazard ratio; LGG, lower grade glioma; OS, overall survival; PLAUR, plasminogen activator urokinase receptor; Radio, radiotherapy; TCGA, The Cancer Genome Atlas.
Those independent prognostic parameters for overall survival in multivariable Cox regression were also selected and integrated into an individualized prediction model. The results showed that PLAUR expression contributed the most risk points (range, 0–100), whereas the other clinical variables, including grade and radiotherapy, exhibited smaller contributions (Fig. 3A). The nomogram yielded a C‐index value of 0.804 in the CGGA data set and 0.865 in TCGA data set. Moreover, the calibration plot for the probability of survival showed optimal agreement in the prediction of 1‐, 3‐, and 5‐year overall survival in both data sets (Fig. 3B and C).
Figure 3.

Nomogram for predicting overall survival of patients with glioma. (A): A nomogram that integrates PLAUR expression with several clinicopathologic variables in the CGGA data set. The line determines the “point” received for the value of each variable. The sum of these values is presented as “total points,” whereas the line drawn downward to the survival axis determines the likelihood of different survival rate. (B): The calibration curve for the nomogram model in the CGGA data set. (C): The calibration curve for the nomogram model in TCGA data set. Three colored lines (blue, red, and black) represent the performance of the nomogram. A closer fit to the diagonal gray line indicates a better estimation.Abbreviations: CGGA, Chinese Glioma Genome Atlas; PLAUR, plasminogen activator urokinase receptor; TCGA, The Cancer Genome Atlas.
PLAUR Was Involved in Immune Response in Glioma
To explore the potential biological processes of PLAUR in gliomas, we first screened genes that correlated with PLAUR expression (R ≥ 0.5, p < .0001) by Pearson's correlation analysis and then annotated their functions with Metascape. Results indicated that the correlated genes were functionally associated with immune processes, including cytokine production, T‐cell activation, cytokine‐mediated signaling pathway, and myeloid leukocyte activation, in both the CGGA and TCGA data sets (Fig. 4A; supplemental online Fig. 3A). Subsequent KEGG pathway analyses showed that genes positively correlated with PLAUR were mainly involved in inflammatory response and immune response (Fig. 4B; supplemental online Fig. 3B). These results implied the involvement of PLAUR in the immune system. To learn more about PLAUR in antiglioma immunity, we analyzed the relationship between PLAUR expression and immune cell infiltration in glioma samples by the ESTIMATE algorithm [30]. In both the CGGA and TCGA data sets, immune score and stromal score increased along with the increase of PLAUR expression (Fig. 4C, D, F, and G), and, correspondingly, gliomas with low tumor purity had high PLAUR expression [31] (Fig. 4E and H). These results implied the association between PLAUR and immune cell infiltration, which deserved further analysis.
Figure 4.

Functional analysis of PLAUR expression in glioma samples. (A): Enriched biological functions of PLAUR positively correlated genes in the Chinese Glioma Genome Atlas (CGGA) data set. (B): Enriched pathways of PLAUR positively correlated genes in the CGGA data set. (C, F): The relationship between PLAUR expression and immune score in different grade gliomas in the CGGA and The Cancer Genome Atlas (TCGA) data sets. (D, G): The relationship between PLAUR expression and stromal score in different grade gliomas in the CGGA and TCGA data sets. (E, H): The relationship between PLAUR expression and tumor purity in different grade gliomas in the CGGA and TCGA data sets.Abbreviation: PLAUR, plasminogen activator urokinase receptor.
High PLAUR Expression Indicated Increased Macrophage Infiltration and Immunosuppressive Phenotype
To further elucidate the association between PLAUR and immune cell infiltration, the proportion of various immune cell types in glioma samples was evaluated with EPIC [32], and CD4 T cells, CD8 T cells, and macrophages were specifically studied for their greater effect on antiglioma immune response [33]. As shown in Figure 5A and supplemental online Figure 4A, the infiltration level of CD8 T cells decreased and macrophages increased along with the increase of PLAUR expression in glioma samples. Figure 5B and supplemental online Figure 4B, C, and D illustrate a strong negative correlation between PLAUR and CD8 (r = –0.56, p < .0001 for CGGA; r = –0.4, p < .0001 for TCGA) and strong positive correlation between PLAUR and macrophages (r = 0.52, p < .0001 for CGGA; r = 0.63, p < .0001 for TCGA). In addition, the infiltration of CD8 T cells and macrophages was also negatively correlated (r = –0.41, p < .0001 for CGGA; r = –0.3, p < .0001 for TCGA). These findings led us to speculate that there existed some association between PLAUR and glioma‐infiltrating macrophages, which promoted immunosuppression and dampened CD8 T‐cell activation [34]. This speculation was confirmed with an open single‐cell sequencing data set of glioblastoma [35], which manifested the high expression of PLAUR in macrophages (Fig. 5C). These results indicated that high PLAUR expression is a marker for tumors with macrophage infiltration.
Figure 5.

Involvement of PLAUR in immunity. (A): The infiltration levels of CD8 T cells, CD4 T cells, and macrophages in glioma samples ranked according to PLAUR expression in the Chinese Glioma Genome Atlas (CGGA) data set. (B): Correlation analysis of PLAUR with CD8 T cells and macrophage infiltration in (A). (C): Expression of PLAUR in single cells based on a single‐cell database of glioblastoma. (D): Correlation analysis between PLAUR and gene markers of macrophages in the CGGA data set. (E): Correlation analysis of PLAUR and some immunosuppressive markers in the CGGA data set. (F): Immunostaining of CD163, Iba1, TGF‐β, and IL‐10 in glioma samples with different PLAUR expression (bar, 50 μm; n = 5 in each PLAUR expression level).Abbreviations: IL‐10, interleukin‐10; PLAUR, plasminogen activator urokinase receptor; TAM, tumor‐associated macrophage; TGF‐β, transforming growth factor β.
Macrophages and microglia can acquire proinflammatory M1 phenotype or alternative M2 phenotype after stimulation with different cytokines in vitro. In vivo, TAMs are reported to have a phenotype and function resembling M2 macrophages, which facilitates tumor progression [36]. To further elaborate PLAUR and macrophages, we selected marker genes of TAMs, M1 macrophages, and M2 macrophages [37], and PLAUR expression was significantly positively correlated with markers of TAMs and M2 but not with M1 in both the CGGA and TCGA data sets (Fig. 5D; supplemental online Fig. 4E). TAMs contribute to the immunosuppressive microenvironment, which is characterized with chemokines, such as IL‐10 and TGF‐β, and inhibitory immune checkpoints [38, 39, 40]. Figure 5E and supplemental online Fig. 4F illustrate the strong correlation between PLAUR and immunosuppressive genes in glioma samples, supporting the association between PLAUR and TAMs. Immunohistochemical staining was also performed to estimate immune status in glioma samples with different PLAUR expression level. As shown in Figure 5F, samples with high PLAUR expression were stained with more Iba1‐ and CD163‐positive cells, which were characteristic markers of TAMs and M2 macrophages, respectively. TGF‐β and IL‐10 also had more staining in PLAUR high expression sections. These findings suggested the strong correlation between PLAUR and TAMs, making PLAUR an alternative gene to predict the status of immune microenvironment in patients with glioma.
Discussion
Despite many efforts to reduce mortality, glioma is still the most fatal and common type of tumor in the central nervous system (CNS). Intratumoral heterogeneity and glioma stem cells enable glioblastoma to elude targeted therapy and recur after surgical resection combined with chemotherapy and radiation [41, 42]. With the discovery of lymphatic vessels in the CNS [43], the notion that the CNS is an immunoprivileged site is reviewed, and immunotherapy is regarded as a promising approach in glioma treatment, especially after the success of immunotherapy in melanoma, lung cancer, and renal carcinoma [44, 45]. However, the translation of immunotherapy to patients with glioblastoma has proven to be difficult, which has encouraged researchers to further study the uniqueness of the glioma immune microenvironment to acquire a more detailed understanding of immunotherapy resistance [46]. In glioma, both tumor‐intrinsic and tumor‐extrinsic factors impart resistance to immunotherapy. Tumor‐intrinsic factors include the lack of high‐quality neoantigens because of intratumoral heterogeneity and the silence of human leukocyte antigen. Tumor‐extrinsic factors include the paucity of tumor‐infiltrating CD8 T cells, the upregulation of inhibitory immune checkpoints, and the recruitment of immunosuppressive cells, such as TAMs and regulatory T cells [47, 48]. Different strategies have been tried to overcome resistance, including the introduction of high‐quality antigens via oncolytic viruses, adoptive T‐cell transfer, and the blockade of immune checkpoints, which failed to obtain sustained immune response [49, 50, 51]. The once overlooked TAMs are being given extra attention, and increasingly, findings imply their importance in maintaining immune resistance. Glioma cells release various cytokines, such as glial cell–derived neurotrophic factor and granulocyte‐macrophage colony‐stimulating factor, to accumulate microglia and macrophages into glioma tissue [52, 53]. The TAMs, in turn, secrete several factors, such as TGF‐β, IL‐10, and IL‐6, to facilitate the growth and invasion of glioma cell [17]. Factors from TAMs can also induce regulatory CD4 T cells and inhibit cytotoxic CD8 T cells. In addition, TAMs can express ligand receptors of inhibitory costimulatory molecules, thereby inhibiting the activation of CD8 T cells [54]. Therefore, it is tempting to harness TAMs to obtain sustained and enhanced efficacy of other immunotherapies, and it is also necessary to seek markers that could predict potential benefit.
In this study, we analyzed the clinical and molecular characteristics of PLAUR in glioma and explored its potential role in glioma development and progression. Glioma samples with higher PLAUR expression suggested greater infiltration of TAMs, which could be worth considering when administering immunotherapeutics. Additionally, PLAUR is cleaved and released into the blood and other body fluids [55]. Enhanced levels of soluble PLAUR in blood are related to poor prognosis and identified as a plasma biomarker in many cancer types [56, 57, 58]. However, further studies should be conducted to validate the correlation between PLAUR and immunosuppression in glioma, and the association between TAMs and soluble PLAUR in blood and cerebrospinal fluid and the potential of PLAUR in immunotherapy also need to be tested.
Conclusion
We conducted an extensive study on PLAUR through biological analysis across diffuse glioma. High PLAUR expression was associated with the malignant phenotype and could serve as an independent prognostic predictor in patients. The mechanism of PLAUR in promoting tumor progression through immune response has been elucidated to some extent. High PLAUR expression implied greater TAM infiltration and a more immunosuppressive microenvironment, which would be of consideration when administering immunotherapeutics.
Author Contributions
Conception/design: Fan Zeng, Ying Zhang
Provision of study material or patients: Guanzhang Li, Tao Jiang
Collection and/or assembly of data: Xiu Liu, Hua Huang
Data analysis and interpretation: Xiu Liu, Kenan Zhang
Manuscript writing: Fan Zeng, Guanzhang Li
Final approval of manuscript: Fan Zeng, Guanzhang Li, Xiu Liu, Kenan Zhang, Hua Huang, Tao Jiang, Ying Zhang
Disclosures
The authors indicated no financial relationships.
Supporting information
See http://www.TheOncologist.com for supplemental material available online.
Appendix S1: Supporting information
Appendix S2: Supporting information
Acknowledgments
This work was supported by the National Natural Science Foundation of China (81802994), National Natural Science Foundation of China (NSFC)/Research Grants Council (RGC) Joint Research Scheme (81761168038), Beijing Municipal Administration of Hospitals’ Mission Plan (SML20180501), and Beijing Nova Program (Z171100001117022).
No part of this article may be reproduced, stored, or transmitted in any form or for any means without the prior permission in writing from the copyright holder. For information on purchasing reprints contact commercialreprints@wiley.com. For permission information contact permissions@wiley.com.
Contributor Information
Tao Jiang, Email: taojiang1964@163.com.
Ying Zhang, Email: zhangy_bni@163.com.
References
- 1. Lapointe S, Perry A, Butowski NA. Primary brain tumours in adults. Lancet 2018;392:432–446. [DOI] [PubMed] [Google Scholar]
- 2. Jiang T, Mao Y, Ma W et al. CGCG clinical practice guidelines for the management of adult diffuse gliomas. Cancer Lett 2016;375:263–273. [DOI] [PubMed] [Google Scholar]
- 3. Omuro A, DeAngelis LM. Glioblastoma and other malignant gliomas: A clinical review. JAMA 2013;310:1842–1850. [DOI] [PubMed] [Google Scholar]
- 4. Stupp R, Mason WP, van den Bent MJ et al. Radiotherapy plus concomitant and adjuvant temozolomide for glioblastoma. N Engl J Med 2005;352:987–996. [DOI] [PubMed] [Google Scholar]
- 5. Louis DN, Perry A, Reifenberger G et al. The 2016 World Health Organization classification of tumors of the central nervous system: A summary. Acta Neuropathol 2016;131:803–820. [DOI] [PubMed] [Google Scholar]
- 6. Reifenberger G, Wirsching HG, Knobbe‐Thomsen CB et al. Advances in the molecular genetics of gliomas ‐ implications for classification and therapy. Nat Rev Clin Oncol 2017;14:434–452. [DOI] [PubMed] [Google Scholar]
- 7. Hanahan D, Weinberg RA. Hallmarks of cancer: The next generation. Cell 2011;144:646–674. [DOI] [PubMed] [Google Scholar]
- 8. Hanahan D, Coussens LM. Accessories to the crime: Functions of cells recruited to the tumor microenvironment. Cancer Cell 2012;21:309–322. [DOI] [PubMed] [Google Scholar]
- 9. Quail DF, Joyce JA. The microenvironmental landscape of brain tumors. Cancer Cell 2017;31:326–341. [DOI] [PMC free article] [PubMed] [Google Scholar]
- 10. Hambardzumyan D, Gutmann DH, Kettenmann H. The role of microglia and macrophages in glioma maintenance and progression. Nat Neurosci 2016;19:20–27. [DOI] [PMC free article] [PubMed] [Google Scholar]
- 11. Wick W, Platten M, Weller M. Glioma cell invasion: Regulation of metalloproteinase activity by TGF‐beta. J Neurooncol 2001;53:177–185. [DOI] [PubMed] [Google Scholar]
- 12. Markovic DS, Glass R, Synowitz M et al. Microglia stimulate the invasiveness of glioma cells by increasing the activity of metalloprotease‐2. J Neuropathol Exp Neurol 2005;64:754–762. [DOI] [PubMed] [Google Scholar]
- 13. Hu F, Dzaye O, Hahn A et al. Glioma‐derived versican promotes tumor expansion via glioma‐associated microglial/macrophages toll‐like receptor 2 signaling. Neuro Oncol 2015;17:200–210. [DOI] [PMC free article] [PubMed] [Google Scholar]
- 14. Ye XZ, Xu SL, Xin YH et al. Tumor‐associated microglia/macrophages enhance the invasion of glioma stem‐like cells via TGF‐beta1 signaling pathway. J Immunol 2012;189:444–453. [DOI] [PubMed] [Google Scholar]
- 15. Zhang Z, Huang X, Li J et al. Interleukin 10 promotes growth and invasion of glioma cells by up‐regulating KPNA 2 in vitro. J Cancer Res Ther 2019;15:927–932. [DOI] [PubMed] [Google Scholar]
- 16. Kim J, Bae JS. Tumor‐associated macrophages and neutrophils in tumor microenvironment. Mediators Inflamm 2016;2016:6058147. [DOI] [PMC free article] [PubMed] [Google Scholar]
- 17. Noy R, Pollard JW. Tumor‐associated macrophages: From mechanisms to therapy. Immunity 2014;41:49–61. [DOI] [PMC free article] [PubMed] [Google Scholar]
- 18. Ploug M, Ronne E, Behrendt N et al. Cellular receptor for urokinase plasminogen activator. Carboxyl‐terminal processing and membrane anchoring by glycosyl‐phosphatidylinositol. J Biol Chem 1991;266:1926–1933. [PubMed] [Google Scholar]
- 19. Dano K, Behrendt N, Hoyer‐Hansen G et al. Plasminogen activation and cancer. Thromb Haemost 2005;93:676–681. [DOI] [PubMed] [Google Scholar]
- 20. Vassalli JD, Baccino D, Belin D. A cellular binding site for the Mr 55,000 form of the human plasminogen activator, urokinase. J Cell Biol 1985;100:86–92. [DOI] [PMC free article] [PubMed] [Google Scholar]
- 21. Boonstra MC, Verspaget HW, Ganesh S et al. Clinical applications of the urokinase receptor (uPAR) for cancer patients. Curr Pharm De 2011;17:1890–1910. [DOI] [PubMed] [Google Scholar]
- 22. Sier CF, Quax PH, Vloedgraven HJ et al. Increased urokinase receptor levels in human gastrointestinal neoplasia and related liver metastases. Invasion Metastasis 1993;13:277–288. [PubMed] [Google Scholar]
- 23. Hildenbrand R, Schaaf A. The urokinase‐system in tumor tissue stroma of the breast and breast cancer cell invasion. Int J Oncol 2009;34:15–23. [PubMed] [Google Scholar]
- 24. Pulukuri SM, Gondi CS, Lakka SS et al. RNA interference‐directed knockdown of urokinase plasminogen activator and urokinase plasminogen activator receptor inhibits prostate cancer cell invasion, survival, and tumorigenicity in vivo. J Biol Chem 2005;280:36529–36540. [DOI] [PMC free article] [PubMed] [Google Scholar] [Retracted]
- 25. Rao JS, Gondi C, Chetty C et al. Inhibition of invasion, angiogenesis, tumor growth, and metastasis by adenovirus‐mediated transfer of antisense uPAR and MMP‐9 in non‐small cell lung cancer cells. Mol Cancer Ther 2005;4:1399–1408. [DOI] [PMC free article] [PubMed] [Google Scholar]
- 26. Marconi C, Bianchini F, Mannini A et al. Tumoral and macrophage uPAR and MMP‐9 contribute to the invasiveness of B16 murine melanoma cells. Clin Exp Metastasis 2008;25:225–231. [DOI] [PubMed] [Google Scholar]
- 27. Lindsten T, Hedbrant A, Ramberg A et al. Effect of macrophages on breast cancer cell proliferation, and on expression of hormone receptors, uPAR and HER‐2. Int J Oncol 2017;51:104–114. [DOI] [PMC free article] [PubMed] [Google Scholar]
- 28. Hu H, Wang Z, Liu Y et al. Genome‐wide transcriptional analyses of Chinese patients reveal cell migration is attenuated in IDH1‐mutant glioblastomas. Cancer Lett 2015;357:566–574. [DOI] [PubMed] [Google Scholar]
- 29. Gilder AS, Natali L, Van Dyk DM et al. The urokinase receptor induces a mesenchymal gene expression signature in glioblastoma cells and promotes tumor cell survival in neurospheres. Sci Rep 2018;8:2982. [DOI] [PMC free article] [PubMed] [Google Scholar]
- 30. Yoshihara K, Shahmoradgoli M, Martinez E et al. Inferring tumour purity and stromal and immune cell admixture from expression data. Nat Commun 2013;4:2612. [DOI] [PMC free article] [PubMed] [Google Scholar]
- 31. Zhang C, Cheng W, Ren X et al. Tumor purity as an underlying key factor in glioma. Clin Cancer Res 2017;23:6279–6291. [DOI] [PubMed] [Google Scholar]
- 32. Racle J, de Jonge K, Baumgaertner P et al. Simultaneous enumeration of cancer and immune cell types from bulk tumor gene expression data. Elife 2017;6:e26476. [DOI] [PMC free article] [PubMed] [Google Scholar]
- 33. Domingues P, Gonzalez‐Tablas M, Otero A et al. Tumor infiltrating immune cells in gliomas and meningiomas. Brain Behav Immun 2016;53:1–15. [DOI] [PubMed] [Google Scholar]
- 34. Gieryng A, Pszczolkowska D, Walentynowicz KA et al. Immune microenvironment of gliomas. Lab Invest 2017;97:498–518. [DOI] [PubMed] [Google Scholar]
- 35. Neftel C, Laffy J, Filbin MG et al. An integrative model of cellular states, plasticity, and genetics for glioblastoma. Cell 2019;178:835–849 e821. [DOI] [PMC free article] [PubMed] [Google Scholar]
- 36. Mantovani A, Sozzani S, Locati M et al. Macrophage polarization: Tumor‐associated macrophages as a paradigm for polarized M2 mononuclear phagocytes. Trends Immunol 2002;23:549–555. [DOI] [PubMed] [Google Scholar]
- 37. Wu X, Qu D, Weygant N et al. Cancer stem cell marker DCLK1 correlates with tumorigenic immune infiltrates in the colon and gastric adenocarcinoma microenvironments. Cancers 2020;12:274. [DOI] [PMC free article] [PubMed] [Google Scholar]
- 38. Ng TH, Britton GJ, Hill EV et al. Regulation of adaptive immunity; the role of interleukin‐10. Front Immunol 2013;4:129. [DOI] [PMC free article] [PubMed] [Google Scholar]
- 39. Oh SA, Li MO. TGF‐beta: Guardian of T cell function. J Immunol 2013;191:3973–3979. [DOI] [PMC free article] [PubMed] [Google Scholar]
- 40. Pollard JW. Tumour‐educated macrophages promote tumour progression and metastasis. Nat Rev Cancer 2004;4:71–78. [DOI] [PubMed] [Google Scholar]
- 41. Chen J, Li Y, Yu TS et al. A restricted cell population propagates glioblastoma growth after chemotherapy. Nature 2012;488:522–526. [DOI] [PMC free article] [PubMed] [Google Scholar]
- 42. Bao S, Wu Q, McLendon RE et al. Glioma stem cells promote radioresistance by preferential activation of the DNA damage response. Nature 2006;444:756–760. [DOI] [PubMed] [Google Scholar]
- 43. Louveau A, Smirnov I, Keyes TJ et al. Structural and functional features of central nervous system lymphatic vessels. Nature 2015;523:337–341. [DOI] [PMC free article] [PubMed] [Google Scholar]
- 44. Mellman I, Coukos G, Dranoff G. Cancer immunotherapy comes of age. Nature 2011;480:480–489. [DOI] [PMC free article] [PubMed] [Google Scholar]
- 45. Platten M, Reardon DA. Concepts for immunotherapies in gliomas. Semin Neurol 2018;38:62–72. [DOI] [PubMed] [Google Scholar]
- 46. Hanaei S, Afshari K, Hirbod‐Mobarakeh A et al. Therapeutic efficacy of specific immunotherapy for glioma: A systematic review and meta‐analysis. Rev Neurosci 2018;29:443–461. [DOI] [PubMed] [Google Scholar]
- 47. Sharma P, Hu‐Lieskovan S, Wargo JA et al. Primary, adaptive, and acquired resistance to cancer immunotherapy. Cell 2017;168:707–723. [DOI] [PMC free article] [PubMed] [Google Scholar]
- 48. Jackson CM, Choi J, Lim M. Mechanisms of immunotherapy resistance: Lessons from glioblastoma. Nat Immunol 2019;20:1100–1109. [DOI] [PubMed] [Google Scholar]
- 49. Foreman PM, Friedman GK, Cassady KA et al. Oncolytic virotherapy for the treatment of malignant glioma. Neurotherapeutics 2017;14:333–344. [DOI] [PMC free article] [PubMed] [Google Scholar]
- 50. Bagley SJ, Desai AS, Linette GP et al. CAR T‐cell therapy for glioblastoma: Recent clinical advances and future challenges. Neuro‐Oncology 2018;20:1429–1438. [DOI] [PMC free article] [PubMed] [Google Scholar]
- 51. Romani M, Pistillo MP, Carosio R et al. Immune checkpoints and innovative therapies in glioblastoma. Front Oncol 2018;8:464. [DOI] [PMC free article] [PubMed] [Google Scholar]
- 52. Ku MC, Wolf SA, Respondek D et al. GDNF mediates glioblastoma‐induced microglia attraction but not astrogliosis. Acta Neuropathol 2013;125:609–620. [DOI] [PubMed] [Google Scholar]
- 53. Sielska M, Przanowski P, Wylot B et al. Distinct roles of CSF family cytokines in macrophage infiltration and activation in glioma progression and injury response. J Pathol 2013;230:310–321. [DOI] [PubMed] [Google Scholar]
- 54. Prionisti I, Buhler LH, Walker PR et al. Harnessing microglia and macrophages for the treatment of glioblastoma. Front Pharmacol 2019;10:506. [DOI] [PMC free article] [PubMed] [Google Scholar]
- 55. Nguyen DH, Webb DJ, Catling AD et al. Urokinase‐type plasminogen activator stimulates the ras/extracellular signal‐regulated kinase (erk) signaling pathway and mcf‐7 cell migration by a mechanism that requires focal adhesion kinase, src, and shc. Rapid dissociation of grb2/sps‐shc complex is associated with the transient phosphorylation of erk in urokinase‐treated cells. J Biol Chem 2000;275:19382–19388. [DOI] [PubMed] [Google Scholar]
- 56. Shariat SF, Roehrborn CG, McConnell JD et al. Association of the circulating levels of the urokinase system of plasminogen activation with the presence of prostate cancer and invasion, progression, and metastasis. J Clin Oncol 2007;25:349–355. [DOI] [PubMed] [Google Scholar]
- 57. Henic E, Borgfeldt C, Christensen IJ et al. Cleaved forms of the urokinase plasminogen activator receptor in plasma have diagnostic potential and predict postoperative survival in patients with ovarian cancer. Clin Cancer Res 2008;14:5785–5793. [DOI] [PubMed] [Google Scholar]
- 58. Langkilde A, Hansen TW, Ladelund S et al. Increased plasma soluble uPAR level is a risk marker of respiratory cancer in initially cancer‐free individuals. Cancer Epidemiol Biomarkers Prev 2011;20:609–618. [DOI] [PubMed] [Google Scholar]
Associated Data
This section collects any data citations, data availability statements, or supplementary materials included in this article.
Supplementary Materials
See http://www.TheOncologist.com for supplemental material available online.
Appendix S1: Supporting information
Appendix S2: Supporting information