Abstract
Background
Despite best efforts, false positive and false negative test results for SARS-CoV-2 are unavoidable. Likelihood ratios convert a clinical opinion of pre-test probability to post-test probability, independently of prevalence of disease in the test population.
Methods
The authors examined results of PPA (Positive Percent Agreement, sensitivity) and NPA (Negative Percent Agreement, specificity) from 73 laboratory experiments for molecular tests for SARS-CoV-2 as reported to the FIND database, and for two manufacturers’ claims in FDA EUA submissions.
PPA and NPA were converted to likelihood ratios to calculate post-test probability of disease based on clinical opinion of pre-test probability. Confidence intervals were based on the number of samples tested. An online calculator was created to help clinicians identify false-positive, or false-negative SARS-CoV-2 test results for COVID-19 disease.
Results
Laboratory results from the same test methods did not mirror each other or the manufacturer. Laboratory studies showed PPA from 17% to 100% and NPA from 70.4% to 100%. The number of known samples varied 8 to 675 known patient samples, which greatly impacted confidence intervals.
Conclusion
Post-test probability of the presence of disease (true-positive or false-negative tests) varies with clinical pre-test probability, likelihood ratios and confidence intervals.
The Clinician’s Probability Calculator creates reports to help clinicians estimate post-test probability of COVID-19 based on the testing laboratory’s verified PPA and NPA.
Key words: SARS-CoV-2, pre-test probability, post-test probability, likelihood ratio
INTRODUCTION
Severe acute respiratory syndrome coronavirus-2 (SARS-CoV-2) is a novel coronavirus that has caused a worldwide pandemic of the human respiratory illness COVID-19.1 During the COVID-19 outbreak, accurate testing has been a unique and constant challenge for the scientific community. Despite best efforts, false positive and false negative test results are unavoidable2,3. At no time in history has the medical community embarked on a diagnostic testing campaign that is not being pursued for clinical reasons, but instead for epidemiological reasons unrelated to the medical aspects of the illness. There are three different types of testing available, molecular testing, antigen and antibody testing.4 The gold standard at present for diagnosing suspected cases of COVID-19 is molecular testing by real-time reverse transcription polymerase chain reaction (RT-PCR), which is a nucleic acid amplification test that detects unique sequences of SARS-CoV-2 virus.5 With an increasing number of asymptomatic patients, understanding of the probability of true and false results has never been so critical. Likelihood ratios convert a clinical opinion of pre-test probability to post-test probability, independently of prevalence of disease in the test population.6,7 This article explores a modified application of likelihood ratios to provide practical guidance to the relative probability of true and false test results.
SIGNIFICANCE OF PRE-TEST AND POST-TEST PROBABILITY OF COVID-19 INFECTION
Pre-test probability and post-test probability are the probabilities of the presence of COVID-19 before (pre) and after (post) a diagnostic test.8 During the COVID-19 pandemic detecting pre-symptomatic or asymptomatic patients has been of paramount importance. However, tests are often performed with low pre-test probability missing such patients. Although sometimes confused with simple prevalence of disease, the clinical pre-test probability of disease can be more precisely estimated with clinical information on each patient. The probability of infection based on patient symptoms roughly increase with loss of appetite, loss of smell and/or taste, myalgia or fatigue, a strong feeling of weariness, fever, cough, shortness of breath and clinical symptoms of pneumonia9,10,11,12. Post-test probability of disease is calculated from the clinical opinion of pre-test probability based on increasing patient symptoms and the quality of the testing process as reflected by PPA, PNA and likelihood ratios.
PPA, NPA, LIKELIHOOD RATIO AND CONFIDENCE INTERVAL
Positive percent agreement (PPA) is the proportion of comparative/reference method positive results in which the test method result is positive. Negative percent agreement (NPA) is the proportion of comparative/reference method negative results in which the test method result is negative.13 To evaluate the test methods, PPA (sensitivity) and NPA (specificity) are the most common metrics utilized.
The likelihood ratio uses PPA and NPA to create a ratio of the probability that a test result is correct to the probability that it is not. A likelihood ratio is the percentage of ill people with a given test result divided by the percentage of well individuals with the same result (true result: false result). When combined with an accurate clinical diagnosis, likelihood ratios improve diagnostic accuracy in a synergistic manner6,7,8.
Likelihood ratios are calculated from PPA and NPA:
Positive LR = (PPA / (100 – NPA) (True Positives / False Positives)
Negative LR = (100 – PPA) / NPA (False Negatives/True Negatives)
Likelihood ratios are calculated to determine 2 things: (i) how useful a diagnostic test is; and (ii) how likely it is that a patient has a disease7. Likelihood ratios range from zero to infinity (9999.9). The higher the value, the more likely the test will indicate that the patient has the condition.
Confidence interval gives an estimated range of values which is likely to include an unknown population parameter14. Confidence intervals provide a range of possible results: minimum, probable and maximum. They tell the end-user how much faith they can have in the value reported.
The likelihood ratio, and thus post-test probability is driven by test PPA and NPA. Reported values of PPA and NPA vary between laboratories using the same method, and the values reported by that manufacturer to FDA for EUA evaluation. Clinical samples may be sent to different testing laboratories, and laboratories may change methods.
The process is described here and available in the online “Clinician’s Probability Calculator” can create a report to assist clinicians project post-test probability of disease based on their clinical estimate of pre-test probability and the quality of the testing process used to create the result.
METHODOLOGY
The authors used the calculations and definitions in Table 1 to examine results of individual laboratory experiments for molecular tests for SARS-CoV-2 as reported to the FIND database15, and for selected methods in FDA EUA submissions16,17.
- We created an Excel spreadsheet and then designed an online application to graph confidence intervals of post-test probability of infection on with a positive or negative test result (on the y-axis) against the clinician’s estimate of pre-test probability (on the x-axis.) Confidence intervals for the graph and each of the following indicators are driven by PPA and PNA reported, plus the number of samples tested14:
- Post-test probability of SARS-CoV-2 infection with positive and negative test result.
- Number of true positive and negative tests in every ten positive or negative results seen.
- Number of false positive and negative tests in every 10 positive or negative results seen
- One in ‘x’ positive tests is true, and one in ‘x’ negative tests is True.
Table 1.
Common definitions and key calculations
| PPA: Drives the True-Positive and False-Negative rates |
Positive Percent Agreement (sensitivity) = True positive results / All positive results | |
|
NPA: Drives the True- Negative and False- Positive rates |
Negative Percent Agreement (specificity) = True negative results / All negative results | |
|
Pre-test probability: Based on clinical opinion |
Clinical probability that a person being tested has COVID-19 before the test is performed. | |
| Pre-test odds | = Pre-test probability/(1-Pre-test probability) = Probability person is infected/ Probability they are not |
|
| Calculations | Positive test | Negative test |
| Likelihood ratio | Positive (LR+) = PPA / (1 - NPA) = True Pos Rate/False Pos Rate |
Negative (LR-) = (1-PPA)/NPA = False Neg Rate/True Neg Rate |
| Post-test odds | = Pre-test odds x LR+ | = Pre-test odds x LR- |
|
Post-test probability: The probability that a person is infected |
= Post test odds Pos Test / (Post-Test Odds Pos +1) - with a positive test | = Post test odds Neg Test / (Post-Test Odds Neg Test +1) - with a negative test |
RESULTS
Ninety-two laboratories reported both PPA and NPA to the FIND database15 as of October 17, 2020. We removed 19 results from two laboratories in one country that reported NPA of 100% based on only one negative
The authors compared the Information For Use (IFU) documents provided to FDA for two manufacturers16,17, to five FIND15 laboratory studies for manufacturer 1 (Mfg-1) and six FIND laboratory studies for manufacturer 2 (Mfg-2.) To calculate PPA, Positive Percent Agreement, Mfg-1 tested “30 contrived clinical nasopharyngeal (NP) swabs prepared by spiking clinical NP swab matrix with purified viral RNA containing target sequences from the SARS-CoV-2 genome at concentrations approximately 2x LOD (20 samples) and 5x LOD (10 samples)16.” Mfg-2 tested “45 patient samples collected during COVID-19 pandemic in the US that had previously been characterized as positive for SARS-CoV-2 by an EUA RT-PCR test17.” Mfg-1 reported PPA of 100% (30/30). Mfg-2 reported PPA of 97.8% (44/45).
To prove NPA, the Negative Percent Agreement, Mfg-1 reported that “Thirty Negative NP swab samples were also tested in this study.16 ”Mfg-2’ IFU reported testing 45 samples, saying “Fifteen of the 45 SARS-CoV-2negative NP swab specimens were collected before December 2019 and are expected to be negative for SARS-CoV-2. The others had previously been characterized as negative for SARS-CoV-2by an EUA RT-PCR test17. ”Mfg-1 reported NPA of 100% (30/30). Mfg-2 reported NPA of 95.6% (43/45)16,17. These results were driven by each manufacturer’s test methods, the type and number of samples tested plus the competency of staff and instrument performance at the manufacturers’ sites.
Table 2 presents the data reported by the selected manufacturers and two laboratories using each test method. The number of known samples that each laboratory tested drives the confidence intervals around PPA and NPA which, in turn, drive the confidence intervals around likelihood ratios, which drive post-test probability and other metrics. Notice the wide variation in the number of known samples tested in rows 1 and 2. In row 3, notice that the labs A and B reported PPA values lower than Mfg-1 while Labs C and D reported higher PPA than Mfg-2. Sample size drives the confidence intervals around PPA, NPA and likelihood ratios. Confidence intervals for four studies range from below 10 to infinity. Pre-test probability x LR+ = post-test probability. With Pre-test probability of 3% x LR+ of 10 = post-test probability of 30%. If LR+ = infinity, post-test probability is 100%.
Table 2.
Method validation studies
| Mfg-1 | Lab A | Lab B | Mfg-2 | Lab C | Lab D | |
|---|---|---|---|---|---|---|
| Known positives | 30 | 46 | 33 | 45 | 5 | 220 |
| Known negatives | 30 | 15 | 546 | 45 | 3 | 261 |
| PPA reported | 100% | 71.7% | 78.8% | 97.8% | 100.0% | 99.5% |
| Confidence intervals | 88.0% - 100% | 56.6% - 83.8% | 61.2% - 90.9% | 87.8% - 100% | 54.6% - 100% | 97.3 %- 100% |
| NPA reported | 100% | 100% | 100% | 95.60% | 100% | 95.80% |
| Confidence intervals | 88.0% - 100% | 78.5% - 100% | 99.3% - 100% | 84.5% - 100% | 41.9% - 100% | 92.5% - 97.9% |
| Pos likelihood ratio (LR+) | 999.9 | 999.9 | 999.9 | 22.2 | 999.9 | 23.7 |
| Confidence intervals | 7.3-999.9 | 2.6-999.9 | 82.6-999.9 | 7.3-999.9 | 0.94-999.9 | 12.91-999.9 |
| Neg likelihood ratio (LR-) | 0.00 | 0.28 | 0.21 | 0.023 | 0.00 | 0.005 |
| Confidence intervals | 0-0.14 | 0.16-0.55 | 0.09-0.39 | 0-0.14 | 0-1.08 | 0.09-0.39 |
Table 3 presents the probable post-test interpretation of results for patients with pre-test probability of 3%. Red numbers in the table indicate variation from others and/or less-than-ideal test performance. Notice that a positive test results from Mfg-2 and Lab D indicate less than a 50% post-test probability of disease. Where Mfg-1 and Lab A both projected 100% post-test probability, confidence intervals show that could actually be as low as 18% or 7.5%; in Lab C, the reported 100% may actually be as low as 2.8% due to the low number of samples tested. Confidence intervals show that clinician may see only one to three true results for every of 10 positive tests reviewed. Lab A may produce as few as 1 true result in every 13.5; in Lab C, confidence intervals show that there is a risk of seeing only one true positive result in 35 reported true results.
Table 3.
Post-test probability of SARS-CoV-2: with 3% pre-test probability
| Post-test probability of SARS-CoV-2 (Ideal is 100% with positive test; 0% with negative test) | ||||||
|---|---|---|---|---|---|---|
| Mfg-1 | Lab A | Lab B | Mfg-2 | Lab C | Lab D | |
| With positive test | 100% | 100% | 100% | 41% | 100% | 42% |
| Confidence intervals | 18.5% - 100% | 7.5% - 100% | 71.9% - 100% | 14.9% - 100% | 2.8% - 100% | 28.5% - 59% |
| With negative test | 0.0% | 0.9% | 0.7% | 0.1% | 0.0% | 0.0% |
| Confidence intervals | 0% - 0.4% | 0.5% - 1.7% | 0.3% - 1.2% | 0% - 0.4% | 0% - 3.2% | 0% - 0.1% |
| Number of true results in every ten tests reviewed (ideal is ten of ten) | ||||||
| Positive test | 10 | 10 | 10 | 4.1 | 10 | 4.2 |
| Confidence intervals | 1.8-10.0 | 0.8-10.0 | 7.2-10.0 | 1.5-10.0 | 0.3-10.0 | 2.9-5.9 |
| Negative test | 10.0 | 9.9 | 9.9 | 10.0 | 10.0 | 10.0 |
| Confidence intervals | 10.0-10.0 | 9.8-10.0 | 9.9-10.0 | 10.0-10.0 | 9.7-10.0 | 10.0-10.0 |
| One in × test results is/are true (ideal is one in one) | ||||||
| Positive test | 1.0 | 1.0 | 1.0 | 2.5 | 1.0 | 2.4 |
| Confidence intervals | 1.0-5.4 | 1.0-13.3 | 1.0-1.4 | 1.0-6.7 | 1.0-35.4 | 1.7-3.5 |
| Negative test | 1.0 | 1.0 | 1.0 | 1.0 | 1.0 | 1.0 |
| Confidence intervals | 1.0-1.0 | 1.0-1.0 | 1.0-1.0 | 1.0-1.0 | 1.0-1.0 | 1.0-1.0 |
When pre-test probability raises to 50% in Table 4 probable post-test probability rises to over 95% for all labs. Even with a negative test, post-test probability is approximately 20% in Labs A and B. With pre-test probability of 50%, only 8 of 10 negative tests are true for Labs A and B. Table 2 shows that confidence intervals for Lab C show a low possible positive likelihood ratio of 0.94 and a high possible negative likelihood ratio of 1.08. When pre-test probability is 50%, the odds are 1:1 that the patient is infected. Multiply the pre-test odds times the likelihood ratio to calculate post-test odds – which will be essentially unchanged in this case. The low range of post-test possibility with a positive test overlaps the high possibility with a negative test positive or negative test result, as the method was verified in Lab C so a test result from this laboratory may not be able to differentiate infected from non-infested patients. This is not due to an inherent weakness in the test method, but to the low number of samples used by Lab C to verify method performance in their hands.
Table 4.
Post-test probability of SARS-CoV-2: with 50% pre-test probability
| Post-test probability of SARS-CoV-2 (Ideal is 100% with positive test; 0% with negative test) | ||||||
|---|---|---|---|---|---|---|
| Mfg-1 | Lab A | Lab B | Mfg-2 | Lab C | Lab D | |
| With positive test | 100% | 100% | 100% | 96% | 100% | 96% |
| Confidence intervals | 88% - 100% | 72% - 100% | 99% - 100% | 85% - 100% | 49% - 100% | 93% - 98% |
| With negative test | 0.00% | 22.10% | 17.50% | 2.20% | 0.00% | 0.50% |
| Confidence intervals | 0% - 12% | 14% - 36% | 8% - 28% | 0% - 13% | 0% - 52% | 0% - 3% |
| Number of true results in every ten tests reviewed (ideal is ten often) | ||||||
| Positive test | 10 | 10 | 10 | 9.6 | 10 | 9.6 |
| Confidence intervals | 8.8-10 | 7.2-10 | 9.9-10 | 8.5-10 | 4.8-10 | 9.3-9.8 |
| Negative test | 10 | 7.8 | 8.3 | 8.7 | 10 | 9.9 |
| Confidence intervals | 8.8-10 | 6.4-8.6 | 7.2-9.2 | 8.7-9.8 | 4.8-10 | 9.7-10 |
| One in × test results is/are true (ideal is one in one) | ||||||
| Positive test | 1.0 | 1.0 | 1.0 | 1.0 | 1.0 | 1.0 |
| Confidence intervals | 1.0-1.1 | 1.0-1.4 | 1.0-1.0 | 1.0-1.2 | 1.0-2.1 | 1.0-1.1 |
| Negative test | 1.0 | 1.3 | 1.2 | 1.0 | 1.0 | 1.0 |
| Confidence intervals | 1.0-1.1 | 1.2-1.6 | 1.1-1.4 | 1.0-1.1 | 1.0-2.1 | 1.0-1.0 |
The authors designed an online ‘Clinician’s Probability Calculator’ to create a report that could accompany each laboratory’s test results to show clinicians the post-test probability of COVID-19 based on their clinical opinion of each patient’s pre-test probability.
Each laboratory’s report would vary based on the laboratory’s chosen methodology and on the PPA, PNA and number of samples in their on-site method validation studies. The calculator overcomes the complexity of calculations that prohibit most laboratories from reporting post-test probability with confidence intervals. It is available at https://awesome-numbers.com/post-test-probability-calculator/. Reports contain data as shown in Table 3 and in Table 4, plus in the graphs with confidence intervals as shown in Figure 5.
Figure 5.
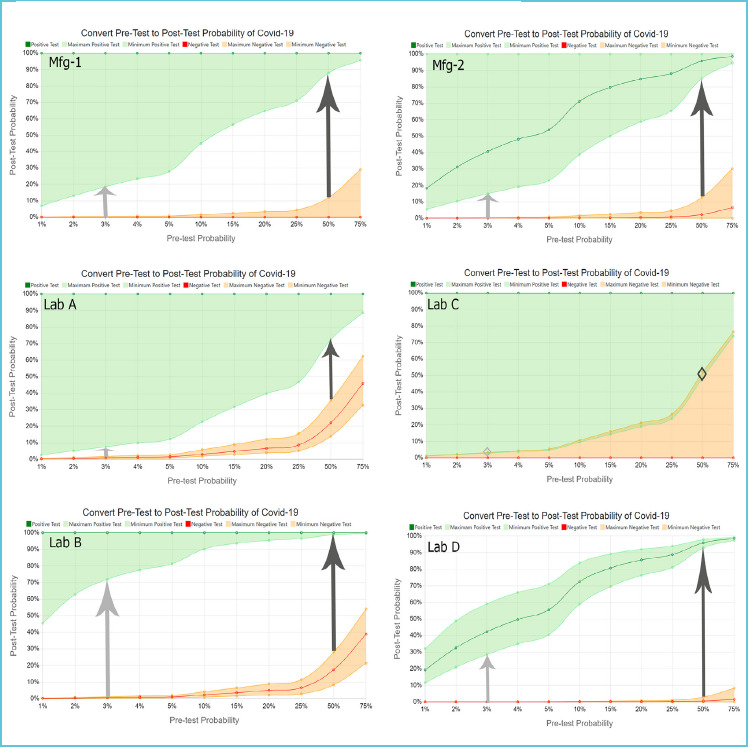
Probability Calculator results from Manufacturer 1 and 2, plus Labs A, B, C and D
DISCUSSION
Importance of PPA (sensitivity) and NPA (specificity)
PPA, the Positive Percent Agreement (sensitivity), drives the rate of true positive and false negative test results. NPA, Negative Percent Agreement (specificity), drives the rate of true negative and false positive test results. PPA and NPA combine to drive the probability, number and cost of false-positive and -negative test results4. PPA and PNA are typically used by laboratory directors to compare inherent method quality and select test methods. They can also be used to calculate likelihood ratios that in turn drive post-test probability of COVID-19 disease plus the graphs and other metrics displayed in Figure 5 and Tables 3 and 4.
Test methods are often verified by manufacturers under ideal conditions with hospital or contrived samples containing higher viral loads than those from asymptomatic individuals living in the community. As such, PPA and NPA in test laboratories might differ significantly from values reported by manufacturers. Notice in Figure-3 that none of the five laboratories reporting to FIND15 attained the 100% PPA claimed in the FDA IFU by Manufacturer 116. In contrast, laboratories C and D reported higher PPA values than Manufacturer 217. Thus, the PPA and NPA values reported by manufacturers cannot be assumed to accurately reflect performance in each laboratory.
Figure 3.
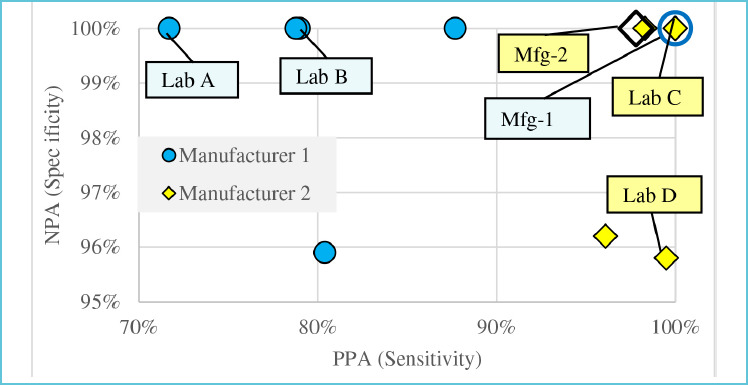
PPA & NPA for Mfg-1 and Mfg-2
PPA and NPA do not help clinicians decide if a specific positive or negative test result is true. PPA and NPA can be converted to likelihood ratios which can be used to convert clinical pretest probability of disease for a specific patient to post-test probability.
Relevance of likelihood ratios
Likelihood ratios allow one to convert pre-test to post-test odds of infection.7 When pre-test probability is 50%, the odds are 1:1 that the patient is infected. One of every two people with ‘these’ clinical symptoms is expected to be positive before testing (50%). If the positive likelihood ratio is approximately 24, as in Lab D in Table 3, multiplying the pre-test odds by the positive likelihood ratio produces post-test odds of 24:1. Twenty-four of every 25 people with a positive test are actually infected; 24/25 = 96% post-test probability.
Importance of number of known samples tested
The number of known positive and negative samples tested determines the confidence intervals around PPA and NPA14. Figure 1 and Table 2 illustrate the dramatic difference in number of samples tested by individual sites reporting to FIND15 Labs A, B and C each reported 100% NPA. Lab A made that assessment by testing 15 known negative samples, while Lab B tested 546 known negatives and Lab C tested only three. The lower limit of confidence for NPA in Lab A is 78.5% compared to 99.3% in Lab B and only 41.9% in Lab C (Table 2.) The low number of known samples tested in Lab C does not allow this lab to verify acceptable method performance with confidence.
Figure 1.
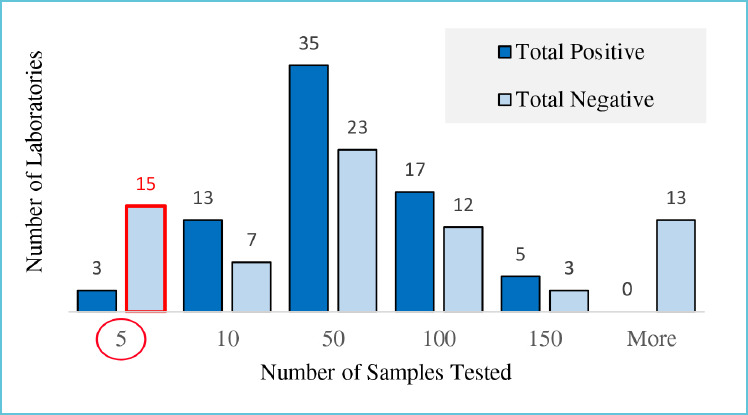
Known samples tested
Impact of confidence intervals
Confidence intervals determine the range of possibilities for PPA and NPA, which drive likelihood ratios that drive post-test probability of COVID-19 with positive and negative test results. Post-test probability drives the number of true and false positive and negative tests in every 10 positive or negative results seen, and how many positive or negative test results would be seen to find one true test result. Confidence intervals allow users to visualize the gap between the post-test probability that a positive, or negative, test indicates an infected person.
Value of graphs and metrics reported by the Probability Calculator
Instead of either taking all positive or negative test results at face value or developing personal experience to ‘guess’ if results are true or false, clinicians can visualize a reliable scientific range of possibilities. Glancing at the six graphs in Figure 5 clarifies that when pre-test probability is only 3%, the probability of a person having COVID-19, even with a positive test, is less than 50% - except in Lab B where they tested enough samples to prove test reliability. These graphics and data eliminate the use of Fagan’s Nomogram8, which is typically used with likelihood ratios but is cumbersome for front-line use and does not include confidence intervals.
Laboratory directors and public health officials who are challenged to select and verify test methods can clearly see the ability of each test to confirm, or rule out, SARS-CoV-2 infections. Lab C shows no gap at all between the range of possibilities that a positive or negative test indicates an infected person. The test has not been verified to provide useful information by testing only five known-positive and three known-negative samples. Laboratory directors and clinicians can have little confidence in the values reported in such circumstances.
Clinicians can benefit from understanding the number of true and false positive results they can expect to see in every ten positive or negative results. With 3% pre-test probability, clinicians may see as few as one or two true positives in every ten positive test results according to the Manufacturer-1 and Lab A, while Lab B can be relied on to produce over seven of ten true positives (Table 3). Knowing the frequency of true test results reported could impact test selection and interpretation. This information, however, is not available by only examining the reported PPA and NPA values.
In the USA, Clinical Laboratory Improvement Amendments (CLIA) mandates that laboratory director responsibilities include ensuring that your laboratory develops and uses a quality system approach to laboratory testing that provides accurate and reliable patient test results19. Accuracy is the number of true results as a portion of all test results created20. The authors were shocked to discover that most laboratories are not required to verify that they can, at least, reproduce PPA and NPA claims from manufacturers. This does not preclude the laboratory director from performing this study as part of good lab practice. In fact, Stephanie L. Mitchell et al published an article in the Journal of Clinical Microbiology21 outlining a process to verify method PPA and NPA with ten positive and negative samples. In order to ensure method accuracy, we recommend that each testing laboratory confirm PPA and NPA with sufficient known samples to provide reliable post-test probability of disease. We concur that each report should be accompanied by a statement from the laboratory indicating that test performance has been verified; the Clinician’s Probability Calculator fulfils this need.
CONCLUSION
In spite of all possible measures taken, false positive and false negative SARS-CoV-2 test results are cannot be avoided2,3. A positive or negative test result from one laboratory has a different probability for the presence of disease than the same result from another laboratory. Post-test probability, likelihood ratios and confidence intervals can help answer the question: ”Does this person have COVID-19, or not?” by converting the physician or other healthcare professional’s clinical estimate of pre-test probability to post-test probability. If the pre-test probability is below 5%, a positive test result may only raise that probability to less than 50%. A negative test with some methods in some labs may still convey a 20% post-test probability of disease. Ranges of probabilities differ depending on proven method PPA and NPA in each laboratory. The authors recommend that testing laboratories verify PPA and NPA of their SARS-CoV-2 test method with sufficient sample numbers to verify acceptable performance and create a report with the Clinician’s Probability Calculator (https://awesome-numbers.com/post-test-probability-calculator) to assist with interpretation of test results.
Figure 2.
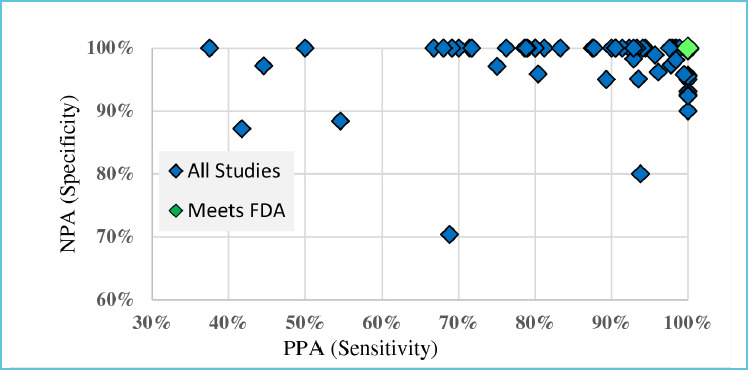
PPA and NPA by study
Figure 4.
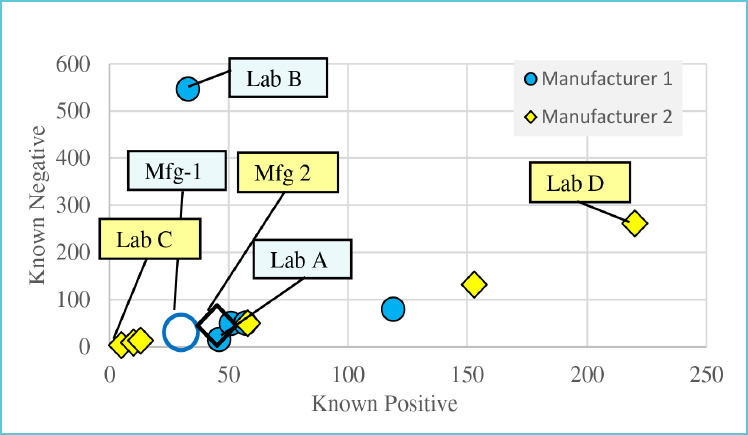
Known samples tested for Mfg-1 and Mfg-2
Acknowledgement
Zoe Brooks and Saswati Das are the joint first authors of the article.
Abbreviations
- PPA
positive percent agreement (sensitivity)
- NPA
negative percent agreement (specificity)
- LR+
Positive likelihood ratio
- LR-
Negative likelihood ratio
- EUA
emergency use authorization
Key points
Asymptomatic patients, unavoidable false-positive results, and low disease prevalence make it difficult for clinicians to interpret SARS-CoV-2 test results.
The same SARS-CoV-2 test result from different laboratories conveys a different post-test probability of disease.
Clinicians can convert a patient’s clinical pre-test probability of COVID-19 disease to a range of possibilities of post-test probability with reports from the online Clinicians’ Probability Calculator.
REFERENCES
- 1.Tang D, Comish P, Kang R. The hallmarks of COVID-19 disease. PLoS Pathog. 2020;16(5):e1008536. Published 2020 May 22. doi:10.1371/journal.ppat.1008536 [DOI] [PMC free article] [PubMed] [Google Scholar]
- 2.Surkova E, Nikolayevskyy V, Drobniewski F. False-positive COVID-19 results: hidden problems and costs [published online ahead of print, 2020 Sep 29]. Lancet Respir Med. 2020;8(12):1167-1168. [DOI] [PMC free article] [PubMed] [Google Scholar]
- 3.Mayers C, Baker K. Impact of false-positives and false-negatives in the UK’s COVID-19 RT-PCR testing programme. June 3, 2020. Available from https://assets.publishing.service.gov.uk/government/uploads/system/uploads/attachment_data/file/895843/S0519_Impact_of_false_positives_and_negatives.pdf (Accessed Sept 15, 2020).
- 4.Brooks Z, Das S. COVID-19 Testing: Impact of Prevalence, Sensitivity, and Specificity on Patient Risk and Cost, American Journal of Clinical Pathology. 2020; 154(5): 575-584 [DOI] [PMC free article] [PubMed] [Google Scholar]
- 5.Lippi G, Plebani M. The novel coronavirus (2019-nCoV) outbreak: think the unthinkable and be prepared to face the challenge. Diagnosis (Berl). 2020. doi:10.1515/dx-2020-0015 [DOI] [PubMed] [Google Scholar]
- 6.McGee S. Simplifying likelihood ratios. J Gen Intern Med. 2002;17(8):646-649. [DOI] [PMC free article] [PubMed] [Google Scholar]
- 7.Likelihood ratios and probability of infection in a tested individual. Available from https://epitools.ausvet.com.au/probabilityofinfection(Accessed Sept 15, 2020)
- 8.Prinzi A. Why Pretest and Post-test Probability Matter in the Time of COVID-19, American Society for Microbiology, June 2020. Accessed from https://asm.org/Articles/2020/June/Why-Pretest-and-Posttest-Probability-Matter-in-the-time-of-COVID-19
- 9.Tabata Z, Imai K, Kawano S, et al. Clinical characteristics of COVID-19 in 104 people with SARS-CoV-2 infection on the Diamond Princess cruise ship: a retrospective analysis. Lancet Infect Dis 2020; 20: 1043–1050 Published Online June 12, 2020 https://doi.org/10.1016/S1473-3099(20)30482-5 [DOI] [PMC free article] [PubMed] [Google Scholar]
- 10.Huang C, Wang Y, Li X, Ren L, Zhao J, Hu Y, et al. Clinical features of patients infected with 2019 novel coronavirus in Wuhan, China. Lancet. 2020. January 24 [DOI] [PMC free article] [PubMed] [Google Scholar]
- 11.Wiersinga W, Rhodes A, Cheng A, et al. Pathophysiology, Transmission, Diagnosis, and Treatment of Coronavirus Disease 2019 (COVID-19): A Review. JAMA. 2020. August 25; 324(8):782-793. [DOI] [PubMed] [Google Scholar]
- 12.Government of Canada. COVID-19 signs, symptoms and severity of disease: A clinician guide. Last updated: September 18, 2020. https://www.canada.ca/en/public-health/services/diseases/2019-novel-coronavirus-infection/guidance-documents/signs-symptoms-severity.html
- 13.CLSI User Protocol for Evaluation of Qualitative Test Performance. 2nd ed. CLSI guideline EP12A2. Garrett PE: : Clinical and Laboratory Standards Institute; 2008 [Google Scholar]
- 14.Confidence Intervals for One-Sample Sensitivity and Specificity. Available from https://ncss-wpengine.netdna-ssl.com/wpcontent/themes/ncss/pdf/Procedures/PASS/Confidence_Intervals_for_One-Sample_Sensitivity_and_Specificity.pdf (Accessed Sept 15, 2020)
- 15.FIND Foundation for Innovative New Diagnostic Test performance dashboard. Available from https://finddx.shinyapps.io/COVID19DxData/. Accessed Oct 17, 2020 (Data attached as supplementary material).
- 16.ID NOW COVID-19 For Use Under an Emergency Use Authorization – US only (EUA). Available from https://www.fda.gov/media/136525/download (Accessed Oct 10, 2020)
- 17.Instructions for Use For Use Under an Emergency Use Authorization (EUA) Only, Cepheid Xpert® Xpress SARS-CoV-2. Available from https://www.fda.gov/media/136314/download (Accessed Oct 10, 2020)
- 18.Policy for Coronavirus Disease-2019 Tests During the Public Health Emergency (Revised). May 11, 2020. Available from https://www.fda.gov/media/135659/download (Accessed Sept 15, 2020)
- 19.Clinical Laboratory Improvement Amendments (CLIA) Laboratory Director Responsibilities. Available from https://www.cms.gov/Regulations-and-Guidance/Legislation/CLIA/Downloads/brochure7.pdf.
- 20.Baratloo A, Hosseini M, Negida A, El Ashal G. Part 1: Simple Definition and Calculation of Accuracy, Sensitivity and Specificity. Emerg (Tehran). 2015;3(2):48-49. [PMC free article] [PubMed] [Google Scholar]
- 21.Mitchell SL, St George K, Rhoads DD, et al. Understanding, Verifying, and Implementing Emergency Use Authorization Molecular Diagnostics for the Detection of SARS-CoV-2 RNA. J Clin Microbiol. 2020;58(8): e00796-20. [DOI] [PMC free article] [PubMed] [Google Scholar]


