

Abstract
Background:
Ischemic and hypoxic secondary brain insults are common and detrimental in traumatic brain injury (TBI). Treatment aims to maintain an adequate cerebral blood flow with sufficient arterial oxygen content. It has been suggested that arterial hyperoxia may be beneficial to the injured brain to compensate for cerebral ischemia, overcome diffusion barriers, and improve mitochondrial function. In this study, we investigated the relation between arterial oxygen levels and cerebral energy metabolism, pressure autoregulation, and clinical outcome.
Methods:
This retrospective study was based on 115 patients with severe TBI treated in the neurointensive care unit, Uppsala university hospital, Sweden, 2008 to 2018. Data from cerebral microdialysis (MD), arterial blood gases, hemodynamics, and intracranial pressure were analyzed the first 10 days post-injury. The first day post-injury was studied in particular.
Results:
Arterial oxygen levels were higher and with greater variability on the first day post-injury, whereas it was more stable the following 9 days. Normal-to-high mean pO2 was significantly associated with better pressure autoregulation/lower pressure reactivity index (P = .02) and lower cerebral MD-lactate (P = .04) on day 1. Patients with limited cerebral energy metabolic substrate supply (MD-pyruvate below 120 µM) and metabolic disturbances with MD-lactate-/pyruvate ratio (LPR) above 25 had significantly lower arterial oxygen levels than those with limited MD-pyruvate supply and normal MD-LPR (P = .001) this day. Arterial oxygenation was not associated with clinical outcome.
Conclusions:
Maintaining a pO2 above 12 kPa and higher may improve oxidative cerebral energy metabolism and pressure autoregulation, particularly in cases of limited energy substrate supply in the early phase of TBI. Evaluating the cerebral energy metabolic profile could yield a better patient selection for hyperoxic treatment in future trials.
Keywords: autoregulation, energy metabolism, hyperoxia, neurointensive care, traumatic brain injury
Introduction
Ischemic and hypoxic secondary injury events are common in traumatic brain injury (TBI). 1,2 Maintaining an adequate cerebral blood flow (CBF) and delivery of oxygen is essential in TBI management. 3 Brain tissue oxygenation (pBtO2) below 20 to 29 mm Hg is associated with poor clinical outcome. 4,5 The pBtO2 correlates with regional CBF 6 and arterial oxygen content. 7 High intracranial pressure (ICP) and low cerebral perfusion pressure (CPP) are associated with low pBtO2, but most hypoxic insults occur in the absence of these predictors 4 and are probably caused by microvascular thrombosis or diffusion barriers such as cerebral edema. 8,9
Increasing the fraction of the inspired O2 (Fio 2), for example, by normobaric hyperoxia (NBO), in order to increase arterial and brain oxygenation, has been suggested as treatment for cerebral hypoxia in TBI. 10 The treatment may compensate for ischemic hypoxia, overcome cerebral diffusion barriers, and improve mitochondrial function, thereby improving oxidative cerebral energy metabolism and reducing secondary brain injuries. 2 Normobaric hyperoxia may increase pBtO2, 11 but the effect on cerebral energy metabolism is more controversial. Early cerebral microdialysis (MD) studies demonstrated decreased cerebral lactate following NBO treatment, but pyruvate also decreased and the lactate-/pyruvate-ratio (LPR) remained unchanged. 10,12 –15 However, other studies found that the hyperoxic effect depends on the current energy metabolic state, as hyperoxia was associated with improved cerebral metabolic rate of oxygen (CMRO2) in tissue at risk of ischemia 16 and improved LPR in tissue with high cerebral lactate before treatment initiation. 17 Outcome studies using NBO protocols have shown equivocal results. 18,19 Spiotta et al found better clinical outcome for TBI patients treated with combined ICP-/pBtO2- versus ICP-oriented treatment alone, 18 whereas Martini et al found no difference in outcome in a similar study. 19 Thus, it is clear that hypoxia should be strictly avoided in TBI; however, the optimal (higher) pO2 level in certain situations needs to be studied further.
The link between CBF autoregulation and oxygenation also needs to be further explored in TBI patients. Cerebral blood flow is controlled by changes in arterial blood pressure, pCO2, pO2, and cerebral energy metabolism. 20 –23 Arterial hypoxia leads to increases in CBF by vasodilation, to maintain normal pBtO2. 24,25 This specific capacity can be estimated as the tissue oxygenation response (TOR), that is, the difference in increased pBtO2 compared to the arterial blood flow after an increase in Fio 2. 26 Tissue oxygenation response is low if the cerebral oxygen autoregulation is intact, that is, an increase in arterial oxygenation generates only a modest increase in pBtO2 due to cerebral autoregulation. The cerebral oxygen autoregulatory status, as assessed using TOR, correlates with cerebral pressure autoregulation (PRx) and clinical outcome. 27
In this study, we aimed to further elucidate the role of arterial oxygenation, incidence of hypoxia, and hyperoxia and the relation to cerebral energy metabolism, cerebrovascular reactivity, and clinical outcome in severe TBI. We hypothesized that arterial hypoxia would be disadvantageous and hyperoxia possibly beneficial in relation to these outcome measures.
Materials and Methods
Patients
Patients with severe TBI admitted to our neurointensive care (NIC) unit at the Department of Neurosurgery at the University Hospital in Uppsala, Sweden, 2008 to 2018 were eligible for this retrospective study. Of 1001 patients, those 115 patients with mechanical ventilation and monitoring of arterial blood pressure, ICP, arterial blood gas (ABG), and cerebral energy metabolism (using cerebral MD) that did not develop total brain infarction were included.
Patients were treated in accordance with our standardized ICP-oriented treatment protocol to avoid secondary insults. 28,29 Treatment goals were ICP ≤ 20 mm Hg, CPP ≥ 60 mm Hg, systolic blood pressure > 100 mm Hg, central venous pressure 0 to 5 mm Hg, pO2 > 12 kPa, arterial glucose 5 to 10 mmol/L (mM), hemoglobin (Hb) > 100 g/L, electrolytes within normal ranges, normovolemia and body temperature <38 °C. Patients were initially mildly hyperventilated (4.0-4.5 kPa) and normoventilated as soon as ICP allowed.
Data Acquisition and Analysis
Intracranial pressure was monitored with either an intraparenchymal sensor device (Codman ICP Micro-Sensor, Codman & Shurtleff) or an intraventricular catheter (HanniSet, Xtrans, Smith Medical GmbH) with the tip in the frontal horn. Arterial blood pressure was measured invasively in the radial artery at heart level. Arterial blood gas data were generally analyzed in samples taken through the radial arterial line every fourth hour, more often if needed. Arterial blood gas samples were analyzed on an ABL800 FLEX instrument (Radiometer), running automatic calibrations every fourth hour and internal quality control samples twice daily. In addition, an external quality control program with monthly control samples administered by the accredited clinical chemistry laboratory at Uppsala university hospital was used. The physiological calculations mentioned below were done in the Odin software. 30 Pressure reactivity index, traditionally calculated as the 5-minute correlation of 10-second averages of ICP and MAP, 31 was used in combination with a bandpass filter, limiting the analysis to oscillations with periods of 15 to 55 seconds (PRx55-15). 32,33
For MD, we used the 71 High Cut-Off Brain Microdialysis Catheter with a membrane length of 10 mm and a membrane cutoff of 100 kDa (M Dialysis). The MD catheter was placed in normal-appearing brain tissue in the right frontal lobe, adjacent to the ICP monitor. The catheters were perfused with a microinjection pump (106 MD Pump, M Dialysis) at a rate of 0.3 µL/min using custom made sterile artificial cerebrospinal fluid containing—NaCl 147 mmol/L (mM), KCl 2.7 mM, CaCl2 1.2 mM, MgCl2 0.85 mM and 1.5% human albumin. Cerebral interstitial glucose, lactate, pyruvate, and urea were measured hourly, with the CMA 600 analyzer or the ISCUSflex Microdialysis Analyzer (M Dialysis). The cerebral MD-urea was monitored to validate catheter performance. 34 The analyzers were automatically calibrated when started, as well as every sixth hour using standard calibration solutions from the manufacturer (M Dialysis). Quality controls were performed every weekday at 2 different concentrations for each substance (CMA 600 and ISCUSflex). Total imprecision coefficient of variation was <10% for all analytes. The correlation between CMA600 and ISCUSflex data was found to allow for direct comparisons of patient data. 35
Outcome
Clinical outcome was assessed at 6 months post-injury, by specially trained personnel with structured telephone interviews, using the Extended Glasgow Outcome Scale (GOS-E), containing 8 categories of global outcome, from death to upper good recovery. 36 –38
Statistical Analysis
The temporal course of pO2, Fio 2, and Hb was calculated for each patient the first 10 days post-injury. Similarly, the percentage (%) of ABGs below our oxygenation target (pO2 < 12 kPa), hyperoxia (pO2 > 20 kPa), and anemia (Hb < 100 g/L) was calculated. The calculation was based on the number of blood gases above/below those thresholds versus the total number of blood gases on the same day. Analysis of the first 10 days after injury (N = 115) showed that day 1 had the highest pO2, the greatest pO2-variability and the highest prevalence of anemia, and therefore we chose to focus on this dynamic day for further data analysis. The statistical analyses below were performed both with and without patients treated with decompressive craniectomy (DC) the first day post-injury.
Mean values were calculated for each patient the first day and the difference in mean values between day 2 and 1 (Δ(Day 2 − Day 1)) post-injury for pO2 (kPa), pO2 < 12 kPa (%),pO2 > 20 kPa (%),pCO2 (kPa), Fio 2 (%), Hb (g/L), ICP (mm Hg), CPP (mm Hg), PRx55-15, cerebral MD-glucose (mM), MD-pyruvate (µM), MD-lactate (mM), and MD-LPR in the software Odin. The mean values for ICP, CPP, and PRx55-15 were calculated using minute-by-minute data. The PRx55-15 was calculated minute-by-minute over a 5-minute moving window centered on the minute. The ABG parameters were analyzed approximately every fourth hour. The mean values of cerebral MD-glucose, pyruvate, lactate, and LPR were based on hourly analyses. All data were transferred to SPSS version 25 (IBM Corp) for further statistical analysis. We chiefly focused on pO2 as a measure of arterial oxygenation as this mean value carries more information than the percentage of hyperoxia/hypoxia. The Spearman correlation test was used to investigate the association between pO2 the first day post-injury with ICP, CPP, PRx55-15, cerebral MD-glucose, MD-lactate, MD-pyruvate, MD-LPR, and GOS-E. Similar correlation analyses were done using the (Δ(Day 2 − Day 1) values of the same variables. Those with missing values were excluded from the analyses. Multiple linear regression analyses were performed with PRx55-15 as the dependent variable for the first day post-injury and included the explanatory variables age, ICP, CPP, pCO2, and pO2. Differences in pO2 were evaluated in 4 patient groups that had complete data day 1 on pO2, cerebral pyruvate, and LPR (51 patients) in relation to their cerebral energy metabolic pattern (A) “Energy metabolic disturbances, limited substrate supply” (cerebral MD-LPR > 25 and MD-pyruvate < 120 µM, N = 4), (B) “Normal energy metabolism, limited substrate supply” (cerebral MD-LPR < 25 and MD-pyruvate < 120 µM, N = 21), (C) “Energy metabolic disturbances, normal substrate supply” (cerebral MD-LPR > 25 and MD-pyruvate > 120 µM, N = 6), and (D) “Normal energy metabolism, normal substrate supply” (cerebral MD-LPR < 25 and MD-pyruvate > 120 µM, N = 20). Group A versus B and C versus D were compared, respectively, with Student t tests. The cerebral MD-LPR threshold at 25 for metabolic disturbances was chosen in accordance with the consensus statement 2014. 39 The cerebral pyruvate threshold for limited energy substrate supply at 120 µM was chosen based on previous studies suggesting that this is the highest pyruvate value for ischemic and the lowest value for nonischemic cerebral conditions. 40,41 A P value <.05 was considered statistically significant.
Ethics
All procedures performed in the studies involving humans were in accordance with the ethical standards of the institutional and national research committee and with the 1964 Helsinki declaration and its later amendments. Written informed consent was obtained from all individual patients included in the study or their next of kin.
Results
Demographic and Physiological Data
Of the 115 TBI patients included in the study, the mean age was 43 (±20) years and 76% were male. Median Glasgow Coma Scale Motor (GCS M) score was 5 (interquartile range [IQR]: 4-5). Twenty-one percent had a pupillary abnormality (anisocoria and/or fixed reaction) at admission. Seventy-five percent had diffuse injury (Marshall grade I-IV) and 25% focal brain injury (evacuated mass lesion V or nonevacuated mass lesion VI) on the first computed tomography scan. One percent of the patients had an impression fracture, 6% epidural hemorrhage (EDH), 20% acute subdural hemorrhage (ASDH), 6% traumatic subarachnoid hemorrhage (SAH), 35% cerebral contusions, 16% diffuse axonal injuries (DAIs), and 16% mixed intracranial injuries. Thirty-three percent had a thoracic injury and 41% had other extracranial injuries (abdominal, pelvic, spine, or extremities). Only one patient had extensive bleeding. Eleven percent was treated with thiopental and 15% with DC. Mean days in respirator was 12 (±8) days and mean stay at the NIC unit was 13 (±12) days. Outcome data 6 months after injury showed a mortality rate of 8% and median GOS-E was 5 (IQR: 3-7). The physiological data are presented in Table 1.
Table 1.
Description of Arterial Blood Gases, Neurophysiological, and Neurochemical Parameters Day 1 and Δ(Day 2 − Day 1) Post-TBI.a
| Physiological Variables | Day 1 | Δ(Day 2 − Day 1) |
|---|---|---|
| PO2 (kPa) | 18 (±4) | −2 (±4) |
| pO2 < 12 kPa (%) | 7.9 (±15) | 5 (±16) |
| pO2 > 20 kPa (%) | 18 (±25) | −9 (±23) |
| SaO2 (%) | 99 (±1) | 0 (±1) |
| Fio 2 (%) | 38 (±7) | 1 (±8) |
| P/F (pO2/Fio 2) | 49 (±15) | −5 (±10) |
| Hb (g/L) | 113 (±17) | −4 (±11) |
| pCO2 (kPa) | 4.7 (±0.5) | 0.0 (±0.5) |
| ICP (mm Hg) | 10 (±7) | 2 (±4) |
| CPP (mm Hg) | 76 (±11) | −1 (±8) |
| PRx55-15 (coefficient) | 0.22 (±0.20) | −0.05 (±0.15) |
| Cerebral MD-glucose (mM) | 2.6 (±1.3) | −0.2 (±1.0) |
| Cerebral MD-pyruvate (µM) | 142 (±87) | 4 (±67) |
| Cerebral MD-lactate (mM) | 3.5 (±2.3) | 0.1 (±1.2) |
| Cerebral MD-LPR | 27 (±22) | −1 (±17) |
Abbreviations: CPP, cerebral perfusion pressure; ICP, intracranial pressure; LPR, lactate-/pyruvate ratio; MD, microdialysis; PRx, pressure autoregulation index; SD, standard deviation; TBI, traumatic brain injury.
a The values are given as mean (±SD) for all patients.
Arterial Oxygenation and Its Relation to Extracranial Injuries and Clinical Outcome
Mean arterial pO2 peaked the first day post-injury and gradually decreased (Figure 1). The percentage of ABGs with hyperoxia (pO2 > 20 kPa) decreased gradually, whereas the percentage of ABGs below our oxygen target (pO2 < 12 kPa) increased over the first 10 days. Fio 2 gradually increased over the 10 days. The mean Hb was higher the first day and then slightly lower, but stable and above 100 g/L (Figure 1). The percentage of Hb <100 g/L was higher on day 1 and gradually decreased thereafter. There was no association between mean pO2, Hb, and Fio 2 with thoracic or other extracranial injuries (data not shown). Mean pO2 events (% of ABGs) below 12 kPa or above 20 kPa on the first day post-injury did not correlate with clinical outcome (Table 2). Similarly, neither of these oxygen indices correlated with the length of stay at the NIC unit or number of days in respirator. Furthermore, there was still no correlation between mean pO2 and clinical outcome in any of the separate TBI subgroups based on injury type (impression fracture, EDH, ASDH, SAH, cerebral contusions, DAI, and mixed injuries, respectively).
Figure 1.

Arterial oxygenation—temporal course the first 10 days post-injury.
Table 2.
Arterial Oxygenation Day 1 Post-Injury—Relation to Intracranial Pressure Dynamics, Cerebral Energy Metabolism, and Clinical Outcome—Spearman Correlation Analyses.a
| Physiological Variables | Mean pO2 | pO2 < 12 kPa (%) | pO2 > 20 kPa (%) | |||
|---|---|---|---|---|---|---|
| r | P value | r | P value | r | P value | |
| ICP | −0.14 | .31 | −0.06 | .68 | −0.28 | .04 |
| CPP | −0.04 | .77 | 0.12 | .37 | 0.07 | .59 |
| PRx55-15 | −0.30 | .02 | 0.24 | .07 | −0.20 | .13 |
| Cerebral MD-glucose | −0.06 | .69 | 0.20 | .15 | −0.05 | .71 |
| Cerebral MD-pyruvate | −0.19 | .17 | 0.28 | .046 | −0.08 | .60 |
| Cerebral MD-lactate | −0.28 | .046 | 0.24 | .09 | −0.19 | .18 |
| Cerebral MD-LPR | −0.20 | .15 | 0.17 | .24 | −0.17 | .23 |
| GOS-E | −0.08 | .50 | 0.04 | .72 | −0.09 | .45 |
Abbreviations: CPP, cerebral perfusion pressure; GOS-E, Extended Glasgow Outcome Scale; ICP, intracranial pressure; MD, microdialysis; LPR, lactate-/pyruvate ratio; PRx, pressure autoregulation index.
a Arterial oxygenation versus MD variables (N = 51), neurophysiology (N = 57), and GOS-E (N = 67).
P-values in bold and italics were considered statistically significant.
Arterial Oxygenation and Cerebral Energy Metabolic Patterns
Higher mean arterial pO2 was significantly associated with lower cerebral MD-lactate (r = −0.28, P = .046; Figure 2A, Table 2). The mean pO2 did not correlate with the other energy metabolites (cerebral MD-glucose, MD-pyruvate, and MD-LPR; Table 2). The percentage of ABGs below our oxygen target 12 kPa was associated with higher cerebral MD-pyruvate (r = 0.28, P = .046; Figure 2B, Table 2). There was no significant correlation between the percentage of hyperoxia and the cerebral energy metabolites (Table 2). Similar correlation analyses using the Δ(Day 2 − Day 1) values did not reveal any significant associations between changes in arterial oxygen levels and cerebral energy metabolites. Exclusion of those patients treated with DC (n = 7) on the first day post-injury did not have any impact on the results.
Figure 2.
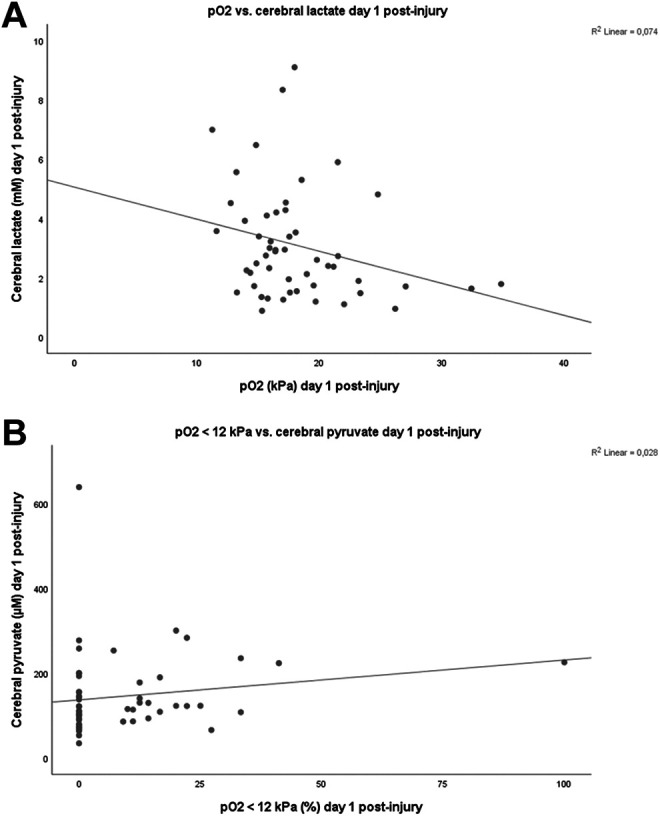
Arterial oxygenation and cerebral energy metabolism day 1 post-injury.
Patients (N = 51) were divided into 4 groups based on their metabolic pattern of mean MD and pO2 values for day 1 (Figure 3). The patients with a metabolic pattern of “energy metabolic disturbances and limited pyruvate supply” (cerebral MD-LPR > 25 and MD-pyruvate < 120 µM, N = 4) had significantly lower mean pO2 at 15 ± 1 kPa compared with those without metabolic disturbances but limited pyruvate supply (cerebral LPR < 25 and pyruvate < 120 µM, N = 21) at 20 ± 6 kPa (P = .001). Both of these groups had similar P/F (pO2/Fio 2)-ratios (43 ± 11 vs 57 ± 16, P = .10), GCS M at admission (4 ± 2 vs 5 ± 1, P = .69), and Marshall score (3 ± 1 vs 3 ± 1, P = .95). Furthermore, there was no significant difference in arterial oxygen levels between those with energy metabolic disturbances with limited substrate supply (LPR > 25 and pyruvate < 120) versus those with energy metabolic disturbances with normal substrate supply (LPR > 25 and pyruvate > 120; 15 ± 1 vs 16 ± 3 kPa, P = .40). Exclusion of those patients treated with DC on the first day post-injury did not have any impact on the results.
Figure 3.

Arterial oxygenation in relation to cerebral metabolic patterns day 1 post-injury.
Of those with a mean cerebral pyruvate below 120 µM and LPR above 25, all but one patient had a mean cerebral MD-glucose above 1 mM. None of these patients had an ICP > 20 mm Hg or CPP < 60 mm Hg. All patients had a mean Hb above 100 g/L. There was no significant difference in mean ICP, CPP, and pCO2 between those with low cerebral MD-pyruvate and normal versus elevated MD-LPR (data not shown).
Arterial Oxygenation and its Relation to ICP, CPP, and Pressure Reactivity
Although the mean pO2 or ABG events below our oxygen target did not correlate with ICP or CPP, higher percentage of hyperoxia day 1 was significantly associated with lower ICP (r = −0.28, P = .04; Table 2). Furthermore, the correlation analyses of the (Δ(Day 2 − Day 1) values showed that patients who had decreased percentage of pO2 > 20 kPa had a significantly higher ICP (r = −0.29, P = .03) and a significantly lower CPP (r = 0.28, P = .03) from day 1 to day 2 post-injury.
In addition, higher mean pO2 was significantly associated with lower PRx55-15 (r = −0.30, P = .02) day 1 post-injury (Figure 4). Similarly, the correlation analyses of the (Δ Day 2 − Day 1) values showed that those patients who had decreased in mean pO2 had significantly higher PRx55-15 (r = −0.37, P = .005) from day 1 to day 2 post-injury. However, the association between arterial oxygenation and PRx55-15 was not significant in the later course (Spearman correlation test of mean values day 2-5 and day 6-10, respectively). Exclusion of those patients treated with DC on the first day post-injury did not have any impact on the results.
Figure 4.

Arterial oxygenation and pressure reactivity.
In the multiple linear regression analysis for PRx55-15 (Table 3), including age, ICP, CPP, pCO2 and pO2, higher pO2 was marginally associated with lower PRx55-15 (P = .054).
Table 3.
Prediction of PRx55-15 Day 1 Post-Injury—A Multiple Linear Regression Analysis.a
| Physiological Variables | β | P value |
|---|---|---|
| Age | −0.08 | .60 |
| ICP | 0.22 | .20 |
| CPP | 0.02 | .93 |
| pO2 | −0.27 | .054 |
| pCO2 | 0.18 | .17 |
Abbreviations: ANOVA, analysis of variance; CPP, cerebral perfusion pressure; ICP, intracranial pressure; PRx, pressure autoregulation index.
a N = 56, R 2 = 0.19, ANOVA of the regression, P = .05.
Discussion
In this retrospective study including 115 patients with severe TBI, we found that high mean arterial pO2 was associated with better PRx55-15 and improved oxidative cerebral energy metabolism on the first day post-injury. In TBI patients with a cerebral metabolic pattern indicative of limited pyruvate supply, those with preserved oxidative energy metabolism (normal cerebral MD-LPR) had significantly higher arterial oxygen (20 vs 15 kPa) than those with energy disturbances (elevated MD-LPR). This suggests that TBI patients with disturbed energy metabolism with limited cerebral MD-pyruvate may benefit from a higher pO2-threshold than 12 kPa in early TBI management, although prospective studies are needed to validate this.
Arterial Oxygen and Cerebral Energy Metabolism
Cerebral ischemia and hypoxia are common secondary insults following severe TBI. 42,43 Optimizing cerebral oxygen delivery by maintaining adequate CBF and arterial oxygen pressure has been discussed extensively the last decades. 2 This has traditionally been achieved by CPP-oriented treatment protocols to increase CBF 44 and maintaining arterial oxygen content sufficient by keeping Hb above 70 to 100 g/L together with normal saturation. 28,45 More recently, NBO treatment has been suggested to compensate for cerebral ischemic hypoxia, overcome diffusion barriers from cerebral edema, and to improve mitochondrial function in TBI. 2
The benefits of NBO are debated. 2 Diringer et al found no global cerebral improvement in CMRO2 following NBO, 46 whereas Nortje et al found increased CMRO2 in ischemic regions. 16 Furthermore, many energy metabolic studies have found reductions in cerebral lactate following NBO, but no improvement in MD-LPR. 10,12 –15 However, another study found that the beneficial effect of hyperoxia depends on the concurrent cerebral energy metabolic state, as improvements in oxidative energy metabolism were only seen in cases of high cerebral MD-lactate before treatment initiation. 17 Similar to these previous studies, 10,12 –15 our patients who had higher mean arterial oxygen levels had lower cerebral lactate (Figure 2A) and those with higher percentage of ABGs with pO2 < 12 kPa had higher cerebral MD-pyruvate levels (Figure 2B), possibly as glycolytic enzymes were upregulated due to hypoxia. The correlation between arterial oxygenation and MD-LPR was modest and nonsignificant, but similar to Vilalta et al, 17 improvements in oxidative energy metabolism from higher pO2 could be seen under certain circumstances in our study. Our patients with normal oxidative cerebral energy metabolism (MD-LPR below 25) with concurrently low cerebral pyruvate, indicative of limited substrate supply, 41,47 had significantly higher arterial oxygen levels compared with those with limited substrate supply and deranged oxidative energy metabolism (Figure 3). However, there was no significant difference in P/F-ratio between the groups, indicating that pO2 rather than lung injury could explain this association and that TBI patients with limited energy substrate supply could benefit from higher oxygen levels. No patient with limited substrate supply had concurrent ICP above 20 mm Hg or CPP below 60 mm Hg and anemia and cerebral MD-glucose below 1 mM were uncommon. This indicates that macrovascular ischemia and arterial oxygen content were usually not the cause of the metabolic disturbances. Instead, microvascular disturbances, diffusion limitation, and hypermetabolism seem more plausible. 9 Furthermore, it has been suggested that arterial hyperoxia could be beneficial in case of mitochondrial dysfunction, but we did not find any difference in arterial oxygenation between the patient groups with normal cerebral MD-pyruvate supply with either normal versus disturbed oxidative energy metabolic state (low/high MD-LPR). However, it is difficult to evaluate the energy metabolic effects of different oxygen levels from this analysis, since the extent of mitochondrial injury in each group is unknown and probably differ. It would be better to evaluate the effect of arterial oxygenation prospectively in future trials with a hyperoxic challenge in patients with a metabolic pattern indicative of mitochondrial failure.
Arterial Oxygen and Cerebral Autoregulation
Cerebral autoregulation may become dysregulated in TBI and this is associated with poor outcome. 31 The cerebral vasoresponse to various regulators such as arterial blood pressure, pCO2, and cerebral energy metabolism represent the general health of the vessels and intact vessel response to one of these regulators usually corresponds to intact vessel response to the other regulators. 20 It is well known that arterial hyperoxia generates an autoregulatory reduction in CBF to maintain a normal pBtO2 24,25 and this has been further elaborated in the NIC setting by, for example, evaluating the cerebral TOR to an increase in Fio 2. Tissue oxygenation response is highly correlated with PRx, 27 indicating that these indexes evaluate different but still common aspects of general cerebral autoregulation. In this study, we found that higher arterial oxygen levels were associated with better pressure reactivity (Tables 2 and 3). Hypoperfusion and pressure passive cerebral vessels is a well-known complication the first day following severe TBI and increased vascular tone following hyperoxia could then improve general cerebral vasoreactivity. 48,49 This highlights that autoregulatory-oriented therapy not only includes CPP and PRx but rather is multidimensional and could be improved by optimal arterial oxygenation. However, the association between arterial oxygenation and PRx55-15 was not significant in the later acute course post-injury. It is possible that the pO2-variation in the later course post-injury (Figure 1) was too small to detect any difference of arterial oxygenation on PRx55-15 or temporal differences in vessel response to arterial oxygen.
Arterial Oxygenation in Relation to Clinical Outcome
Too low and too high arterial oxygen levels have been shown to be associated with worse outcome following TBI. 50 –52 Furthermore, low pBtO2 has also been found to correlate with worse outcome. 4,5 Although we did not find any correlation between higher arterial oxygen levels the first day post-injury and better clinical outcome, we did find correlated improvements in PRx55-15 and oxidative cerebral energy metabolism. Possibly, the primary brain injury and other secondary insults had greater impact, confounding any impact on functional recovery as measured using GOS-E. Alali et al 52 found that modest arterial hyperoxia (20-25 kPa) day 1 post-injury was associated with favorable clinical outcome in a study including 417 patients, indicating that our study may be underpowered to detect a small, but significant, effect of arterial hyperoxia on outcome.
Limitations
First, although pO2 and pBtO2 are correlated, we lacked sufficient data regarding cerebral oxygenation to evaluate the relation between pO2, pBtO2, and cerebral energy metabolism. Second, the number of patients with energy metabolic disturbances (MD-LPR > 25) was low, limiting the reliability of the analysis in Figure 3. Third, the associations between arterial oxygen levels and cerebral energy metabolism and PRx55-15 were weak, indicating that other factors could be more important. Fourth, the physiological variables were measured over different time intervals, for example, PRx55-15 (minute-by-minute), cerebral energy metabolism (every hour), and ABGs (every fourth hour). Considering the complexity of the data regarding differences in the frequency of measurements and for what time duration each measurement is relevant, we evaluated averaged values over 24 hours to determine the correlation of the total exposure of various physiological variables. Measures of energy metabolism minute-by-minute may be more time-compatible with the other physiological measures (PRx55-15/ICP and SaO2) and could in the future help determine the correlation between these physiological variables with higher resolution. There is also a need for prospective trials to better study the intraindividual neurophysiological response to hyperoxia. Fifth, the association between arterial oxygen levels and cerebral energy metabolism may be confounded by other important variables such as injury severity. However, we found no association between thoracic/extracranial injuries and arterial oxygen content indices.
Conclusions
Higher mean arterial oxygen levels the first day post-injury in severe TBI patients was associated with better PRx55-15 and improved oxidative cerebral energy metabolism. Particularly, patients with a cerebral metabolic profile indicative of limited energy substrate supply could benefit from higher arterial oxygen levels in the early phase of TBI. Furthermore, arterial oxygen may be used to optimize cerebral vasoreactivity and hence used in an integrated autoregulatory-oriented treatment regime. Future prospective studies are needed to determine whether there is a causal relationship of arterial hyperoxia in relation to autoregulation, cerebral energy metabolism, and clinical outcome.
Acknowledgment
The authors express their gratitude to Inger Ståhl-Myllyaho for technical assistance with the cerebral microdialysis.
Footnotes
Declaration of Conflicting Interests: The author(s) declared no potential conflicts of interest with respect to the research, authorship, and/or publication of this article.
Funding: The author(s) disclosed receipt of the following financial support for the research, authorship, and/or publication of this article: The study was supported financially by the Uppsala University Hospital (ALF grant, ie, Swedish Research Council funding for clinical research in medicine). The data for this manuscript can be accessed upon request.
ORCID iD: Teodor Svedung Wettervik, MD  https://orcid.org/0000-0002-4556-5721
References
- 1. Graham DI, Adams JH. Ischaemic brain damage in fatal head injuries. Lancet. 1971;1(7693):265–266. [DOI] [PubMed] [Google Scholar]
- 2. Diringer MN, Zazulia AR, Powers WJ. Does ischemia contribute to energy failure in severe TBI? Transl Stroke Res. 2011;2(4):517–523. [DOI] [PubMed] [Google Scholar]
- 3. Carney N, Totten AM, O’Reilly C, et al. Guidelines for the management of severe traumatic brain injury, Fourth Edition. Neurosurgery. 2017;80(1):6–15. [DOI] [PubMed] [Google Scholar]
- 4. Chang JJ, Youn TS, Benson D, et al. Physiologic and functional outcome correlates of brain tissue hypoxia in traumatic brain injury. Crit Care Med. 2009;37(1):283–290. [DOI] [PubMed] [Google Scholar]
- 5. Eriksson EA, Barletta JF, Figueroa BE, et al. The first 72 hours of brain tissue oxygenation predicts patient survival with traumatic brain injury. J Trauma Acute Care Surg. 2012;72(5):1345–1349. [DOI] [PubMed] [Google Scholar]
- 6. Jaeger M, Soehle M, Schuhmann MU, Winkler D, Meixensberger J. Correlation of continuously monitored regional cerebral blood flow and brain tissue oxygen. Acta Neurochir (Wien). 2005;147(1):51–56. [DOI] [PubMed] [Google Scholar]
- 7. Rosenthal G, Hemphill JC, III, Sorani M, et al. Brain tissue oxygen tension is more indicative of oxygen diffusion than oxygen delivery and metabolism in patients with traumatic brain injury. Crit Care Med. 2008;36(6):1917–1924. [DOI] [PubMed] [Google Scholar]
- 8. Veenith TV, Carter EL, Geeraerts T, et al. Pathophysiologic mechanisms of cerebral ischemia and diffusion hypoxia in traumatic brain injury. JAMA Neurol. 2016;73(5):542–550. [DOI] [PubMed] [Google Scholar]
- 9. Lazaridis C. Cerebral oxidative metabolism failure in traumatic brain injury: “Brain shock”. J Crit Care. 2017;37:230–233. [DOI] [PubMed] [Google Scholar]
- 10. Tolias CM, Reinert M, Seiler R, Gilman C, Scharf A, Bullock MR. Normobaric hyperoxia-induced improvement in cerebral metabolism and reduction in intracranial pressure in patients with severe head injury: a prospective historical cohort-matched study. J Neurosurg. 2004;101(3):435–444. [DOI] [PubMed] [Google Scholar]
- 11. Rosenthal G, Hemphill JC, Sorani M, et al. The role of lung function in brain tissue oxygenation following traumatic brain injury. J Neurosurg. 2008;108(1):59–65. [DOI] [PubMed] [Google Scholar]
- 12. Magnoni S, Ghisoni L, Locatelli M, et al. Lack of improvement in cerebral metabolism after hyperoxia in severe head injury: a microdialysis study. J Neurosurg. 2003;98(5):952–958. [DOI] [PubMed] [Google Scholar]
- 13. Menzel M, Doppenberg EM, Zauner A, Soukup J, Reinert MM, Bullock R. Increased inspired oxygen concentration as a factor in improved brain tissue oxygenation and tissue lactate levels after severe human head injury. J Neurosurg. 1999;91(1):1–10. [DOI] [PubMed] [Google Scholar]
- 14. Reinert M, Barth A, Rothen HU, Schaller B, Takala J, Seiler RW. Effects of cerebral perfusion pressure and increased fraction of inspired oxygen on brain tissue oxygen, lactate and glucose in patients with severe head injury. Acta Neurochir (Wien). 2003;145(5):341–350. [DOI] [PubMed] [Google Scholar]
- 15. Reinert M, Schaller B, Widmer HR, Seiler R, Bullock R. Influence of oxygen therapy on glucose-lactate metabolism after diffuse brain injury. J Neurosurg. 2004;101(2):323–329. [DOI] [PubMed] [Google Scholar]
- 16. Nortje J, Coles JP, Timofeev I, et al. Effect of hyperoxia on regional oxygenation and metabolism after severe traumatic brain injury: preliminary findings. Crit Care Med. 2008;36(1):273–281. [DOI] [PubMed] [Google Scholar]
- 17. Vilalta A, Sahuquillo J, Merino MA, et al. Normobaric hyperoxia in traumatic brain injury: does brain metabolic state influence the response to hyperoxic challenge? J Neurotrauma. 2011;28(7):1139–1148. [DOI] [PMC free article] [PubMed] [Google Scholar]
- 18. Spiotta AM, Stiefel MF, Gracias VH, et al. Brain tissue oxygen-directed management and outcome in patients with severe traumatic brain injury. J Neurosurg. 2010;113(3):571–580. [DOI] [PubMed] [Google Scholar]
- 19. Martini RP, Deem S, Yanez ND, et al. Management guided by brain tissue oxygen monitoring and outcome following severe traumatic brain injury. J Neurosurg. 2009;111(4):644–649. [DOI] [PubMed] [Google Scholar]
- 20. Nordstrom CH, Messeter K, Sundbarg G, Schalen W, Werner M, Ryding E. Cerebral blood flow, vasoreactivity, and oxygen consumption during barbiturate therapy in severe traumatic brain lesions. J Neurosurg. 1988;68(3):424–431. [DOI] [PubMed] [Google Scholar]
- 21. Sjoberg F, Gustafsson U, Eintrei C. Specific blood flow reducing effects of hyperoxaemia on high flow capillaries in the pig brain. Acta Physiol Scand. 1999;165(1):33–38. [DOI] [PubMed] [Google Scholar]
- 22. Hoiland RL, Bain AR, Rieger MG, Bailey DM, Ainslie PN. Hypoxemia, oxygen content, and the regulation of cerebral blood flow. Am J Physiol Regul Integr Comp Physiol. 2016;310(5):R398–R413. [DOI] [PMC free article] [PubMed] [Google Scholar]
- 23. Johnston AJ, Steiner LA, Gupta AK, Menon DK. Cerebral oxygen vasoreactivity and cerebral tissue oxygen reactivity. Br J Anaesth. 2003;90(6):774–786. [DOI] [PubMed] [Google Scholar]
- 24. Kety SS, Schmidt CF. The effects of altered arterial tensions of carbon diozide and oxygen on cerebral blood flow and cerebral oxygen consumption of normal young men. J Clin Invest. 1948;27(4):484–492. [DOI] [PMC free article] [PubMed] [Google Scholar]
- 25. Menzel M, Doppenberg EM, Zauner A, et al. Cerebral oxygenation in patients after severe head injury: monitoring and effects of arterial hyperoxia on cerebral blood flow, metabolism and intracranial pressure. J Neurosurg Anesthesiol. 1999;11(4):240–251. [DOI] [PubMed] [Google Scholar]
- 26. van Santbrink H, vd Brink WA, Steyerberg EW, Carmona Suazo JA, Avezaat CJ, Maas AI. Brain tissue oxygen response in severe traumatic brain injury. Acta Neurochir (Wien). 2003;145(6):429–438. [DOI] [PubMed] [Google Scholar]
- 27. Jaeger M, Lang EW. Cerebrovascular pressure reactivity and cerebral oxygen regulation after severe head injury. Neurocrit Care. 2013;19(1):69–73. [DOI] [PubMed] [Google Scholar]
- 28. Elf K, Nilsson P, Enblad P. Outcome after traumatic brain injury improved by an organized secondary insult program and standardized neurointensive care. Crit Care Med. 2002;30(9):2129–2134. [DOI] [PubMed] [Google Scholar]
- 29. Wettervik TS, Lenell S, Nyholm L, Howells T, Lewen A, Enblad P. Decompressive craniectomy in traumatic brain injury: usage and clinical outcome in a single centre. Acta Neurochir (Wien). 2018;160(2):229–237. [DOI] [PMC free article] [PubMed] [Google Scholar]
- 30. Howells T, Elf K, Jones PA, et al. Pressure reactivity as a guide in the treatment of cerebral perfusion pressure in patients with brain trauma. J Neurosurg. 2005;102(2):311–317. [DOI] [PubMed] [Google Scholar]
- 31. Czosnyka M, Smielewski P, Kirkpatrick P, Laing RJ, Menon D, Pickard JD. Continuous assessment of the cerebral vasomotor reactivity in head injury. Neurosurgery. 1997;41(1):11–19. [DOI] [PubMed] [Google Scholar]
- 32. Howells T, Johnson U, McKelvey T, Enblad P. An optimal frequency range for assessing the pressure reactivity index in patients with traumatic brain injury. J Clin Monit Comput. 2015;29(1):97–105. [DOI] [PubMed] [Google Scholar]
- 33. Svedung Wettervik T, Howells T, Enblad P, Lewen A. Temporal neurophysiological dynamics in traumatic brain injury: role of pressure reactivity and optimal cerebral perfusion pressure for predicting outcome. J Neurotrauma. 2019;36(11):1818–1827. [DOI] [PubMed] [Google Scholar]
- 34. Ronne-Engström E, Cesarini KG, Enblad P, et al. Intracerebral microdialysis in neurointensive care: the use of urea as an endogenous reference compound. J Neurosurg. 2001;94(3):397–402. [DOI] [PubMed] [Google Scholar]
- 35. Marklund N, Farrokhnia N, Hanell A, et al. Monitoring of beta-amyloid dynamics after human traumatic brain injury. J Neurotrauma. 2014;31(1):42–55. [DOI] [PubMed] [Google Scholar]
- 36. Teasdale GM, Pettigrew LE, Wilson JL, Murray G, Jennet B. Analyzing outcome of treatment of severe head injury: a review and update on advancing the use of the Glasgow Outcome Scale. J Neurotrauma. 1998;15(8):587–597. [DOI] [PubMed] [Google Scholar]
- 37. Wilson JL, Pettigrew LE, Teasdale GM. Structured interviews for the Glasgow Outcome Scale and the extended Glasgow Outcome Scale: guidelines for their use. J Neurotrauma. 1998;15(8):573–585. [DOI] [PubMed] [Google Scholar]
- 38. Nyholm L, Howells T, Enblad P, Lewén A. Introduction of the Uppsala Traumatic Brain Injury register for regular surveillance of patient characteristics and neurointensive care management including secondary insult quantification and clinical outcome. Ups J Medical Sci. 2013;118(3):169–180. [DOI] [PMC free article] [PubMed] [Google Scholar]
- 39. Hutchinson PJ, Jalloh I, Helmy A, et al. Consensus statement from the 2014 international microdialysis forum. Intensive Care Med. 2015;41(9):1517–1528. [DOI] [PMC free article] [PubMed] [Google Scholar]
- 40. Reinstrup P, Ståhl N, Mellergård P, Uski T, Ungerstedt U, Nordström C-H. Intracerebral microdialysis in clinical practice: baseline values for chemical markers during wakefulness, anesthesia, and neurosurgery. Neurosurgery. 2000;47(3):701–710. [DOI] [PubMed] [Google Scholar]
- 41. Schulz MK, Wang LP, Tange M, Bjerre P. Cerebral microdialysis monitoring: determination of normal and ischemic cerebral metabolisms in patients with aneurysmal subarachnoid hemorrhage. J Neurosurg. 2000;93(5):808–814. [DOI] [PubMed] [Google Scholar]
- 42. Coles JP, Fryer TD, Smielewski P, et al. Defining ischemic burden after traumatic brain injury using 15O PET imaging of cerebral physiology. J Cereb Blood Flow Metab. 2004;24(2):191–201. [DOI] [PubMed] [Google Scholar]
- 43. Bouma GJ, Muizelaar JP, Stringer WA, Choi SC, Fatouros P, Young HF. Ultra-early evaluation of regional cerebral blood flow in severely head-injured patients using xenon-enhanced computerized tomography. J Neurosurg. 1992;77(3):360–368. [DOI] [PubMed] [Google Scholar]
- 44. Rosner MJ, Rosner SD, Johnson AH. Cerebral perfusion pressure: management protocol and clinical results. J Neurosurg. 1995;83(6):949–962. [DOI] [PubMed] [Google Scholar]
- 45. LeRoux P. Haemoglobin management in acute brain injury. Curr Opin Crit Care. 2013;19(2):83–91. [DOI] [PubMed] [Google Scholar]
- 46. Diringer MN, Aiyagari V, Zazulia AR, Videen TO, Powers WJ. Effect of hyperoxia on cerebral metabolic rate for oxygen measured using positron emission tomography in patients with acute severe head injury. J Neurosurg. 2007;106(4):526–529. [DOI] [PubMed] [Google Scholar]
- 47. Reinstrup P, Stahl N, Mellergard P, Uski T, Ungerstedt U, Nordstrom CH. Intracerebral microdialysis in clinical practice: baseline values for chemical markers during wakefulness, anesthesia, and neurosurgery. Neurosurgery. 2000;47(3):701–710. [DOI] [PubMed] [Google Scholar]
- 48. Martin NA, Patwardhan RV, Alexander MJ, et al. Characterization of cerebral hemodynamic phases following severe head trauma: hypoperfusion, hyperemia, and vasospasm. J Neurosurg. 1997;87(1):9–19. [DOI] [PubMed] [Google Scholar]
- 49. Wettervik TS, Howells T, Hillered L, et al. Mild hyperventilation in traumatic brain injury-relation to cerebral energy metabolism, pressure autoregulation, and clinical outcome [published online ahead of print]. World Neurosurg. 2020;133:e567–e575. [DOI] [PubMed] [Google Scholar]
- 50. Davis DP, Meade W, Sise MJ, et al. Both hypoxemia and extreme hyperoxemia may be detrimental in patients with severe traumatic brain injury. J Neurotrauma. 2009;26(12):2217–2223. [DOI] [PubMed] [Google Scholar]
- 51. Brenner M, Stein D, Hu P, Kufera J, Wooford M, Scalea T. Association between early hyperoxia and worse outcomes after traumatic brain injury. Arch Surg. 2012;147(11):1042–1046. [DOI] [PubMed] [Google Scholar]
- 52. Alali AS, Temkin N, Vavilala MS, et al. Matching early arterial oxygenation to long-term outcome in severe traumatic brain injury: target values. J Neurosurg. 2019;132(2):537–544. [DOI] [PubMed] [Google Scholar]