

Abstract
Gastric cancer is a widely geographically distributed malignancy with high prevalence, therefore being a serious health problem that needs standardized methods for early diagnosis and treatment. The aim of the study was to evaluate the correlation of some epidemiological and clinical data with the histological features. The study group was made up of 66 patients that underwent surgical removal of the gastric neoplasm, and the pathological exam showed the morphological features of the tumor, as well as the ones of the unaffected mucosal tissue. Topographically, the highest incidence of the tumor was registered in the gastric antrum, but in recent years, an increased incidence of the superior gastric pole localization was recorded. The macroscopic aspects reveal that the ulcerated type 2 Borrmann is the most frequent, and alongside type 3 Borrmann, the ulcer-infiltrative type represents most of the gastric antrum cancers. The analysis of the tumor invasion showed that most carcinomas underwent surgery when the tumor invaded the serosa (pT3) or even the perigastric tissues (pT4). In our research, we chose Goseki’s microscopic classification because of its best coverage of the histological heterogeneity of the gastric carcinomas, providing information about the percentage of the cellular and secretory differentiation with direct impact on the invasion of the tumor. In more than 70% of the cases, the patients showed lesions of severe chronic atrophic gastritis of the non-tumor mucosa. Lately, the incidence of Helicobacter pylori has been 5.5%, lower than indicated by mainstream literature. We observed that the incidence of type 3 incomplete intestinal metaplasia, as the most commonly involved factor in the etiopathogenesis of gastric neoplasms, was encountered in 36.3% of the cases, this percentage rising proportionally with age and being frequently associated with antrum tumors. In conclusion, the permanent analysis of the relation between epidemiological data and some histological features might be relevant for the characterization of the tumoral process or the non-tumor gastric mucosa, leading to an evaluation of the prognosis.
Keywords: gastric cancer, pathological correlation tumor, gastric mucosa, Goseki classification, prognosis
⧉ Introduction
Gastric cancer is one of the most severe widely spread malignancies, with a multifactorial etiology and a clinical and morphological multiform profile that coupled with a late diagnosis results in low life expectancy. Although, worldwidely, the gastric neoplasm displays a decreasing tendency, it still remains the fourth most frequent cancer and the second cause of death [1,2,3]. The reduction of the mortality rate in gastric cancer is the result of the application of medical strategies for the early detection of incipient tumor lesions or of premalignant gastric lesions [4,5,6].
Many studies showed that the greatest risk factor for non-cardiac gastric cancer is represented by the Helicobacter pylori infection [7,8,9,10]. The prevalence of the H. pylori infection is highly variable across countries, and even across regions in a country, raising to 70–90% in developing countries [11,12].
H. pylori infection occurs most commonly in childhood, has an intra-family transmission and, in most cases, it persists if not eliminated by treatment. As such, most researchers believe that according to the Kyoto Global Consensus Report, it is recommended that all infected patients should be treated, regardless of age, to prevent the development of gastric cancer [13,14].
The clinical and morphological multiform profile is influenced by the geographic distribution, lifestyle, genetic profile, localization of the gastric tumor – there is a more aggressive phenotype for the superior pole tumors with morphological heterogeneity of the same tumor or for different tumors, and also for diverse clinically non-specific tumors [15,16].
Currently, there are numerous classifications of the gastric neoplasm, each trying to establish o correlation between the clinical manifestations, histological features, evolution and etiopathogenesis of the tumor.
Aim
The present paper aims to analyze the possible relation between the epidemiological factors and some histopathological (HP) aspects that we consider relevant for either the characterization of the tumor or the unaffected gastric mucosa, all of them being likely to impact on the prognosis of the gastric cancer.
⧉ Patients, Materials and Methods
The research was conducted on a group of 66 gastric cancer patients hospitalized and operated within the Surgery Unit of the Railways Clinical Hospital, Craiova, Romania, between 2010–2015.
All the patients underwent excision surgery, regardless of the progression stage, preserving only cases of malignant epithelial tumors of the stomach.
In the target group, we excluded the carcinomas developed at the level of the esogastric junction and those of the gastric abutment. The gastrectomy specimens referred to the pathological anatomy laboratory were opened along the great curve.
After placed on a wooden plate, the pieces were fixed in a 10% neutral buffered formalin solution for about 24 hours.
After fixation, the specimens were oriented, obtaining multiple blocks.
Fragments of mucosa were collected from 1–2 cm and 4–5 cm away from the tumor to highlight the peritumoral lesions. Between 4–8 fragments were also collected from the passage area between the non-tumor mucosa and the tumor, as well as a variable number of fragments from the tumor, which would indicate the histological type, the depth of the invasion and other associated lesions.
After impregnation with paraffin, the blocks were sectioned into 5 μm-thick sections.
The sections were stained by various methods to highlight HP changes and detect H. pylori.
In most cases, the standard Hematoxylin–Eosin (HE) staining allows for the specification of the diagnosis, being capable of highlighting the histological traits of the lesions, the changes of the tissue architecture and the nucleo-cytoplasmic details.
On the HE staining, H. pylori with lower sensitivity can be highlighted in situations where the bacteria are very numerous in the mucus on the surface of the fovea.
Giemsa staining showed to be extremely useful for:
▪ highlighting the presence of H. pylori in the foveolar mucus, especially when bacterial colonization is reduced;
▪ featuring the morphological characteristics of the nuclei, especially the contour of the nuclear membrane, the chromatin densities and the appreciation of the characters of the nucleoli;
▪ the morphological assessment of cellular elements belonging to the intra- and peritumoral inflammatory reaction.
The Gömöri trichrome staining shows the arrangement and density of reticulin networks, being particularly useful for assessing aspects of tumor microinvasion and early changes in the basement membrane, knowing that there is a similarity between the arrangement of the basement membrane and fibronectin deposits.
Some sections were histochemically stained for mucin, such as Alcian Blue (AB) pH 2.5/Periodic Acid–Schiff (PAS) and AB pH 1/PAS, to detect neutral mucins (stained red), acidic mucins (sialomucins and sulfomucins) stained blue or purple.
The immunohistochemical staining was useful to highlight the severity of gastric mucosal dysplasia lesions by assessing the proliferation cell nuclear antigen (PCNA) expression index, mouse monoclonal antibody, clone PC10, Ig2a kappa isotype.
⧉ Results
Of the 66 patients included in the study, 51 (77.2%) were men aged between 30–77 years old and 15 (22.8%) women aged between 46–73 years old (Figures 1 and 2).
Figure 1.
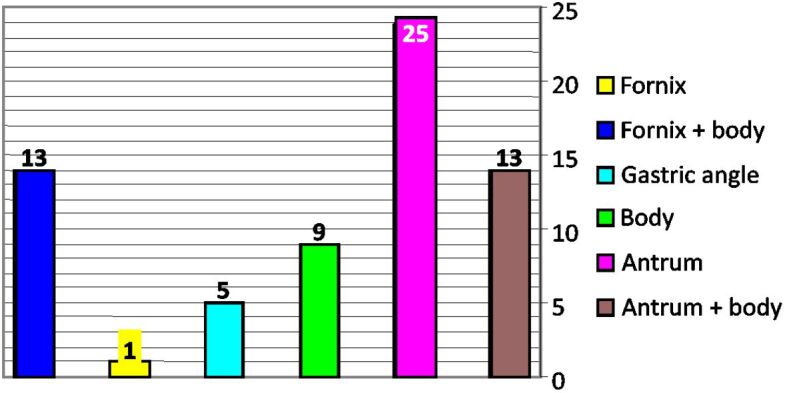
Distribution of gastric carcinoma cases by topography
Figure 2.
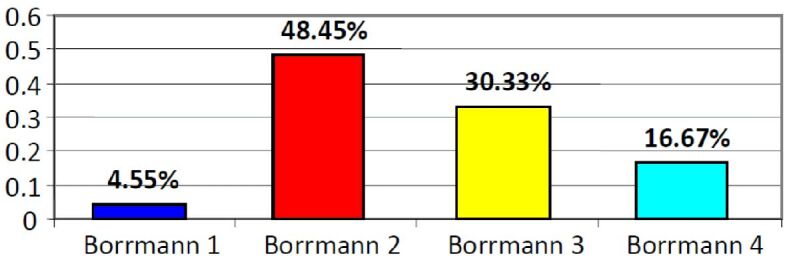
Distribution of gastric carcinoma cases by Borrmann types
The distribution of cases of gastric carcinoma by age group is presented in Table 1. Most patients (almost half of our group) were in the age group 60–69 years old, but gastric cancer can occur in patients aged 30 to 80 years old.
Table 1.
Distribution of cases of gastric carcinoma by age group
|
Age [years] |
Male (M) patients |
Female (F) patients |
M:F ratio |
|
30 |
1 |
0 |
Exclusively male patients |
|
31–39 |
3 |
0 |
Exclusively male patients |
|
40–49 |
2 |
1 |
2:1 |
|
50–59 |
11 |
3 |
3.6:1 |
|
60–69 |
25 |
8 |
3.1:1 |
|
70–77 |
9 |
3 |
3:1 |
|
Total |
51 |
15 |
3.4:1 |
The global distribution of cases of gastric carcinoma by localization is shown in Figure 1. It is observed that antral localizations with extension to the body of the stomach are the most common types [38 (57.5%) cases], while the upper polar localizations totalized 14 (21.28%) cases.
In both men and women, the most common localization is the antrum corresponding to the age range of 60–69 years old. All four cases of tumors occurring before the age of 40 were recorded in men.
The global distribution of gastric carcinoma cases by macroscopic criteria using Borrmann classification is presented in Figure 2. The most common morphological expression is represented by Borrmann type 2, which more often correlates with the age range 60–69 years old in patients with gastric carcinoma (24.25% of cases) – see Table 2.
Table 2.
Correlations between Borrmann microscopic type and patients’ age
|
Age [years] |
Borrmann 1 |
Borrmann 2 |
Borrmann 3 |
Borrmann 4 |
|
30 |
0 |
0 |
1 (1.52%) |
0 |
|
31–39 |
0 |
1 (1.52%) |
1 (1.52%) |
1 (1.52%) |
|
40–49 |
0 |
2 (3.03%) |
1(1.52%) |
0 |
|
50–59 |
0 |
7 (10.61%) |
5 (7.58%) |
2 (3.03%) |
|
60–69 |
4 (6.06%) |
16 (24.25%) |
8 (12.13%) |
5 (7.58%) |
|
70–77 |
0 |
5 (7.58%) |
3 (4.55%) |
4 (6.06%) |
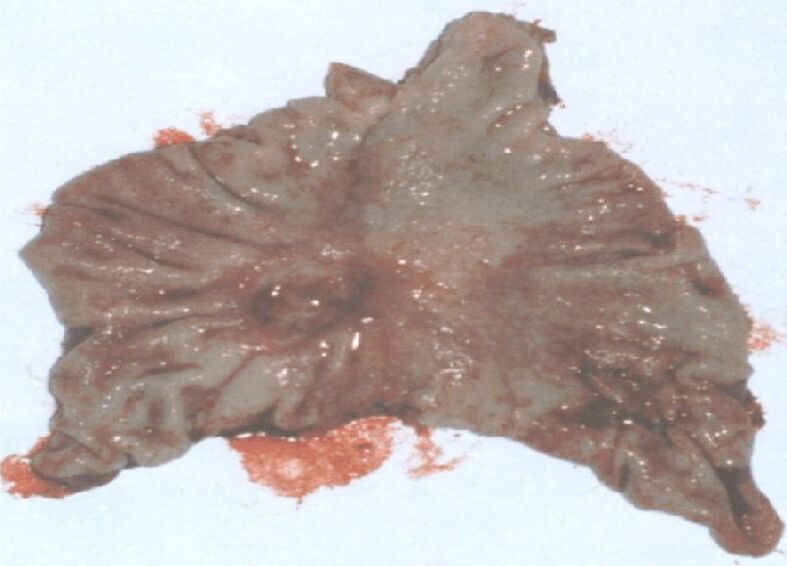
Below, we present some images of the surgical specimens belonging to the cases studied and which illustrate various macroscopic aspects (Figure 3).
Figure 3.
Gastric neoplasm of the vegetative body (type 1 Borrmann)
These tumors are initially vegetative (type 1 Borrmann), resembling either a multi nodular sessile polypoid or a group of several polypoid formations, of various sizes, most frequently sessile ones. Over time, these lesions undergo ulceration, turning into type 2 Borrmann, a vegetative ulcer.
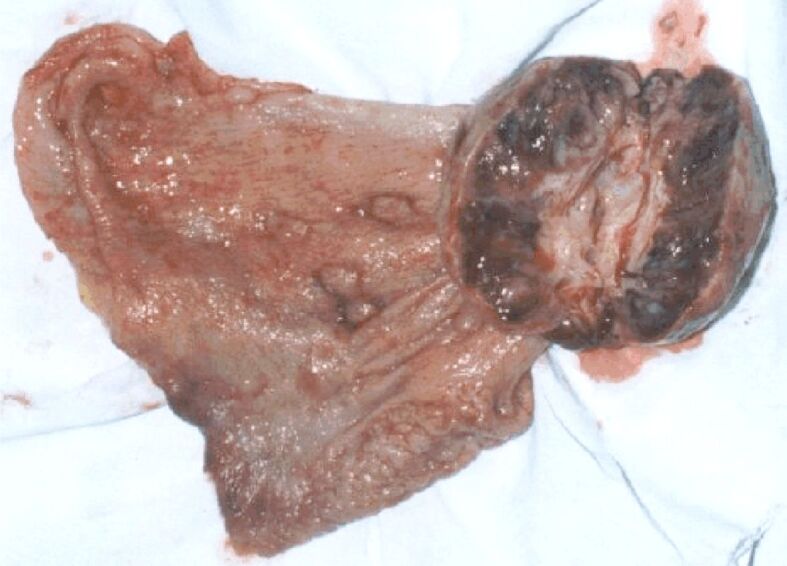
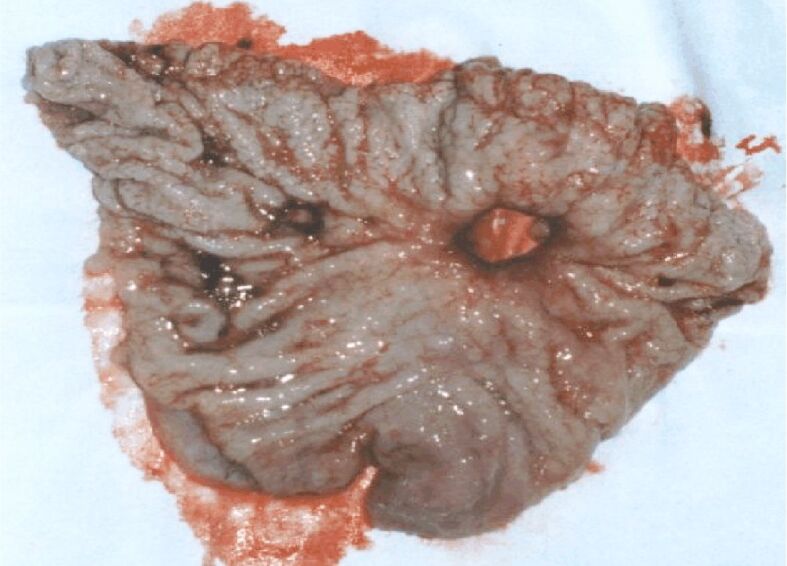
Figures 4 and 5 present two cases of gastric cancer of Borrmann type, antrally developed. In the first case (Figure 4), the ulcerated lesion shows characteristics similar to those of a gastric ulcer, developed in a 50-year-old patient who was hospitalized for clinical phenomena such as perforated ulcer. There is a crater with relatively straight edges and convergence of the mucosal folds. In the second case (Figure 5), in a 53-year-old man, the ulcerated lesion developed at the level of the gastric angle, showing macroscopic signs of malignancy: the edges of the ulceration are budded, irregular; the surrounding mucosa has an atrophic appearance, and the folds stop at a distance from the edges of the ulceration.
Figure 4.
Ulcerated antrum neoplasm (type 3 Borrmann)
Figure 5.
Ulcerated gastric angle neoplasm (type 3 Borrmann)
The staging classification of the studied group of patients reveals the predominance of cases of advanced stages (stages 3 and 4), which justifies the palliative nature of most of the surgeries performed (Table 3).
Table 3.
Staging classification of the cases in the studied group
|
Stage 1 – 0 (0%) cases |
|
Stage 2 – 7 (11%) cases |
|
Stage 3 – 42 (64%) cases |
|
Stage 4 – 17 (25%) cases |
The distribution of cases according to the level of tumor invasion (pT) is shown in Figure 6, where it can be seen that the majority of cases belong to categories pT3 and pT4.
Figure 6.
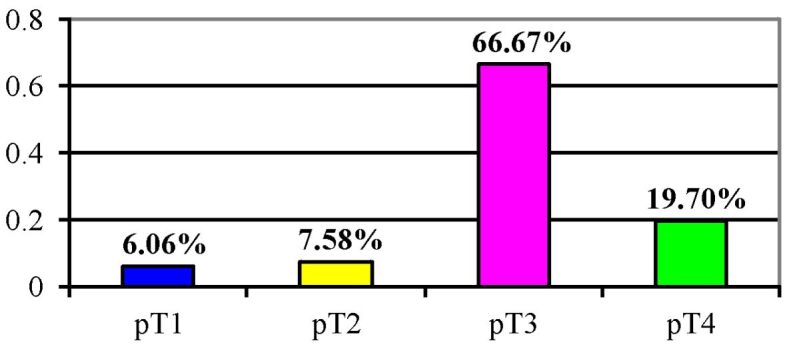
Distribution of gastric carcinoma cases according to the level of tumor invasion (pT)
The distribution of cases of gastric carcinoma according to the level of tumor invasion (pT) by age group is shown in Table 4.
Table 4.
Distribution of gastric carcinoma cases according to the level of tumor invasion (pT) by age group
|
Age [years] |
pT1 |
pT2 |
pT3 |
pT4 |
|
30 |
0 |
0 |
1 (1.52%) |
0 |
|
31–39 |
0 |
0 |
2 (3.03%) |
1 (1.52%) |
|
40–49 |
0 |
0 |
2 (3.03%) |
1 (1.52%) |
|
50–59 |
2 (3.03%) |
1 (1.52%) |
9 (13.68%) |
2 (3.03%) |
|
60–69 |
2 (3.03%) |
4 (6.06%) |
19 (28.88%) |
8 (12.16%) |
|
70–77 |
0 |
0 |
11 (16.72) |
1 (1.52%) |
In the age group 60–69 years old, where most cases are concentrated, we encounter the highest frequency in the pT3 category (28.88%).
The level of invasion according to topography is presented in Table 5.
Table 5.
Level of invasion according to topography
|
|
Fornix |
Fornix and body |
Body |
Gastric angle |
Antrum |
Antrum and body |
|
T1 |
0 |
0 |
1 (1.52%) |
0 |
3 (4.56%) |
0 |
|
T2 |
0 |
0 |
1 (1.52%) |
0 |
3 (4.56%) |
0 |
|
T3 |
8 (12.8%) |
0 |
5 (7.6%) |
5 (7.58%) |
15 (22.8%) |
10 (15.2%) |
|
T4 |
5 (7.58%) |
1 (1.52%) |
2 (3.04%) |
0 |
4 (5.08%) |
3 (4.56%) |
We note that no case of gastric carcinoma with high localization was detected in the early stage of the carcinoma. Most carcinomas were located antrally, in the pT3 stage (22.8%).
The examination of microscopic aspects, including both cellular differentiation and secretory differentiation, are performed using the Goseki system applied to our stage.
The distribution of cases in this system is shown in Figure 7.
Figure 7.
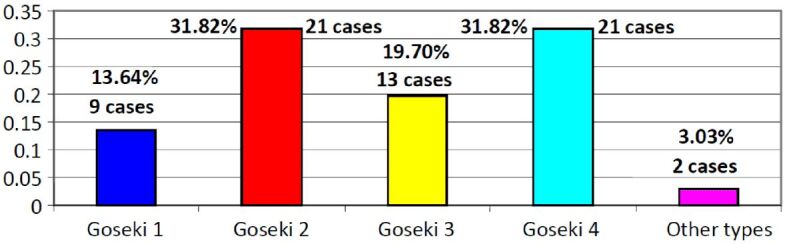
Distribution of gastric carcinoma cases according to microscopic criteria – Goseki classification
Thus, Goseki classes 2 and 4 appear in equal proportions, being the best represented (31.82%).
The distribution of Goseki types of gastric carcinoma, according to age and gender, is shown in Tables 6 and 7.
Table 6.
Distribution of Goseki microscopic types in women by age range
|
Age [years] |
Women |
Goseki 1 |
Goseki 2 |
Goseki 3 |
Goseki 4 |
|
30 |
0 |
0 |
0 |
0 |
0 |
|
31–39 |
0 |
0 |
0 |
0 |
0 |
|
40–49 |
1 |
0 |
0 |
1 (6.67%) |
0 |
|
50–59 |
3 |
0 |
0 |
1 (6.67%) |
2 (13.34%) |
|
60–69 |
8 |
1 (6.67%) |
3 (20.01%) |
2 (13.34%) |
2 (13.34%) |
|
70–77 |
3 |
1 (6.67%) |
0 |
1 (6.67%) |
1 (6.67%) |
Table 7.
Distribution of Goseki microscopic types in men by age range
|
Age [years] |
Men |
Goseki 1 |
Goseki 2 |
Goseki 3 |
Goseki 4 |
|
30 |
1 |
0 |
0 |
0 |
1 (1.96%) |
|
31–39 |
3 |
0 |
1 (1.96%) |
2 (3.92%) |
0 |
|
40–49 |
2 |
0 |
1 (1.96%) |
1 (1.96%) |
0 |
|
50–59 |
11 |
3 (5.88%) |
4 (7.84%) |
1 (1.96%) |
1 (1.96%) |
|
60–69 |
25 |
3 (5.88%) |
8 (15.68%) |
3 (5.88%) |
11 (21.57%) |
|
70–77 |
9 |
2 (3.92%) |
2 (3.92%) |
2 (3.92%) |
3 (5.88%) |
It can be observed that most cases in men (21.57%) belong to the age range of 60–69 years and Goseki class 4.
In women, the most numerous cases belong to the age group 60–69 years old, but the most common classes are Goseki class 2, followed by Goseki classes 3 and 4 in equal proportions.
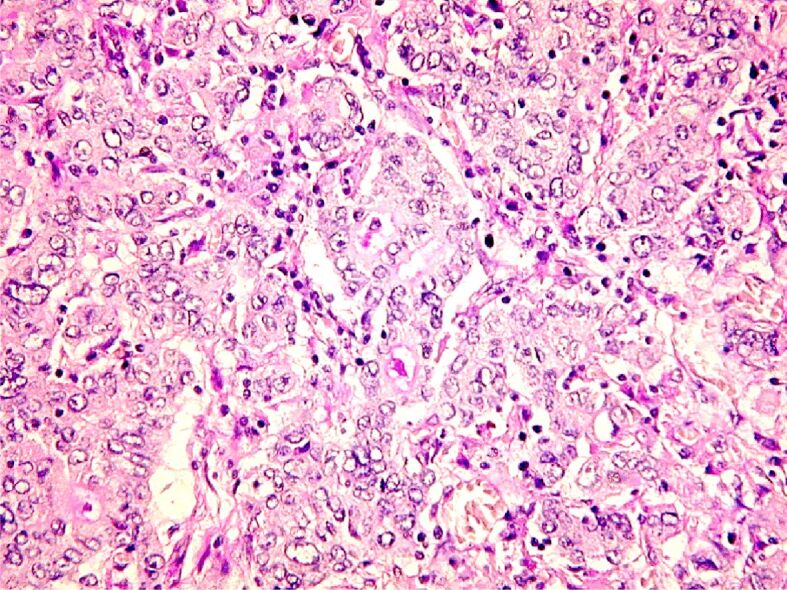
We present some HP aspects specific to the Goseki classes (Figures 8,9,10,11).
Figure 8.
Gastric carcinoma Goseki 1: good tubular differentiation and reduced secretory differentiation. PAS-H, staining, ×100
Figure 9.
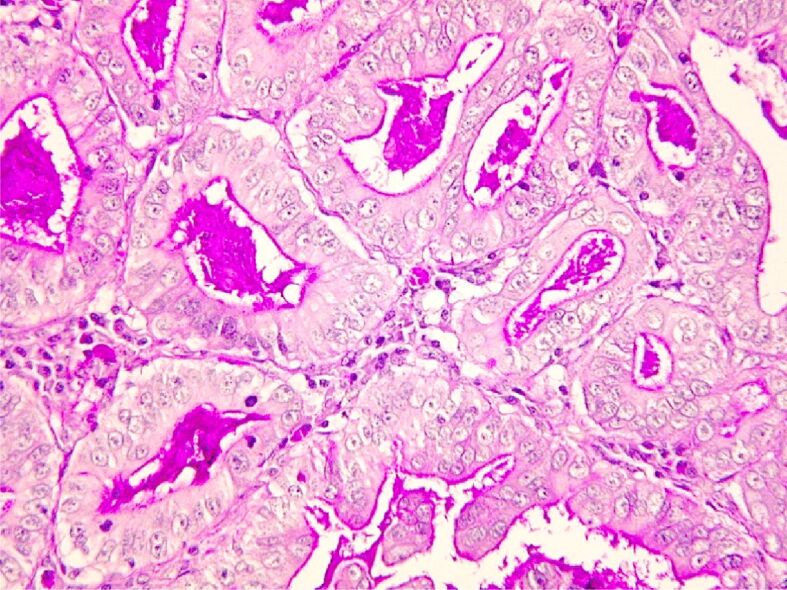
Gastric adenocarcinoma Goseki 2: good tubular and secretory differentiation. PAS-H staining, ×200
Figure 10.
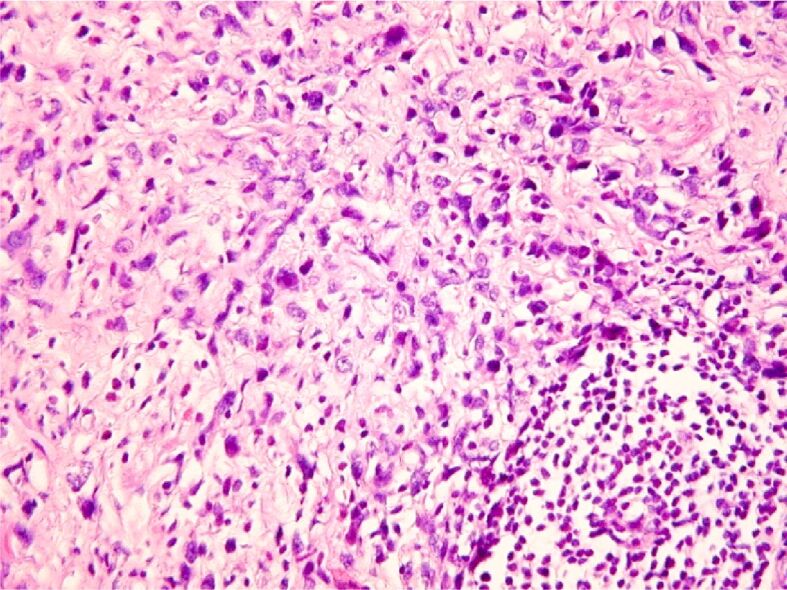
Gastric carcinoma, Goseki 3 areas: poorly tubular and secretory differentiation. HE staining, ×100
Figure 11.
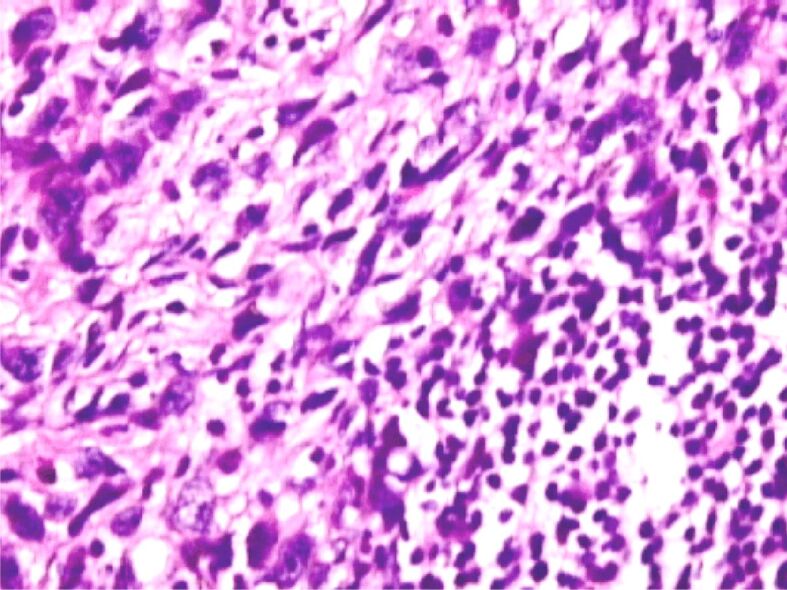
Carcinoma with cu signet ring cells, Goseki 4: poorly tubular differentiation (possible lack of tubular differentiation) and good secretory differentiation. HE staining, ×200
The correlation between the macroscopic aspects according to the Borrmann classification and the microscopic aspects according to the Goseki classification is presented in Table 8.
Table 8.
Correlation between the macroscopic aspects according to the Borrmann classification and the microscopic aspects according to the Goseki classification
|
|
Goseki 1 |
Goseki 2 |
Goseki 3 |
Goseki 4 |
|
Borrmann 1 |
2 (3.02%) |
2 (3.02%) |
0 |
0 |
|
Borrmann 2 |
4 (6.04%) |
16 (24.16%) |
6 (9.16%) |
5 (7.81%) |
|
Borrmann 3 |
3 (4.58%) |
4 (6.04%) |
4 (6.04%) |
8 (12.08%) |
|
Borrmann 4 |
0 |
0 |
4 (6.04%) |
8 (12.08%) |
It may be observed that the most common macroscopic type encountered Borrmann type 2 is very frequently associated with Goseki class 2, whereas Borrmann types 3 and 4 of gastric carcinoma belong to Goseki class 4.
In all the cases studied, we found that a process of chronic gastritis with varying degrees of atrophy occurs in the non-tumor gastric mucosa. Thus, Figure 12 shows the distribution of gastritis lesions depending on the intensity of the atrophy process.
Figure 12.
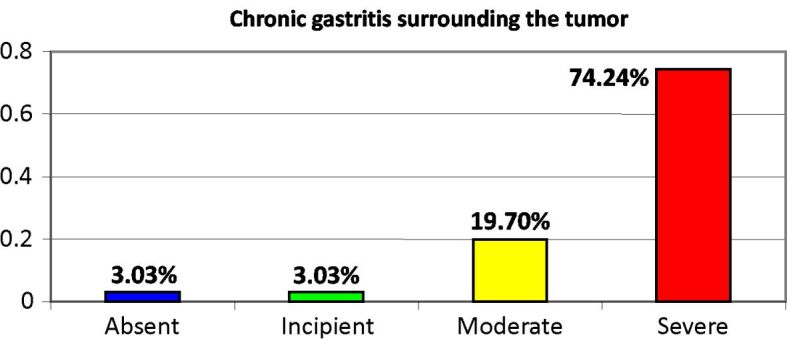
Presence of chronic atrophic gastritis lesions in the non-tumoral gastric mucosa
It is worth mentioning that most cases of gastric cancer (74.24%) developed against the background of lesions of severe chronic atrophic gastritis (Figures 13 and 14).
Figure 13.
Aspects of severe atrophic chronic gastritis associated with high-grade dysplasia lesions against a background of intestinal metaplasia. Exulcerations and extensive hemorrhagic suffusions in the chorion. HE staining, ×100
Figure 14.
Severe atrophic chronic gastritis. HE staining, ×100
The distribution of chronic atrophic gastritis lesions by Goseki classes is presented in Figure 15, and it is observed that most cases with severe atrophic gastritis (49%) are associated with Goseki class 4.
Figure 15.
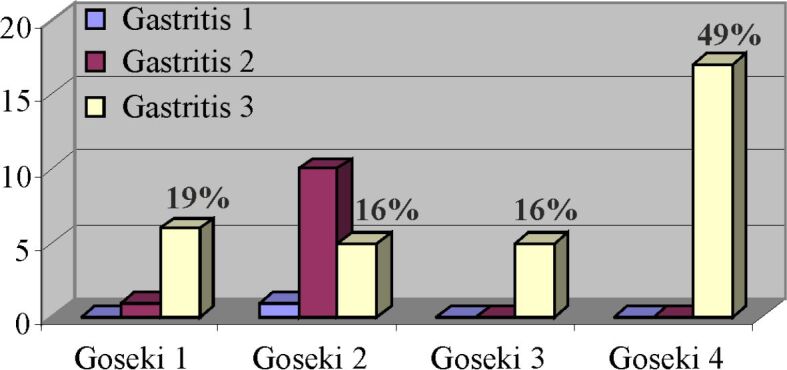
Correlation between cases of chronic atrophic gastritis and Goseki classes
Table 9 shows the association of various types of chronic atrophic gastritis with H. pylori infection, the absence of chronic atrophic gastritis lesions marking it by the indication gastritis 0, while the indications gastritis 1, 2 and 3 correspond to the incipient, moderate and severe forms.
Table 9.
Association of various types of chronic atrophic gastritis with H. pylori infection
|
Type of gastritis |
H. pylori positive |
H. pylori negative |
|
Gastritis 0 |
0 |
2 (3.04%) |
|
Gastritis 1 |
1 (1.52%) |
1 (1.52%) |
|
Gastritis 2 |
10 (15.15%) |
2 (3.04%) |
|
Gastritis 3 |
35 (53%) |
15 (22.73%) |
There is an increase recorded in the incidence of H. pylori germ infection as the degree of atrophy increases.
We also note the high percentage of negative H. pylori cases in cases of severe atrophic chronic gastritis. We consider that this percentage should be correlated with the topography of neoplastic lesions (upper polar cancers), age (patients less than 40 years old) and cases with extensive mucosal ulcerations.
Below, we present two images of a case in which the non-tumoral mucosa displays lesions of severe chronic atrophic gastritis, with a high degree of H. pylori activity (Figure 16, A and B).
Figure 16.

Severe chronic atrophic gastritis with a high degree of H. pylori activity: (A) H. pylori positive; (B) Details of the same case – the presence of numerous H. pylori-type germs in the foveolar mucus is observed. HE staining: (A) ×200; (B) ×400
Table 10 shows the percentage distribution of H. pylori infection in Goseki classes of gastric carcinoma. The analysis of the Table 10 shows that the highest incidence of H. pylori infection occurs in Goseki class 4, characterized by poorly secretory differentiation, while the lowest incidence of infection belongs to Goseki class 3 defined by a poorly differentiation, both tubular and secretory.
Table 10.
Correlation between Goseki classes of gastric carcinoma and the presence or absence of H. pylori infection
|
Goseki class |
H. pylori positive |
H. pylori negative |
|
1 |
77.79% |
22.23% |
|
2 |
76.20% |
23.81% |
|
3 |
38.47% |
61.55% |
|
4 |
80.96% |
19.05% |
The presence of intestinal metaplasia in the evolution of chronic gastritis was reported by different authors in various percentages.
Our research indicated that 42.42% of gastric carcinoma cases were not associated with lesions of intestinal metaplasia, in the remaining cases, the most common type of metaplasia being type III (colonic), a lesion considered to be a precursor of intestinal gastric cancers (Figure 17).
Figure 17.
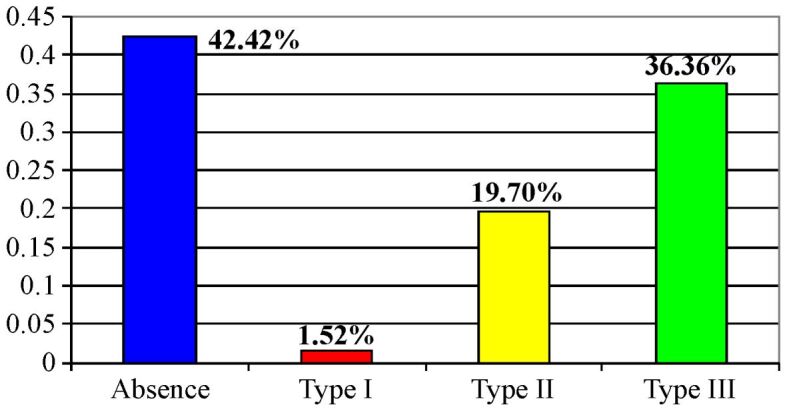
Distribution of the types of intestinal metaplasia in the studied cases
Figure 18A,18B,18C shows some HP aspects of various types of intestinal metaplasia.
Figure 18.

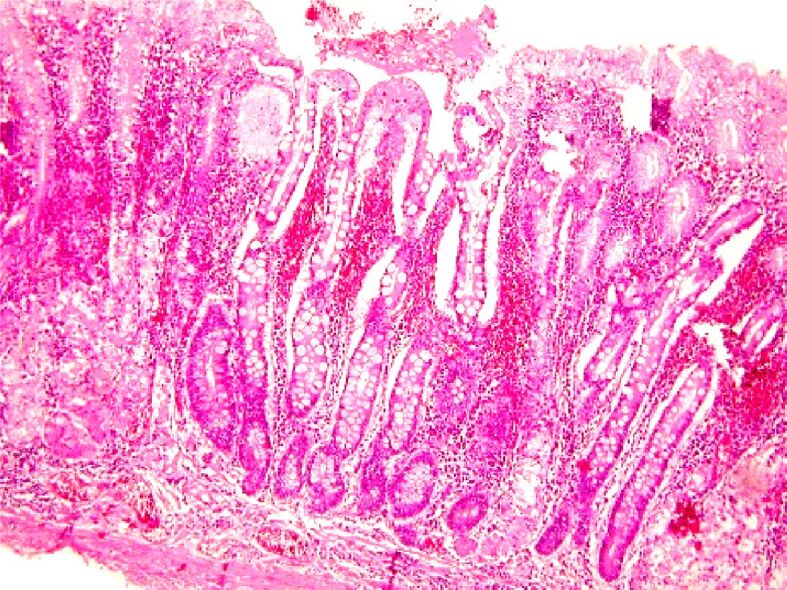
(A) Gastric mucosa at a distance from the tumor with lesions of intestinal metaplasia, developed against a background of severe atrophic chronic gastritis (HE staining, ×200); (B) The same case as in the previous image, indicating a sialomucin-rich content of mucus (Alcian Blue pH 2.5 staining, ×100); (C) The same case, in which the weak reaction of the foveolar mucus to the Alcian Blue pH 1 staining is observed (×200)
The distribution of the types of intestinal metaplasia by age group is shown in Table 11 [type I – complete intestinal metaplasia; type II – incomplete intestinal metaplasia (small intestine type); type III – incomplete intestinal metaplasia (colonic type)].
Table 11.
Distribution of types of intestinal metaplasia by age group
|
Age [years] |
Absence of metaplasia |
Metaplasia type 1 |
Metaplasia type 2 |
Metaplasia type 3 |
|
30 |
100% |
0 |
0 |
0 |
|
31–39 |
66% |
0 |
0 |
33% |
|
40–49 |
66% |
0 |
33% |
0 |
|
50–59 |
57% |
0 |
15% |
28% |
|
60–69 |
36% |
4% |
15% |
45% |
|
70–77 |
0 |
0 |
0 |
100% |
It may be observed that the absence of intestinal metaplasia is associated with significant percentages at a young age and that it significantly increases the form of intestinal metaplasia of the colonic type after the age of 60 years old. The absence of intestinal metaplasia in young patients is due to the relatively slow evolution of these types of lesions, which manifest after the age of 45 years old.
The correlation between the types of intestinal metaplasia and the topography of the neoplastic process is presented in Table 12. There is an increased incidence of intestinal metaplasia type III lesions in the distal topographies of neoplastic lesions.
Table 12.
Correlation between the types of intestinal metaplasia and the topography of the neoplastic process
|
|
Fornix |
Fornix and body |
Body |
Gastric angle |
Antrum |
Antrum and body |
|
Absence of metaplasia |
9 (13.68%) |
0 |
5 (7.6%) |
1 (1.52%) |
6 (9.12%) |
6 (9.12%) |
|
Metaplasia type I |
0 |
0 |
0 |
4 (6.08%) |
1 (1.52%) |
0 |
|
Metaplasia type II |
3 (4.56%) |
0 |
1 (1.52%) |
0 |
6 (9.12%) |
2 (3.04%) |
|
Metaplasia type III |
1 (1.52%) |
1 (1.52%) |
3 (4.56%) |
0 |
12 (18.24%) |
5 (7.6%) |
The correlation between the presence of H. pylori infection and the development of intestinal metaplasia lesions is still a controversial issue. In our study, this correlation is shown in Table 13. The data in this table indicate that there cannot be established a correlation between the type of metaplasia and the presence of H. pylori infection, which can be explained by the disposition to focal infection as well as of the lesions of intestinal metaplasia.
Table 13.
Correlation between the presence of H. pylori infection and the development of intestinal metaplasia lesions
|
Metaplasia type |
H. pylori positive |
H. pylori negative |
|
0 |
56% |
44% |
|
1 |
52% |
48% |
|
2 |
76.92% |
23.08% |
|
3 |
95.83% |
4.17% |
At present, the correlation between intestinal metaplasia (colonic type) type III and the risk for developing a gastric carcinoma is well established. In this context, we aimed to analyze the correlation between the degree of atrophy of the gastric mucosa and the types of intestinal metaplasia (Table 14).
Table 14.
Correlation between the degree of atrophy of the gastric mucosa and intestinal metaplasia types
|
|
Metaplasia 0 |
Metaplasia 1 |
Metaplasia 2 |
Metaplasia 3 |
|
Gastritis 0 |
2 cases |
0 |
0 |
0 |
|
Gastritis 1 |
1 case |
0 |
1 case |
0 |
|
Gastritis 2 |
3 cases |
3 cases |
4 cases |
2 cases |
|
Gastritis 3 |
21 cases |
2 cases |
7 cases |
20 cases |
We determined the existence of an approximately equal distribution of the number of cases characterized by the absence of metaplasia lesions (metaplasia 0) and cases of metaplasia type III associated with forms of severe chronic atrophic gastritis. The above-mentioned data confirm the role of severe chronic atrophic gastritis as a pre-cancer lesion in most cases of gastric carcinoma, regardless of the association with lesions of intestinal metaplasia.
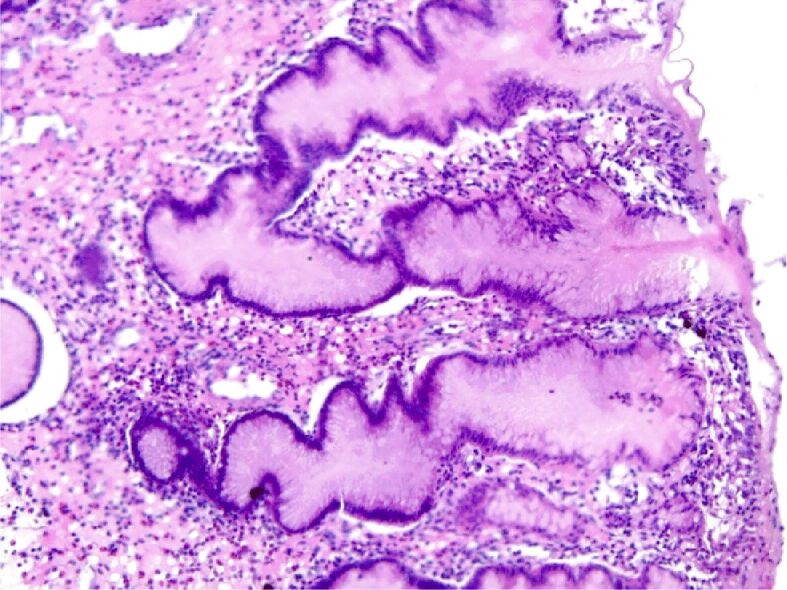
Next, we present a HP aspect of a case of severe atrophic chronic gastritis with extensive lesions of intestinal metaplasia type III (Figure 19A,19B,19C).
Figure 19.

(A) Aspects of severe atrophic chronic gastritis with large areas of intestinal metaplasia type III; (B and C) Details of the previous case. Alcian Blue pH 1 staining: (A) ×40; (B) ×100; (C) ×200
In a sequence of successive details, the absence of deep chorionic glandular structures is to be noted, alongside the transformation of the foveolar epithelium into a colonic type, consisting of columnar absorbing cells, with a marked Alcian Blue staining reaction at pH 1, indicating the presence of sulfated acid mucopolysaccharides, characteristic of colonic mucus.
The correlation between Goseki classes and the incidence of metaplasia types is analyzed in Table 15.
Table 15.
The correlation between Goseki classes
|
Goseki class |
Absence of metaplasia |
Metaplasia type 1 |
Metaplasia type 2 |
Metaplasia type 3 |
|
1 |
1.56% |
0.00% |
1.56% |
10.94% |
|
2 |
9.38% |
1.56% |
9.38% |
12.50% |
|
3 |
17.19% |
0.00% |
1.56% |
1.56% |
|
4 |
12.50% |
0.00% |
7.81% |
12.50% |
There is an extremely low incidence of intestinal metaplasia lesions in Goseki class, namely in three patients, characterized by poorly tubular differentiation and poor mucus secretion.
The presence of dysplasia in the non-tumor mucosa is shown in Figure 20.
Figure 20.
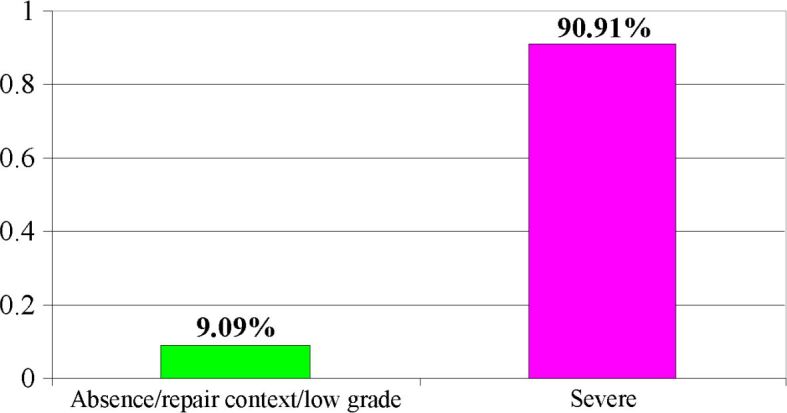
Distribution of cases of dysplasia of non-tumor mucosa
We separated all cases of severe dysplasia from cases of mild, moderate or repair dysplasia (indefinite lesions for dysplasia), considering that the presence of a severe form of dysplasia is rather concomitant with a carcinoma, having a well-defined diagnosis and therapeutic consequences. These statements are confirmed by the percentage of over 90% of severe dysplastic lesions found in the cases studied.
Figure 21 (A and B) presents lesions of severe dysplasia of the peritumoral mucosa developed on extensive lesions of intestinal metaplasia of colonic type.
Figure 21.

(A) High expression of PCNA in dysplastic glandular structures; (B) Details of the previous image. Anti-PCNA antibody immunomarking: (A) ×40; (B) ×200. PCNA: Proliferating cell nuclear antigen
The severe degree of dysplasia results from both cytoarchitectonic changes in the epithelium structures and the high expression PCNA index, mouse monoclonal antigen, PC10 clone, IgG2a kappa isotype, which mark cells in phase S of the cell cycle.
The correlation between dysplasia and intestinal metaplasia is shown in Table 16.
Table 16.
Correlation between dysplasia and intestinal metaplasia lesions
|
|
Metaplasia 0 |
Metaplasia 1 |
Metaplasia 2 |
Metaplasia 3 |
|
Dysplasia 0 |
5 (7.6%) |
0 |
1 (1.52%) |
0 |
|
Dysplasia 1 |
23 (34.96%) |
1 (1.52%) |
12 (18.24%) |
24 (36.43%) |
It is observed that, in the studied group, there is a relatively equal distribution of metaplastic and non-metaplastic dysplasia lesions. We also found a relatively large proportion of cases that associate severe dysplasia lesions with a process of incomplete intestinal metaplasia type II.
The distribution of cases according to the degree of cell differentiation is presented in Figure 22, indicating the predominance of poorly differentiated carcinomas G3 as well as a significant percentage of cases with a medium degree of cell differentiation G2.
Figure 22.
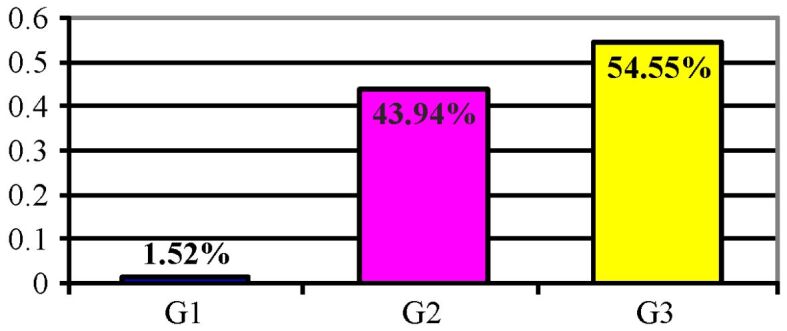
Distribution of cases according to the degree of cell differentiation (G)
The correlation of the tumor invasion level (pT) with the degree of cell differentiation is presented in Table 17: there is a correlation between the degree of cell differentiation and the level of tumor invasion.
Table 17.
Correlation of the tumor invasion level (pT) with the degree of cell differentiation
|
|
G1 |
G2 |
G3 |
|
pT1 |
1 (1.52%) |
3 (4.56%) |
0 |
|
pT2 |
0 |
2 (3.08%) |
3 (4.56%) |
|
pT3 |
0 |
16 (24.64%) |
28 (42.56%) |
|
pT4 |
0 |
8 (12.32%) |
5 (7.6%) |
Finally, the comparative analysis of the G system proposed by the World Health Organization (WHO) and of the Goseki classification highlights a strong correlation between the two systems of assessing cell differentiation (Table 18).
Table 18.
Correlation between the degree of cell differentiation (G) and microscopic tumor aspects according to Goseki classification
|
|
G1 |
G2 |
G3 |
|
Goseki 1 |
1 (1.52%) |
8 (12.16%) |
0 |
|
Goseki 2 |
0 |
21 (31.92%) |
0 |
|
Goseki 3 |
0 |
2 (3.04% |
13 (19.76%) |
|
Goseki 4 |
0 |
0 |
21 (31.92%) |
⧉ Discussions
Gastric cancer remains a neoplasm which has a large geographic coverage, and with a high incidence. According to the GLOBOCAN 2002 data, this neoplasm had an incidence of 22/100 000 in men and 10.4/100 000 in women, with a 16.3/100 000 mortality rate in male patients, and 7.9/100 000 in female patients, respectively [1].
The 5-year survival rate for treated patients with gastric cancer, according to several studies conducted across Europe and USA, ranges between 10 to 20% [2,3]. In Romania, according to the Romanian Society of Digestive Endoscopy, the incidence of gastric cancer in the adult population (over 18 years old) was of 2.9/100 000 inhabitants in 2003, of which 66.4% were men and the rest were represented by women [15].
The above data show that the morbidity and mortality rate of gastric neoplasm in our country and worldwidely is a public healthcare problem, a standardized algorithm for the screening and early detection of this disease becoming mandatory. Our study was conceived as a constant analysis of a possible relation between the epidemiological factors and some histological aspects considered relevant for either the characterization of the tumor or the unaffected gastric mucosa.
The epidemiological data [15] revealed a male/female ratio of 2.5/1, but in our study group it was even higher raising to 3.5/1, with an incidence peak between the age range of 60–69 years old, similar to the one mentioned in the literature [2,3]. Topographically, the highest incidence was registered at the antrum (57.5%), but, for the past years, based on other studies [1,2,3], we noticed an increasing trend of the superior gastric pole localization (22.7%). Our study indicated that all the cases that emerged over 40 years old of age were in men, with a tendency for the tumor localization in the superior gastric pole.
The most frequent macroscopic tumor pattern was type 2 Borrmann, i.e., ulcero-vegetative, occurring mainly over 60 years old of age, with the peak incidence of this sort of cancer in this age group. Although not numerous, the gastric neoplasms before 50 years old showed an equal frequency of Borrmann types 2, 3 and 4.
At the gastric antrum, type 2 (ulcero-vegetating) and type 3 (ulcerated) Borrmann were predominant, whereas at the superior pole types 1 and 2 Borrmann prevail. We mention that the tumor that initially vegetated subsequently underwent necrosis and ulceration processes due to apoptosis, peptic destruction and ischemic processes resulting in ulcero-vegetating and ulcerated forms.
Regarding the invasion, most of the carcinomas were surgically removed when the tumor reached the serosa (pT3) or even the perigastric tissues (pT4). This fact is due to the lack of the early detection methods of neoplastic lesions on a par with poor level of medical knowledge among the population that leads to a late referral of the patients. It might be explained also due to the unspecific clinical manifestations of the tumors in the early stages that can mimic other diseases; besides, most often the symptoms have a remissive character at these stages.
Even though when the endoscopy reveals peptic ulcer like lesions, the errors regarding the biopsy associated with a pathogenic treatment might mask a variable evolution with remission of the gastric carcinoma with pseudo ulcerated macroscopic aspect (type 3 Borrmann) [16]. Unlike peri-orifice tumors (cardia and pillory orifices), the ones localized at the fornix and body are clinically silent for a long period of time, being sometimes difficult to be approached endoscopically (fornix), therefore being diagnosed in the late stages – pT3, pT4 [16,17].
In our study, we discarded the use of the microscopic classifications recommended by WHO or some other authors, such as Lauren & Ming, because they do not associate the tumor architecture with the functional differentiation of the tumor cell.
Therefore, we consider that the above classifications do not properly reflect the pathogenic and morpho-functional aspects and they are not practically relevant. For this reason, we chose Goseki’s classification, which covers better the histological heterogeneity of the gastric carcinomas, providing information over the percentage of the cell and secretory differentiation with direct impact on the invasion of the tumor [18].
The most frequent Goseki classes were 2 and 4, encountered in an almost equal percentage. In men, the most frequent histological type was the vegetating Goseki class 4, whereas in women Goseki class 2 shows the highest frequency. Macroscopically, types 1 and 2 Borrmann are most commonly associated to Goseki class 2, characterized by good tubular and secretory differentiation, being a moderately differentiated tumor (G2) with a well-defined tumor architecture and with exophytic macroscopic expression. In opposition, types 3 and 4 Borrmann are associated with Goseki classes 3 and 4 carcinomas with poorly tubular differentiation, irrespective of the secretory differentiation, resulting in infiltrative or ulcerated growth.
The anamnestic reconstruction of the clinical evolution along with the histological type showed that Goseki classes 3 and 4 progress more rapidly and have a poor prognosis [15,16]. These cases count most of the tumors localized at the superior gastric pole.
More than 70% of the patients in our study group presented lesions of severe chronic atrophic gastritis of the non-tumor mucosa. These are the results of a prolonged process of 10 to 15 years with a plurifactorial etiology [19], where we only searched for H. pylori infection. The correlation between the types of gastritis and Goseki classes of gastric carcinomas shows a clear association of the severe atypical forms with Goseki class 4, characterized by poorly tubular differentiation but a good secretory differentiation. This is due to the association of chronic atrophic gastritis with intestinal metaplasia [20,21,22].
The chronic infection with H. pylori interferes with many pathogenic pathways, disrupting the protective mechanism of the mucosa, thus leading to lesions of the foveolar epithelium such as vacuolization followed by exulcerations that need repairing. The persistence of the infection determines the accumulation of numerous lymphocytes that in time will destroy the epithelial structures of the deep chorion, thus developing an atrophy [23,24,25,26].
The repetitive repairing of the foveolar epithelium leads, in some cases, to its phenotypic variation, resulting in an intestinal like epithelium with diverse patterns of intestinal metaplasia [12, 27,28].
The incidence of H. pylori infection in severe chronic atrophic gastritis was about 50%, lower than the one mentioned in other studies [24, 29,30,31,32]. In a study conducted by Solcia et al. (1996) it is mentioned a percentage of 85% of H. pylori infection on gastrectomy samples in early cancer, out of which 76% were in intestinal cancer (associated with well differentiated secretory Goseki’s classes), and 100% in the diffuse ones associated with poorly differentiated tubular Goseki’s classes [33].
The presence of H. pylori was highlighted in the corporal intestinal cancer rather than in antral carcinoma, whereas in the diffuse forms of neoplasm there were no statistically significant differences [33]. The epidemiological studies revealed that the risk of cancer increases with H. pylori infected persons compared to H. pylori negative people, and the infection with these bacteria is correlated to distal gastric adenocarcinomas (corporal, antral) and never to superior pole cancers [24, 29]. In our study, we observed an increased incidence of the latter infection type that led to aggravated atrophy, which contradicts the data mentioned above [33].
The correlation of the H. pylori infection with intestinal gastric cancer (Lauren’s classification) occurs more frequently in our study due to the strong association between the infection and well-differentiated secretory types belonging to Goseki’s classes [34,35]. We also observed an increased percentage of positive H. pylori in Goseki class 1, which presented a good tubular differentiation. In Goseki class 3 with poorly secretory and tubular differentiation, the incidence of H. pylori infection decreased because of the lack of favorable growing conditions for these bacteria [34,35].
The epidemiological data suggests that chronic atrophic gastritis is associated with two types of tumors: intestinal gastric cancer and gastric carcinoid type 1, but the physio-pathogenic mechanism of this association is different [19].
Currently, the relation between the H. pylori infection and chronic inflammation of the gastric mucosa that progresses to chronic atrophic gastritis followed by intestinal metaplasia, dysplasia and finally resulting in the development of gastric neoplasm it is widely accepted [19, 36]. Likewise, the type 1 gastric carcinoma is a tumor associated with a high level of chronic atrophic gastritis, the gastrin excess stimulating the growth of enterochromaffin-like cells (ECL), while their hyperplasia leads to the development of the carcinoid tumor [37,38].
In our study group, almost half (42.4%) of the cases did not show lesions of intestinal metaplasia. On the other hand, the incidence of intestinal metaplasia rises with age, being more common in antral gastric carcinomas. We also noted that there is no relation between that metaplasia type and the presence of H. pylori infection. That might be explained either by the focal localization of the infection and of the intestinal metaplasia lesions or by the fact that an accurate diagnosis of the infection requires some other investigations (feces serology).
The correlation between Goseki’s classes and metaplasia grades shows that in Goseki’s classes intestinal metaplasia is almost absent due to the lack of tubular differentiation in these types of cancers.
The incidence of gastric neoplasm associated with intestinal metaplasia varies between 0–10% according to research, an incomplete type of metaplasia [22, 39] being present in the vast majority. Furthermore, the scientific data show that the risk of cancer is four to 11 times higher in patients with incomplete metaplasia compared with the ones that do not have this type of lesions [22, 27, 40].
Without a shadow of doubt, all carcinomas are the result of progressive dysplastic lesions with or without a metaplastic epithelial base. The analysis of our data revealed an approximately equal number of cases with no metaplasia and of the ones showing metaplasia type 3. Many authors describe gastric dysplasia as a dynamic process with a negative potential or a potential to progress to gastric carcinoma [3, 17, 41]. In this context, several studies report that the time needed ranging from the identification of severe dysplasia to the diagnosis of gastric cancer varies from one month to 39 months, with an average of 23 months. According to those studies, it can be concluded that gastric dysplasia lesions represent an important marker for the evaluation of the risk of gastric neoplasm and that the higher the dysplasia grade, the higher the risk of developing invasive gastric cancer [15,16,17, 41,42].
⧉ Conclusions
Gastric cancer continues to remain a neoplastic lesion with a widespread geographic distribution and increased incidence in men and persons over 60 years old. Lesions such as chronic atrophic gastritis, incomplete intestinal metaplasia and high-grade dysplasia are precursors of the gastric cancer and, in many cases, they accompany the malignant gastric tumor. The chronic infection with H. pylori interferes with many pathogenic pathways, disrupting the protective mechanism of the mucosa, leading to lesions of the foveolar epithelium that in time will result in the destruction of the epithelial structures and atrophic processes. The repetitive repairing of the foveolar epithelium determines, in some cases, a phenotypic alteration, resulting in intestinal epithelium with various patterns of intestinal metaplasia. Currently, it is considered that all gastric carcinomas develop based on progressive dysplastic lesions on the metaplastic or non-metaplastic epithelium. From all the microscopic classifications of the gastric cancer mentioned in the literature, we chose Goseki’s microscopic classes on account of their best coverage of the histological heterogeneity of gastric carcinomas, providing information on the percentage of cellular and secretory differentiation with direct impact on the invasion of the tumor.
Conflict of interest
The authors declare no conflict of interests.
References
- 1.Parkin DM, Bray F, Ferlay J, Pisani P. Global cancer statistics, 2002. CA Cancer J Clin. 2005;55(2):74–108. doi: 10.3322/canjclin.55.2.74. [DOI] [PubMed] [Google Scholar]
- 2.Yang L. Incidence and mortality of gastric cancer in China. World J Gastroenterol. 2006;12(1):17–20. doi: 10.3748/wjg.v12.i1.17. [DOI] [PMC free article] [PubMed] [Google Scholar]
- 3.Crew KD, Neugut AI. Epidemiology of gastric cancer. World J Gastroenterol. 2006;12(3):354–362. doi: 10.3748/wjg.v12.i3.354. [DOI] [PMC free article] [PubMed] [Google Scholar]
- 4.Zhang X, Li M, Chen S, Hu J, Guo Q, Liu R, Zheng H, Jin Z, Yuan Y, Xi Y, Hua B. Endoscopic screening in Asian countries is associated with reduced gastric cancer mortality: a meta-analysis and systematic review. Gastroenterology. 2018;155(2):347–354e9. doi: 10.1053/j.gastro.2018.04.026. [DOI] [PubMed] [Google Scholar]
- 5.Ruff S, Curtin B, Quezado M, Heller T, Koh C, Steinberg SM, Connolly M, Hernandez JM, Davis JL. Evaluation of confocal endoscopic microscopy for detection of early-stage gastric cancer in hereditary diffuse gastric cancer (HDGC) syndrome. J Gastrointest Oncol. 2019;10(3):407–411. doi: 10.21037/jgo.2019.01.04. [DOI] [PMC free article] [PubMed] [Google Scholar]
- 6.Zhang M, Liu S, Hu Y, Bao HB, Meng LN, Wang XT, Xu Y, Zhao J, Lu B. Biopsy strategies for endoscopic screening of pre-malignant gastric lesions. Sci Rep. 2019;9(1):14909–14909. doi: 10.1038/s41598-019-51487-0. [DOI] [PMC free article] [PubMed] [Google Scholar]
- 7.Youn Nam, Park BJ, Nam JH, Ryu KH, Kook MC, Kim J, Lee WK. Association of current Helicobacter pylori infection and metabolic factors with gastric cancer in 35,519 subjects: a cross-sectional study. United Eur Gastroenterol J. 2019;7(2):287–296. doi: 10.1177/2050640618819402. [DOI] [PMC free article] [PubMed] [Google Scholar]
- 8.Liou JM, Lee YC, El-Omar EM, Wu MS. Efficacy and long-term safety of H. pylori eradication for gastric cancer prevention. Cancers (Basel) 2019;11(5):593–593. doi: 10.3390/cancers11050593. [DOI] [PMC free article] [PubMed] [Google Scholar]
- 9.Rawla P, Barsouk A. Epidemiology of gastric cancer: global trends, risk factors and prevention. Prz Gastroenterol. 2019;14(1):26–38. doi: 10.5114/pg.2018.80001. [DOI] [PMC free article] [PubMed] [Google Scholar]
- 10.Kayano T, Lee KD, Nishiura H. Estimating the force of infection with Helicobacter pylori in Japan. Can J Infect Dis Med Microbiol. 2019;2019:1451490–1451490. doi: 10.1155/2019/1451490. [DOI] [PMC free article] [PubMed] [Google Scholar]
- 11.Burucoa C, Axon A. Epidemiology of Helicobacter pylori infection. Helicobacter. 2017;22(Suppl 1):e12403–e12403. doi: 10.1111/hel.12403. [DOI] [PubMed] [Google Scholar]
- 12.Pichon M, Burucoa C. Impact of the gastrointestinal bacterial microbiome on Helicobacter-associated diseases. Healthcare (Basel) 2019;7(1):34–34. doi: 10.3390/healthcare7010034. [DOI] [PMC free article] [PubMed] [Google Scholar]
- 13.Sugano K, Tack J, Kuipers EJ, Graham DY, El-Omar EM, Miura S, Haruma K, Asaka M, Uemura N, Malfertheiner P, Faculty Members of Kyoto Global Consensus Conference Kyoto Global Consensus Report on Helicobacter pylori gastritis. Gut. 2015;64(9):1353–1367. doi: 10.1136/gutjnl-2015-309252. [DOI] [PMC free article] [PubMed] [Google Scholar]
- 14.Sugano K. Effect of Helicobacter pylori eradication on the incidence of gastric cancer: a systematic review and meta-analysis. Gastric Cancer. 2019;22(3):435–445. doi: 10.1007/s10120-018-0876-0. [DOI] [PubMed] [Google Scholar]
- 15.Dobru D, Pascu O, Tantau M, Gheorghe C, Goldis A, Balan G, Coman F, Fraticiu A, Dumitru E, Mutescu E, Saftoiu A, Bacarea V. An epidemiological study of gastric cancer in the adult population referred to gastroenterology medical services in Romania - a multicentric study. Rom J Gastroenterol. 2004;13(4):275–279. [PubMed] [Google Scholar]
- 16.Păun I, Pleşea IE, Glavici A, Ciobanu D, Petrescu F, Ghiţă D, Pleşea RM, Strâmbu VDE. Comparative study of clinical-morphological profiles of different types of gastric carcinoma. Rom J Morphol Embryol. 2015;56(4):1345–1356. [PubMed] [Google Scholar]
- 17.de Vries AC, van Grieken NCT, Looman CWN, Casparie MK, de Vries E, Meijer GA, Kuipers EJ. Gastric cancer risk in patients with premalignant gastric lesions: a nationwide cohort study in the Netherlands. Gastroenterology. 2008;134(4):945–952. doi: 10.1053/j.gastro.2008.01.071. [DOI] [PubMed] [Google Scholar]
- 18.Goseki N, Takizawa T, Koike M. Differences in the mode of the extension of gastric cancer classified by histological type: new histological classification of gastric carcinoma. Gut. 1992;33(5):606–612. doi: 10.1136/gut.33.5.606. [DOI] [PMC free article] [PubMed] [Google Scholar]
- 19.Vannella L, Lahner E, Annibale B. Risk for gastric neoplasias in patients with chronic atrophic gastritis: a critical reappraisal. World J Gastroenterol. 2012;18(12):1279–1285. doi: 10.3748/wjg.v18.i12.1279. [DOI] [PMC free article] [PubMed] [Google Scholar]
- 20.Cheung DY. Atrophic gastritis increases the risk of gastric cancer in asymptomatic population in Korea. Gut Liver. 2017;11(5):575–576. doi: 10.5009/gnl17356. [DOI] [PMC free article] [PubMed] [Google Scholar]
- 21.Fox JG, Wang TC. Inflammation, atrophy, and gastric cancer. J Clin Invest. 2007;117(1):60–69. doi: 10.1172/JCI30111. [DOI] [PMC free article] [PubMed] [Google Scholar]
- 22.Jencks DS, Adam JD, Borum ML, Koh JM, Stephen S, Doman DB. Overview of current concepts in gastric intestinal metaplasia and gastric cancer. Gastroenterol Hepatol (N Y) 2018;14(2):92–101. [PMC free article] [PubMed] [Google Scholar]
- 23.Lahner E, Pilozzi E, Esposito G, Galli G, Annibale B. Gastric carcinoid in the absence of atrophic body gastritis and with low Ki67 index: a clinical challenge. Scand J Gastroenterol. 2014;49(4):506–510. doi: 10.3109/00365521.2013.878381. [DOI] [PubMed] [Google Scholar]
- 24.Cover TL. Helicobacter pylori diversity and gastric cancer risk. mBio. 2016;7(1):e01869–15. doi: 10.1128/mBio.01869-15. [DOI] [PMC free article] [PubMed] [Google Scholar]
- 25.Rhead JL, Letley DP, Mohammadi M, Hussein N, Mohagheghi MA, Eshagh Hosseini M, Atherton JC. A new Helicobacter pylori vacuolating cytotoxin determinant, the intermediate region, is associated with gastric cancer. Gastroenterology. 2007;133(3):926–936. doi: 10.1053/j.gastro.2007.06.056. [DOI] [PubMed] [Google Scholar]
- 26.Gebert B, Fischer W, Weiss E, Hoffmann R, Haas R. Helicobacter pylori vacuolating cytotoxin inhibits T lymphocyte activation. Science. 2003;301(5636):1099–1102. doi: 10.1126/science.1086871. [DOI] [PubMed] [Google Scholar]
- 27.Cassaro M, Rugge M, Gutierrez O, Leandro G, Graham DY, Genta RM. Topographic patterns of intestinal metaplasia and gastric cancer. Am J Gastroenterol. 2000;95(6):1431–1438. doi: 10.1111/j.1572-0241.2000.02074.x. [DOI] [PubMed] [Google Scholar]
- 28.Gutiérrez-González L, Wright NA. Biology of intestinal metaplasia in 2008: more than a simple phenotypic alteration. Dig Liver Dis. 2008;40(7):510–522. doi: 10.1016/j.dld.2008.02.029. [DOI] [PubMed] [Google Scholar]
- 29.Borch K, Jönsson KA, Petersson F, Redéen S, Mårdh S, Franzén LE. Prevalence of gastroduodenitis and Helicobacter pylori infection in a general population sample: relations to symptomatology and lifestyle. Dig Dis Sci. 2000;45(7):1322–1329. doi: 10.1023/a:1005547802121. [DOI] [PubMed] [Google Scholar]
- 30.Zou D, He J, Ma X, Liu W, Chen J, Shi X, Ye P, Gong Y, Zhao Y, Wang R, Yan X, Man X, Gao L, Dent J, Sung J, Wernersson B, Johansson S, Li Z. Helicobacter pylori infection and gastritis: the Systematic Investigation of gastrointestinaL diseases in China (SILC) J Gastroenterol Hepatol. 2011;26(5):908–915. doi: 10.1111/j.1440-1746.2010.06608.x. [DOI] [PubMed] [Google Scholar]
- 31.Uemura N, Okamoto S, Yamamoto S, Matsumura N, Yamaguchi S, Yamakido M, Taniyama K, Sasaki N, Schlemper RJ. Helicobacter pylori infection and the development of gastric cancer. N Engl J Med. 2001;345(11):784–789. doi: 10.1056/NEJMoa001999. [DOI] [PubMed] [Google Scholar]
- 32.Peek RM, Blaser MJ. Helicobacter pylori and gastrointestinal tract adenocarcinomas. Nat Rev Cancer. 2002;2(1):28–37. doi: 10.1038/nrc703. [DOI] [PubMed] [Google Scholar]
- 33.Solcia E, Fiocca R, Luinetti O, Villani L, Padovan L, Calistri D, Ranzani GN, Chiaravalli A, Capella C. Intestinal and diffuse gastric cancers arise in a different background of Helicobacter pylori gastritis through different gene involvement. Am J Surg Pathol. 1996;20(Suppl 1):S8–S22. doi: 10.1097/00000478-199600001-00003. [DOI] [PubMed] [Google Scholar]
- 34.Kim YJ, Chung JW, Lee SJ, Choi KS, Kim JH, Hahm KB. Progression from chronic atrophic gastritis to gastric cancer; tangle, toggle, tackle with Korea red ginseng. J Clin Biochem Nutr. 2010;46(3):195–204. doi: 10.3164/jcbn.10-03. [DOI] [PMC free article] [PubMed] [Google Scholar]
- 35.Vannella L, Lahner E, Osborn J, Bordi C, Miglione M, Delle Fave G, Annibale B. Risk factors for progression to gastric neoplastic lesions in patients with atrophic gastritis. Aliment Pharmacol Ther. 2010;31(9):1042–1050. doi: 10.1111/j.1365-2036.2010.04268.x. [DOI] [PubMed] [Google Scholar]
- 36.Păun I, Becheanu G, Costin AI, Constantin VD, Mihai GM, Radu L, Iovan L, Vârcuş F. Aspects regarding nomenclature, classification and pathology of neuroendocrine neoplasms of the digestive system – a review. Rom J Morphol Embryol. 2018;59(3):673–678. [PubMed] [Google Scholar]
- 37.Bordi C, D’Adda T, Azzoni C, Pilato FP, Caruana P. Hypergastrinemia and gastric enterochromaffin-like cells. Am J Surg Pathol. 1995;19(Suppl 1):S8–S19. [PubMed] [Google Scholar]
- 38.Costin AI, Păun I, Păun M, Constantin VD, Vârcuş F. Primary neuroendocrine tumors – an extremely rare cause of obstruction of extrahepatic bile ducts: a case report. Rom J Morphol Embryol. 2017;58(2):641–644. [PubMed] [Google Scholar]
- 39.González CA, Sanz-Anquela JM, Gisbert JP, Correa P. Utility of subtyping intestinal metaplasia as marker of gastric cancer risk. A review of the evidence. Int J Cancer. 2013;133(5):1023–1032. doi: 10.1002/ijc.28003. [DOI] [PMC free article] [PubMed] [Google Scholar]
- 40.Kinoshita H, Hayakawa Y, Koike K. Metaplasia in the stomach – precursor of gastric cancer. Int J Mol Sci. 2017;18(10):2063–2063. doi: 10.3390/ijms18102063. [DOI] [PMC free article] [PubMed] [Google Scholar]
- 41.Lauwers GY, Riddell RH. Gastric epithelial dysplasia. Gut. 1999;45(5):784–790. doi: 10.1136/gut.45.5.784. [DOI] [PMC free article] [PubMed] [Google Scholar]
- 42.Rugge M, Farinati F, Baffa R, Sonego F, Di Mario F, Leandro G, Valiante F. Gastric epithelial dysplasia in the natural history of gastric cancer: a multicenter prospective follow-up study. Interdisciplinary Group on Gastric Epithelial Dysplasia. Gastroenterology. 1994;107(5):1288–1296. doi: 10.1016/0016-5085(94)90529-0. [DOI] [PubMed] [Google Scholar]