Abstract
Due to complex interplay between host and viral factors, pathogenesis of chronic hepatitis C (CHC) is considered a challenging issue. Infection with hepatitis C virus (HCV) is not confined only to liver but can induce disturbances in many other organs and systems. Our primary aim for this study was to evaluate biological response rates and sustained virological response (SVR) in patients diagnosed with CHC, treated with Interferon-alpha (IFN-α), Pegylated (PEG)–IFN-α2a or -α2b plus Ribavirin. The second aim of the study was the identification of predictive factors for a favorable response to antiviral therapy in patients diagnosed with CHC. We enrolled in this study 210 patients diagnosed with CHC who have accomplished all inclusion and exclusion criteria, treated with PEG–IFN plus Ribavirin. Patients’ recovery progress has been evaluated by determining: age, gender; biochemical tests: alanine aminotransferase (ALT), aspartate aminotransferase (AST); serological assays – detect anti-HCV antibody and molecular assays – detect, quantify and/or characterize hepatitis C viral load (ribonucleic acid) (HCV-RNA); liver histopathological (HP) examination. According to their response to treatment, they were classified into responders (n=145) and non-responders (n=65). Liver biopsies were histopathologically evaluated for necroinflammatory grade and fibrosis stage according to the modified Ishak and Metavir scoring systems for chronic hepatitis. Demographic, laboratory, and HP results were introduced in statistical analysis. These parameters were included in area under curve (AUC) analysis in order to estimate their degree of influence on getting early virological response (EVR) and SVR. Our study demonstrates that factors connected to treatment failure in CHC are linked to older age, high hepatitis C viral load, and impaired glucose tolerance at beginning of treatment [high fasting glucose and insulin, high homeostatic model assessment of insulin resistance (HOMA-IR) index] and also to liver histology features (high fibrosis score, liver steatosis, iron infiltration, and more or less high necroinflammatory activity). Analyzing results of our study shows that HOMA-IR index, serum insulin levels, baseline HCV-RNA, baseline mean blood glucose and HP score like Ishak fibrosis score, steatosis score and liver iron score may have a predictive value for obtaining an EVR in patients diagnosed with CHC.
Keywords: steatosis, liver biopsy, chronic hepatitis C, Interferon-alpha, Ribavirin
⧉ Introduction
Hepatitis C virus (HCV) belongs to the Flaviviridae family, one of the most severe human infections and the second most common cause of viral hepatitis [1]. The World Health Organization (WHO) reports that approximately 3% of the world’s population has been contaminated with HCV and that more than 170 million chronic carriers are at risk of developing liver cancer and/or liver cirrhosis [2]. Chronic HCV infection often results in cirrhosis of the liver and is related to the risk of developing hepatocellular carcinoma (HCC). Chronic HCV infection frequently contributes to liver cirrhosis and is associated with the risk of developing HCC. The risk of progression from chronic HCV infection to cirrhosis and its clinical outcomes is highly variable, and several factors are involved in the accelerated progression of the disease and the possibility of sustained virological response (SVR) after Pegylated–Interferon (PEG–IFN)/Ribavirin therapy [3]. Depending on the level and development of liver fibrosis, the treatment and prognosis of chronic liver diseases. The stage of liver fibrosis is the most significant indicator of disease progression in patients with chronic hepatitis C (CHC) and demonstrates the need for antiviral therapy. Steatosis intensity plays an important role in the initiation and progression of liver damage from fibrosis. Steatohepatitis is now thought to be a major cause of cirrhosis of uncertain origin, or to be the final stage of some liver injuries. Insulin resistance (IR), excess fatty acids in hepatocytes, lipid peroxidation and oxidative stress are implicated in non-alcoholic steatohepatitis (NASH) pathogenesis [4]. The progression of lesions to cirrhosis is unpredictable, but typically gradual. Core and visceral obesity, IR, hyperglycemia and hypertriglyceridemia are generally associated with NASH. The difficulties faced in diagnosing and treating this disease are related to a lack of understanding of the pathogenic process, such that the final objective of many studies is to establish the factors responsible for the transformation of hepatic steatosis into steatohepatitis and cirrhosis [5,6,7,8,9]. Many virus-carrying subjects remain asymptomatic. Chronicity is frequently followed by impaired liver function, progressive liver disease and then culminates in cirrhosis or HCC [10,11] for up to 20% of infected individuals with HCV. A typical finding is mild to moderate iron overload in patients with chronic HCV infection, up to 30–40% of whom may display increased serum ferritin or increased concentration of hepatic iron. On the other hand, liver disease progression and reduced response to antiviral therapy were associated with elevated iron indices [12,13,14,15].
Aim
The aim of this study was therefore to assess biological response rates and SVR in patients with CHC treated with IFN-α, PEG–IFN-α2a or -α2b plus Ribavirin and also to identify predictors of favorable response to antiviral therapy in patients with CHC.
⧉ Patients, Materials and Methods
Between 2011 and 2015, a total of 210 patients with chronic HCV receiving PEG–IFN/Ribavirin were enrolled. The study was done inside the Clinic of Internal Medicine, Filantropia Municipal Hospital, Craiova, Romania. The existence of anti-HCV antibody – enzyme-linked immunosorbent assay (ELISA) and serum hepatitis C viral load (ribonucleic acid) (HCV-RNA) by real-time reverse transcription polymerase chain reaction (RT–PCR) was identified as chronic HCV infection.
Treatment protocol
Patients were treated with PEG–IFN-α2a 180 μg/week + Ribavirin: 1000 mg/day body weight <75 kg; 1200 mg/day body weight >75 kg or PEG–IFN-α2b 1.5 mg/kg/week + Ribavirin: 1000 mg/day body weight <75 kg; 1200 mg/day body weight >75 kg.
Clinical, anthropometric and laboratory assessment
Patients were subjected to:
(i) Clinical assessment, including demographic statistics, recent history of smoking, intake of alcohol, involvement of chronic conditions and prior history of dental operation, surgery or transfusion of blood. Patients were not admitted if they had a mixed infection with another HCV genotype, hepatitis B virus (HBV) coinfection, excessive alcohol abuse (>20 g/day daily alcohol intake), decompensated cirrhosis, neoplastic disease, and organ transplantation.
(ii) Anthropometric assessment: weight (W), height (H), body mass index (BMI) = W [kg] / H2 [m2]. The BMI classification subjects were as follows: average weight – BMI <25 kg/m2, overweight – BMI: 25–29.9 kg/m2, obese – BMI >30 kg/m2.
(iii) Laboratory assessment:
▪ Biochemical tests: alanine aminotransferase (ALT), aspartate aminotransferase (AST) by spectrophotometric process, spectrophotometric fasting glucose, hexokinase fasting insulin, spectrophotometric total cholesterol (TC) and triglycerides (TG). Serum iron (mg Fe/kg) was calculated by spectrophotometric method and serum ferritin by electrochemiluminescence immunoassay (ECLIA) as well.
▪ Insulin sensitivity assessment. Insulin sensitivity was measured using homeostatic model assessment of insulin resistance (HOMA-IR), using the following formula: fasting plasma glucose [mg/dL] × fasting insulin [μU/mL] / 405.
▪ Molecular assays: HCV-RNA was identified, quantified and/or characterized. PCR detection of HCV-RNA provides proof of active HCV infection and is potentially useful for confirming the diagnosis and monitoring of antiviral therapy response. At present, optimal HCV PCR assays have a sensitivity per milliliter of plasma or serum of <100 copies of HCV-RNA. To classify HCV into distinct genotypes, molecular tests were also developed.
Patients have been grouped into two groups:
(1) Responders: these were patients whose early virological response (EVR) showed PCR performance.
(2) Non-responders: these were patients whose EVR was not shown by the PCR results. From patients, the hepatitis C viral load result of the respective patient was obtained. After obtaining informed consent from each patient, samples were included in the report.
Histopathological (HP) assessment
Each patient received a baseline percutaneous liver biopsy guided by ultrasound. An experienced pathologist assessed all biopsy specimens. Using the Brunt ranking system, in which steatosis is graded 0 to3, steatosis was scored [16]. For fibrosis and the determination of necroinflammatory grades in the liver, more semiquantitative staging systems have been suggested. An updated version of the old HP index of operation is the Ishak system. On a scale of 0–6, liver fibrosis was staged as follows: F0 – no fibrosis; F1 – fibrous expansion of some portal areas; F2 – fibrous expansion of most portal areas; F3 – fibrous expansion of most portal areas with occasional portal to portal bridging; F4 – fibrous expansion of most portal areas with marked bridging; F5 – occasional nodular bridging (incomplete cirrhosis); F6 – cirrhosis of most portal areas with marked bridging; It is possible to divide the fibrosis stage into low-stage fibrosis (stage 0–3) and high-stage fibrosis (stage 4–6). All research subjects were collected from the department for the pathology report. It is possible to classify the histology activity index (HAI) as minimal (grade 0–3), mild (grade 4–8), moderate (grade 9–12) and extreme (grade 13–18). Liver biopsy specimens were fixed in 10% buffered neutral formalin, processed for fibrosis and architectural improvements by paraffin embedding and Hematoxylin–Eosin (HE), Masson’s trichrome and Sweet’s reticulin stainings. For grade iron storage, as well as cluster of differentiation 20 (CD20) immunostaining, the Perls’ Prussian Blue staining was used. The Dako Labeled Streptavidin–Biotin 2 (LSAB2) system and the anti-human monoclonal antibodies CD20 and actin alpha 1 (Table 1) were used for visualization.
Table 1.
The antibodies panel
|
Antibody |
Clone |
Dilution (Manufacturer) |
|
CD20 |
L26 |
1:200 (Dako) |
|
Ki67 |
MIB1 |
1:50 (Dako) |
|
Actin alpha 1 |
1A4 |
1:50 |
CD20: Cluster of differentiation 20
Statistical analysis
We used the statistical program MedCalc® version 12.5.0.0 Medical (MedCalc® Software, Mariakerke, Belgium), Windows XP / Vista / 7/8 to store the details recorded on the research plug in the database and also for statistical calculations. Descriptive statistical analysis was used, and χ2 (chi-squared) or Fisher tests were used to evaluate the distributions of categorical variables. Continuous knowledge was expressed as predictive value, means, medians and standard deviation (SD). Comparisons were carried out using the Student’s t-test and analysis of variance (ANOVA) test between qualitative and quantitative variables. A p<0.05 value was deemed to be statistically important.
⧉ Results
The group consisted of 210 patients, as shown in Table 2: 101 women with an average age of 42.7 years, an average weight of 68.5 kg and an average height of 1.69 m, 109 males with an average age of 43.4 years, an average weight of 70.2 kg and an average height of 1.70 m. We have analyzed BMI at women who have a score between 22.63 kg/m2 and 24.97 kg/m2, with an average of 23.80 kg/m2, a minimum of 14.69 kg/m2 and a maximum of 43.38 kg/m2. Regarding our male subjects, we have chosen to study the patients with a BMI between 23.26 kg/m2 and 25.27 kg/m2, with a mean of 24.27 kg/m2, a minimum of 15.02 kg/m2 and a maximum of 43.38 kg/m2. We found an average of 99.82 mg/dL in females and 96.57 mg/dL in males in the fasting glucose sample. The mean values of ALT were 116.7 U/L in women and 124 U/L in men, respectively. In our group of patients discovering a mean hepatitis C viral load of 3 578 702 IU/mL in women and 4 020 733 IU/mL in men, hepatitis C viral load is important in the response to treatment.
Table 2.
The synoptic characterization of group
|
|
Women |
Men |
||||||
|
N |
Mean (95% CI) |
Min. |
Max. |
N |
Mean (95% CI) |
Min. |
Max. |
|
|
Age [years] |
101 |
42.7 (40.4–45.0) |
19 |
64 |
109 |
43.4 (41.2–45.6) |
19 |
64 |
|
Weight [kg] |
101 |
68.05 (64.79–71.32) |
43 |
121 |
109 |
70.21 (67.56–72.85) |
41 |
124 |
|
Height [m] |
101 |
1.69 (1.67–1.71) |
1.55 |
1.91 |
109 |
1.70 (1.68–1.72) |
1.55 |
1.94 |
|
BMI [kg/m2] |
101 |
23.80 (22.63–24.97) |
14.69 |
43.38 |
109 |
24.27 (23.26–25.27) |
15.02 |
43.38 |
|
Glycemia [mg/dL] |
101 |
99.82 (96.82–102.82) |
66.00 |
125.00 |
109 |
96.57 (93.47–99.68) |
55.00 |
119.00 |
|
HCV-RNA [IU/mL] |
101 |
3 578 702 (296 794–4 189 464) |
130 000 |
15 600 000 |
109 |
4 020 733 (3 402 978–4 638 489) |
99 000 |
13 600 000 |
|
ALT [U/L] |
101 |
116.7 (104.4–129.0) |
31 |
231 |
109 |
124.5 (113.7–135.3) |
32 |
231 |
ALT: Alanine aminotransferase; BMI: Body mass index; CI: Confidence interval; HCV-RNA: Hepatitis C viral load (ribonucleic acid – RNA); N: No. of patients
Group distribution associated with the grade of steatosis
The minimum value of the degree of steatosis found in our group was 0, and the maximum was 3. In most of our male patients, the grade values we found were between 1.74 and 2.11, with the mean grade being 1.93. Their values were between 2.06–2.43 in the case of women, with an average of 2.25. No significant gender differences occurred (Table 3).
Table 3.
The characterization of the group related with steatosis
|
Steatosis grade |
Women |
Men |
||||||
|
Mean |
95% CI |
Min. |
Max. |
Mean |
95% CI |
Min. |
Max. |
|
|
2.25 |
2.06–2.43 |
0.00 |
3.00 |
1.93 |
1.74–2.11 |
0.00 |
3.00 |
|
CI: Confidence interval
Necroinflammatory score (HAI)-related group distribution
The group’s minimum HAI score was 4, while the maximum was 15. With an average of 8.7, the values for male subjects ranged between 8.15 and 9.14. With an average of 7.7, the values for female subjects ranged between 7.4 and 8.1. In men, we calculated slightly higher values than in women (Table 4).
Table 4.
The characterization of the group related with the necroinflammatory score
|
Necroinflammatory score (HAI) |
Mean for women (95% CI) |
Mean for men (95% CI) |
General mean |
|
7.78 (7.41–8.14) |
8.651 (8.15–9.14) |
8.2 |
CI: Confidence interval; HAI: Histology activity index
Group distribution related to the score for fibrosis
In the patient set, the Ishak fibrosis score had a minimum value of 0 and a maximum value of 6, averaging 2.5. Therefore, an average value of 2.71 was found in the feminine gender and a mean value of 2.34 in the male group. The value of feminine gender subjects was slightly higher (Table 5).
Table 5.
The group characterization related with fibrosis
|
Ishak fibrosis score |
Mean for women (95% CI) |
Mean for men (95% CI) |
General mean |
|
2.7 (2.4–2.9) |
2.3 (2.1–2.5) |
2.5 |
CI: Confidence interval.
Group distribution related to the iron loading score
In our group of patients there were no statistically significant differences between the two genders regarding the liver iron loading. The mean for men was 16.5 and the mean for women was 19.3. The general mean was 17.8 (Table 6).
Table 6.
Evaluation of the iron loading score
|
Iron loading score |
Mean for women (95% CI) |
Mean for men (95% CI) |
General mean |
|
19.3 (17.7–20.9) |
16.5 (14.9–18.0) |
17.8 |
CI: Confidence interval
HP assessment
When the cross-sections were microscopically examined, we found moderate steatosis, slightly active chronic hepatitis. Actin alpha 1 immunohistochemical (IHC) staining observed the positivity of fibrocytes in the portal space and septum (Figure 1). Chronic active hepatitis – IHC staining of the fibrocystic cells and vascular walls for actin alpha 1 positive (Figure 2). Moderately active chronic hepatitis with portal space lymphoplasmacytic infiltrates, granular and vacuolar degeneration hepatocytes, portal space fibrosis, and septa with mild steatosis (Figure 3). Three areas of fibrosis have been identified, perivenular, perisinusoidal/pericellular with focal or extensive distribution. The presence of focal or extensive periportal fibrosis has also been observed, these cases were classified in stage F2, the predominant category (Figure 4), bridging fibrosis with porto-portal and porto-central bridges (Figure 5) and iron deposition (Figure 6).
Figure 1.
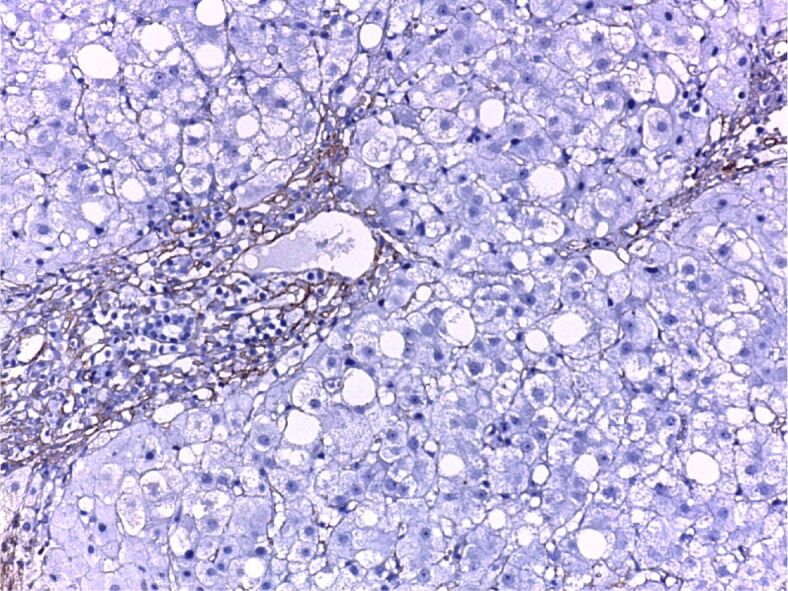
Minimally active chronic hepatitis. Intensely positive CD20 immunostaining, fibrocytes positivity in the portal space and septa. Anti-CD20 antibody immunostaining, ×200. CD20: Cluster of differentiation 20
Figure 2.
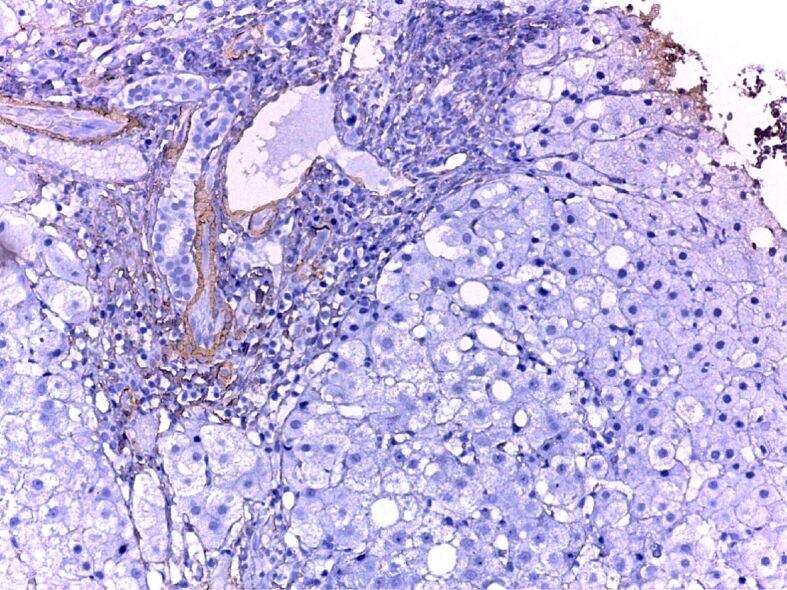
Moderately active chronic hepatitis C, fibrosis. Anti-CD20 antibody immunostaining, ×200
Figure 3.
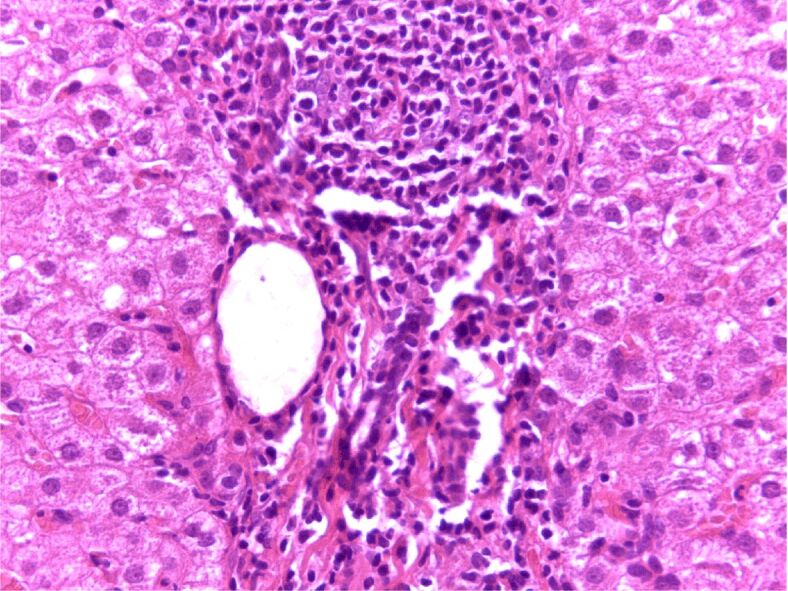
Moderately active chronic hepatitis C, fibrosis in the portal space and septa, with mild steatosis. HE is staining, ×200. HE: Hematoxylin–Eosin
Figure 4.
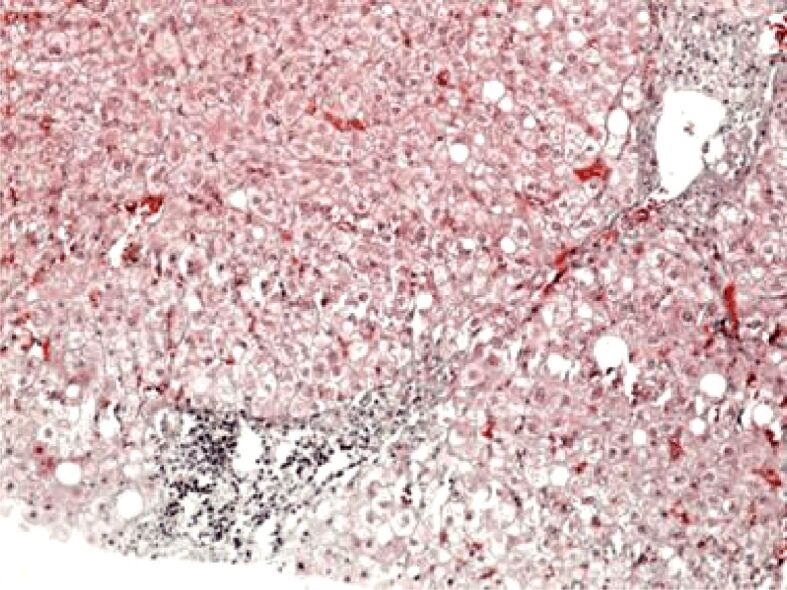
Histopathological aspect of chronic viral hepatitis C. Periportal fibrosis (F2). Masson’s trichrome staining, ×100
Figure 5.
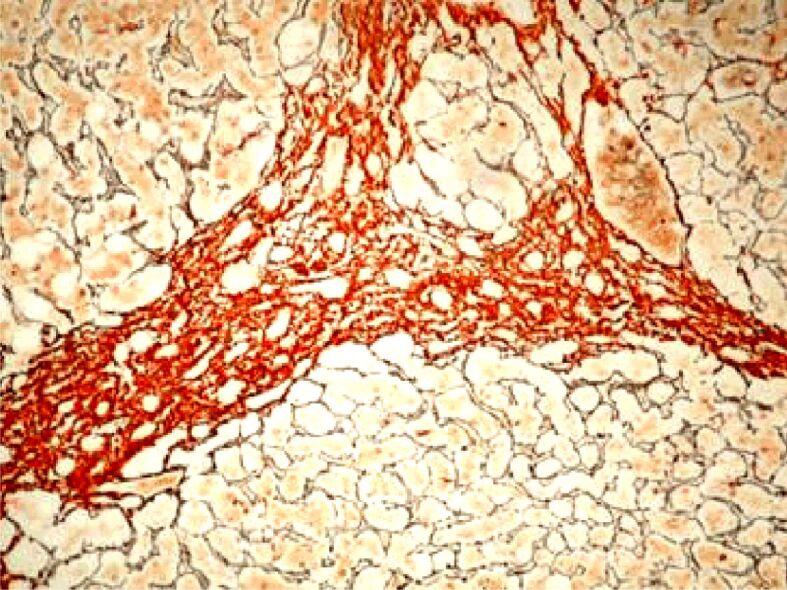
Histopathological aspect of chronic viral hepatitis C. Bridging fibrosis (F4). Argentic impregnation, ×100
Figure 6.
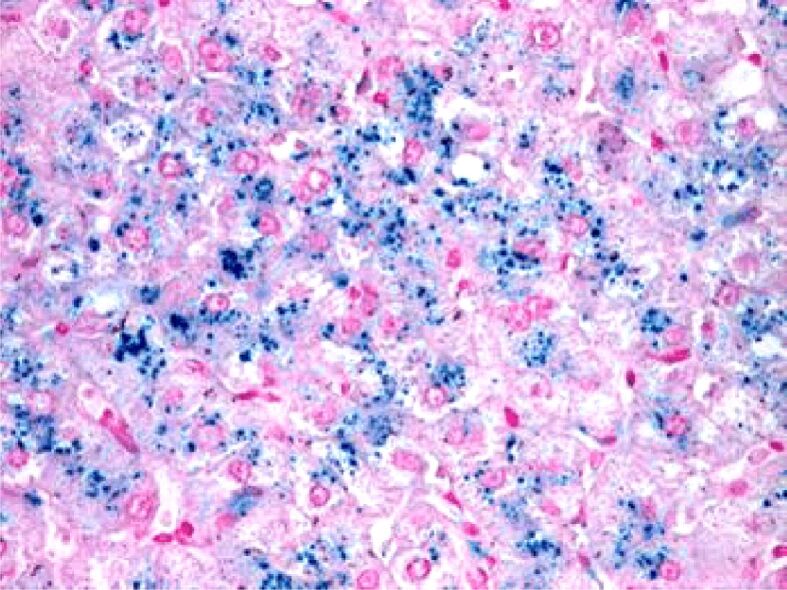
Histopathological aspect of chronic viral hepatitis C. Perl’s staining was positive for iron pigment within the hepatocytes, ×100
Study on EVR: varying degrees of age, biochemical and HP parameters
One hundred forty-five (69.04%) had therapeutic success (EVR=1) and a mean age of 42.68 years in relation to all the subjects included in the study. Sixty-five (30.95%) had a mean age of 44.09 years regarding patients with treatment failure (EVR=0).
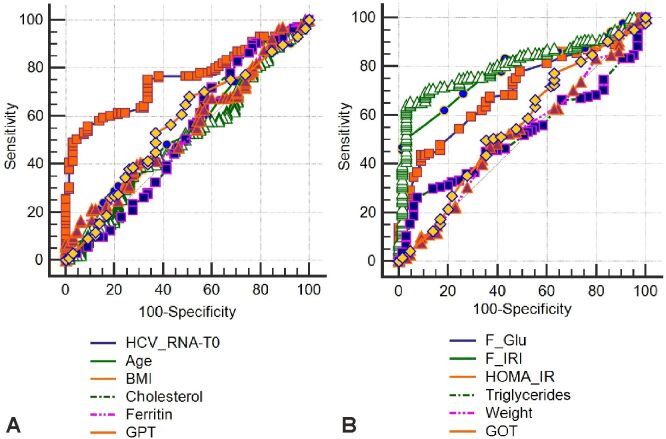
In order to assess their degree of impact on getting EVR, these parameters were introduced in an area under curve (AUC) analysis (Figure 7, A and B). In the same way, we evaluated the HP parameters (Figure 8). The limit values from these parameters that could anticipate the therapeutic success in CHC are shown in Table 7.
Figure 7.
(A and B) ROC curve for clinical-biochemical parameters. BMI: Body mass index; GOT: Glutamate oxaloacetate transaminase (aspartate aminotransferase – AST); GPT: Glutamate pyruvate transaminase (alanine aminotransferase – ALT); HCV_RNA: Hepatitis C viral load (ribonucleic acid – RNA); HOMA-IR: Homeostatic model assessment of insulin resistance; ROC: Receiver operating characteristic
Figure 8.
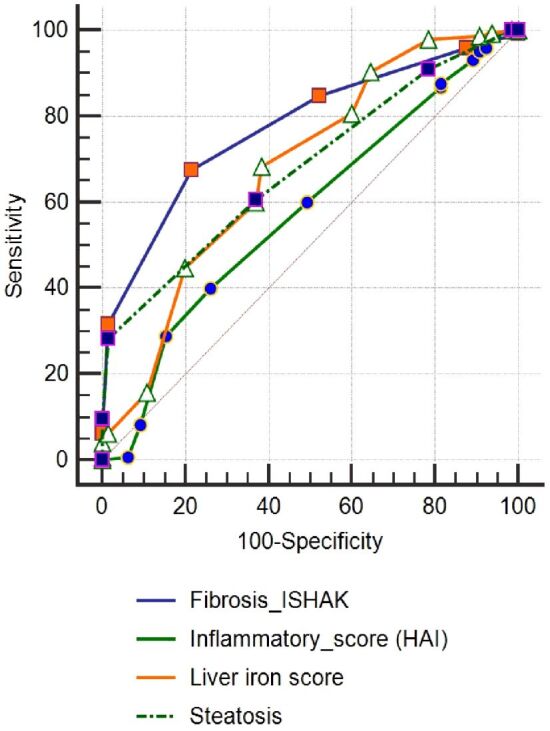
ROC curve for histopathological parameters. HAI: Histology activity index; ROC: Receiver operating characteristic
Table 7.
Values of the parameters with predictive role for the therapeutic success
|
Parameter |
Optimal value |
95% CI |
Sensibility [%] |
Specificity [%] |
|
HOMA-IR index |
≤2.98 |
2.54 to 3.92 |
71.03 |
87.69 |
|
HCV-RNA initial value [IU/mL] |
≤3 700 000 |
2 200 000 to 3 700 000 |
75.17 |
66.15 |
|
Fasting insulin [μU/mL] |
≤15.8 |
12 to 15.8 |
83.45 |
56.92 |
|
Fasting glucose [mg/dL] |
≤110 |
100 to 110 |
77.93 |
50 |
|
Ishak fibrosis score |
≤3 |
2 to 3 |
84.83 |
47.69 |
|
Steatosis score |
≤3 |
2 to 2 |
91.03 |
21.54 |
|
Iron loading score |
≤27 |
20 to 27 |
97.93 |
21.54 |
|
Necroinflammatory score (HAI) |
≤14 |
– |
98.62 |
6.15 |
CI: Confidence interval; HAI: Histology activity index; HCV-RNA: Hepatitis C viral load (ribonucleic acid – RNA); HOMA-IR: Homeostatic model assessment of insulin resistance
Study on SVR: different degree of age, biochemical and HP parameters
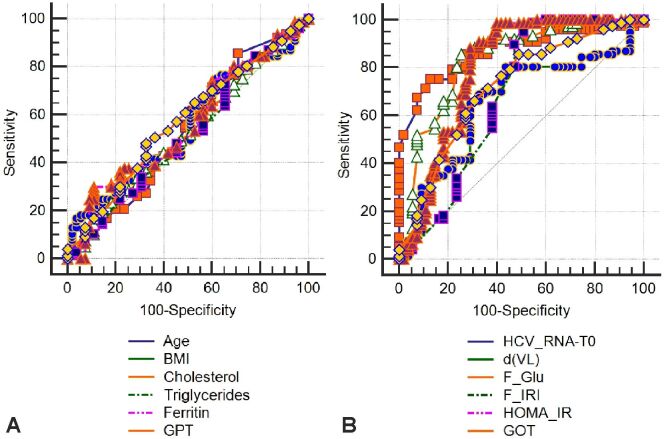
The 145 patients who achieved EVR were investigated for the factors involved in achieving SVR, while the other 65 with treatment failure were removed from the statistics. Overall, SVR was found in 106/145 (73.1%) patients of the total EVR achieved, i.e., 50.47% of all patients in the initial group (χ2=30.04, p<0.001). In order to estimate their degree of effect on getting SVR, these parameters were introduced in an AUC investigation (Figure 9, A and B; Figure 10).
Figure 9.
(A and B) ROC curve for clinical-biochemical parameters. BMI: Body mass index; d(VL): Viral load differences; GOT: Glutamate oxaloacetate transaminase (aspartate aminotransferase – AST); GPT: Glutamate pyruvate transaminase (alanine aminotransferase – ALT); HCV_RNA: Hepatitis C viral load (ribonucleic acid – RNA); HOMA-IR: Homeostatic model assessment of insulin resistance; ROC: Receiver operating characteristic
Figure 10.
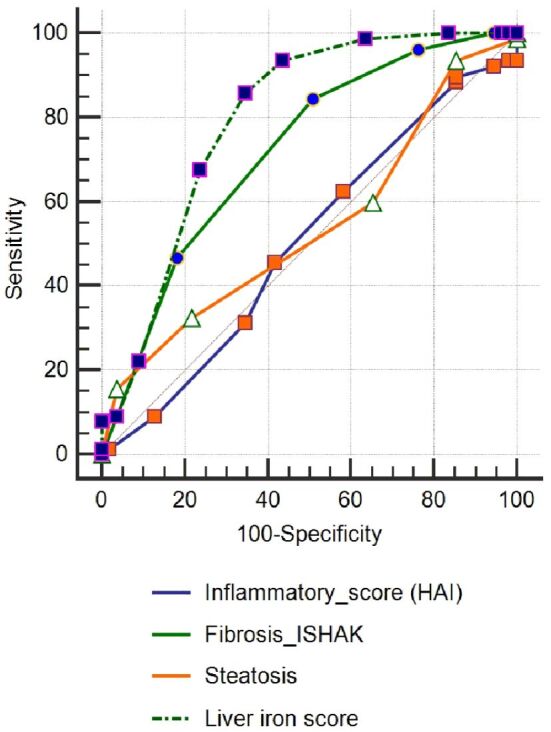
ROC curve for histopathological parameters. HAI: Histology activity index; ROC: Receiver operating characteristic
An exploration related to the influence of clinical, biochemical and HP parameters was also completed. In an AUC analysis, these parameters were added to estimate their degree of influence on obtaining SVR. The results are shown in Table 8.
Table 8.
The limit values of the parameters for the SVR prognosis
|
Parameter |
Optimal value |
95% CI |
Sensibility [%] |
Specificity [%] |
|
Iron loading score |
≤15 |
15 to 15 |
79.25 |
92.31 |
|
HOMA-IR index |
≤2.76 |
2.39 to 3.20 |
85.85 |
79.49 |
|
HCV-RNA initial value [IU/mL] |
≤3 990 000 |
2 000 000 to 5 100 000 |
86.79 |
53.85 |
|
Level of serum insulin at the beginning of treatment [mIU/L] |
≤14 |
11 to 14 |
90.57 |
56.41 |
|
Level of serum glucose at the beginning of treatment [mg/dL] |
≤114 |
100 to 118 |
92.45 |
28.21 |
|
Ishak fibrosis score |
≤3 |
2 to 3 |
98.11 |
51.28 |
|
Steatosis score |
≤3 |
3 to 3 |
99.06 |
30.77 |
CI: Confidence interval; HCV–RNA: Hepatitis C viral load (ribonucleic acid – RNA); HOMA-IR: Homeostatic model assessment of insulin resistance; SVR: Sustained virological response
⧉ Discussions
Our research shows that factors related to treatment failure in CHC are related to older age, high hepatitis C viral load, and impaired glucose tolerance at the start of treatment (high fasting glucose and insulin, high HOMA-IR index) and also to characteristics of liver histology (high fibrosis score, liver histology score, liver insulin, high HOMA-IR index) There is no doubt that, while these factors have also been recognized, at least in part, by other authors, there are still some discussions about specific aspects.
Older age has a negative interrelation with viral response, but no effect has been observed associated with the degree of cytolysis or serum ferritin levels, while high initial hepatitis C viral load is a strongly negative therapeutic success prognosticator. In a study conducted by García-Samaniego et al. [17] in elderly patients treated with PEG–IFN-α2a/Ribavirin, genotype 1/4 and high gamma-glutamyltranspeptidase (GGT) were associated with a lack of EVR in patients treated with PEG–IFN-α2a/Ribavirin.
All parameters characterizing IR (high fasting glucose, high insulin, and high HOMA-IR index) have been shown to be negative prognosticators for both EVR and SVR achievement. It is recognized that, irrespective of the severity of liver disease, HCV infection may induce IR and there is documentation of a central role for IR in failure to achieve SVR in patients with HCV and there are several studies certifying this evidence [18]. Ziada et al. [19] reviewed 140 patients with CHC treated with combination therapy (PEG–IFN-α2a plus Ribavirin) for 48 weeks, divided into two classes according to the homeostasis model as a 48-week combination therapy (PEG–IFN-α2a plus Ribavirin) to test IR as the prognosticator of the severity of hepatic fibrosis and its effect on early viral kinetics and virological response to HCV therapy in Egyptian HCV patients. The research showed that advanced fibrosis was significantly linked to older age, higher BMI, and HOMA-IR index ≥2. In the IR-HCV group, rapid virological response, full EVR and SVR were significantly lower than in the non-IR-HCV group. At the same time, the BMI, the level of plasma insulin and HOMA-IR index decreased significantly compared to the initial levels in patients who achieved SVR. This implies a relationship of cause and effect between HCV infection and IR. Our outcome is consistent with these results, given that IR is associated with progressive fibrosis and sluggish viral kinetics in chronic HCV patients, and may be an indicator of a lack of rapid and EVR.
Our research shows that in CHC treated with normal PEG–IFN and Ribavirin for 48 weeks, a high degree of liver steatosis impairs both EVR and SVR, and that a steatosis score of ≤3 predicts EVR with a 91.03% sensitivity and a 21.54% specificity. Undoubtedly, in patients with chronic HCV infection, hepatic steatosis is frequently seen, and the prevalence is much higher than in the general population or in patients with chronic hepatitis B (CHB). Hepatic steatosis may be due to high BMI, obesity, hyperlipidemia, metabolic syndrome, and diabetes mellitus in subjects with CHC, in which IR plays an important role. Hepatic steatosis can result from the direct viral cytopathic effect of HCV genotype 3 (G3-HCV) infection. Hepatic steatosis-related demographic and clinical individuals in patients with CHC, including older age, higher BMI, more G3-HCV infections, and higher mean serum TG, ALT, and GGT levels. In patients with CHC, the clinical significance of hepatic steatosis involves a close association with hepatic fibrosis and an unsatisfactory response to combined treatment with PEG–IFN and Ribavirin. In addition, hepatic steatosis has been documented to be correlated with an increased incidence of HCC in patients with chronic HCV infection [20,21,22]. Others also certify this observation made by our research. Indeed, as noted by Petta et al. [18], IR and overt diabetes appear to be major determinants of advanced fibrosis in subjects with HCV genotype 1 (G1-HCV) infection, irrespective of the degree of steatosis, primarily in the presence of severe necroinflammation. The course of CHC may be affected by certain metabolic factors. Steatosis is determined by IR, but its direct role in influencing the development of hepatic fibrosis is unclear. The group assessed whether rising IR levels are associated with steatosis and higher fibrosis stages in CHC patients with G1-HCV infection in 210 consecutive patients. Liver biopsy and anthropometric and metabolic studies, including IR, have been tested in patients (by homeostasis model evaluation). When HOMA-IR index was >2.7, nondiabetic patients were characterized as insulin resistant. For staging and grading, all biopsies were scored by one pathologist and graded for steatosis. In the multivariate analysis, high necroinflammatory activity, low platelets, low cholesterol, high ferritin and high IR prevalence were individually associated with fibrosis of ≥3. Diabetic patients were twice as likely as those with IR but no diabetes (30%) to have severe fibrosis (60%).
The liver iron score is, in our view, an important predictor for both EVR and SVR. Our investigation shows that with a sensitivity of 97.93% and a specificity of 21.54%, an iron score of >27 can predict a favorable therapeutic effect. The accumulation of liver iron in patients with CHC has gained increasing consideration in recent years, despite the small number of statements in this investigation [23]. The prevalence and severity of liver iron deposition in CHC was determined by Fujita et al. [11, 24], evaluating its correspondence with clinical, biochemical and HP characteristics. The investigation used liver biopsy samples from 103 patients infected with HCV and 34 infected with HBV, assessed by total iron score (TIS) measurement. The authors noted that patients with CHC had a significantly higher TIS than patients with CHB and that TIS was significantly associated with HP classification in patients with CHC.
In non-SVRs, TIS pretreatment was significantly higher than in IFN/Ribavirin treatment SVRs. Multiple regression analysis showed that TIS was the only independent variable correlated with IFN/Ribavirin resistance, concluding that liver iron deposition was associated with progression of liver disease and with resistance to treatment with IFN/Ribavirin. The same group [11, 24] also found hepatic oxidative deoxyribonucleic acid (DNA) damage to be frequent and strongly correlated with increased iron deposition and hepatic inflammation in patients with CHC, indicating that iron overload is an important mediator of hepatic oxidative stress.
⧉ Conclusions
Studying the results of this research, it is shown that the HOMA-IR index, serum insulin levels, baseline HCV-RNA, baseline mean blood glucose and HP score like Ishak fibrosis score, steatosis score and liver iron score may be of prognostic significance for the acquisition of an EVR in CHC. Our research shows that an iron score of less than 27, with a sensitivity of 97.93% and a specificity of 21.54%, can predict an encouraging therapeutic effect.
Conflict of interest
The authors declare that they have no conflict of interests.
Authors’ contribution
Alice Elena Ghenea and Mihaela Popescu have equally contributed to this study.
References
- 1.Blatt LM, Mutchnick MG, Tong MJ, Klion FM, Lebovics E, Freilich B, Bach N, Smith C, Herrera J, Tobias H, Conrad A, Schmid P, McHutchison JG. Assessment of hepatitis C virus RNA and genotype from 6807 patients with chronic hepatitis C in the United States. J Viral Hepat. 2000;7(3):196–202. doi: 10.1046/j.1365-2893.2000.00221.x. [DOI] [PubMed] [Google Scholar]
- 2.Zeuzem S. Heterogeneous virologic response rates to interferon-based therapy in patients with chronic hepatitis C: who respond less well. Ann Intern Med. 2004;140(5):370–381. doi: 10.7326/0003-4819-140-5-200403020-00033. [DOI] [PubMed] [Google Scholar]
- 3.Petta S. Insulin resistance and diabetes mellitus in patients with chronic hepatitis C: spectators or actors. Dig Liver Dis. 2012;44(5):359–360. doi: 10.1016/j.dld.2012.02.001. [DOI] [PubMed] [Google Scholar]
- 4.***. NIH Consensus Statement on management of hepatitis C: 2002. NIH Consens State Sci Statements. 2002;19(3):1–46. [PubMed] [Google Scholar]
- 5.Carr RM, Oranu A, Khungar V. Nonalcoholic fatty liver disease: pathophysiology and management. Gastroenterol Clin North Am. 2016;45(4):639–652. doi: 10.1016/j.gtc.2016.07.003. [DOI] [PMC free article] [PubMed] [Google Scholar]
- 6.Marchesini G, Bugianesi E, Forlani G, Cerrelli F, Lenzi M, Manini R, Natale S, Vanni E, Villanova N, Melchionda N, Rizzetto M. Nonalcoholic fatty liver, steatohepatitis, and the metabolic syndrome. Hepatology, 2003, 37(4):917-923. Erratum in: Hepatology. 2003;38(2):536–536. doi: 10.1053/jhep.2003.50161. [DOI] [PubMed] [Google Scholar]
- 7.Almeda-Valdes P, Aguilar-Olivos N, Uribe M, Méndez-Sánchez N. Common features of the metabolic syndrome and nonalcoholic fatty liver disease. Rev Recent Clin Trials. 2014;9(3):148–158. doi: 10.2174/1574887109666141216103908. [DOI] [PubMed] [Google Scholar]
- 8.Lauer GM, Walker BD. Hepatitis C virus infection. N Engl J Med. 2001;345(1):41–52. doi: 10.1056/NEJM200107053450107. [DOI] [PubMed] [Google Scholar]
- 9.Di Bisceglie AM, Axiotis CA, Hoofnagle JH, Bacon BR. Measurements of iron status in patients with chronic hepatitis. Gastroenterology. 1992;102(6):2108–2113. doi: 10.1016/0016-5085(92)90339-z. [DOI] [PubMed] [Google Scholar]
- 10.Bonkovsky HL. Iron as a comorbid factor in chronic viral hepatitis. Am J Gastroenterol. 2002;97(1):1–4. doi: 10.1111/j.1572-0241.2002.05390.x. [DOI] [PubMed] [Google Scholar]
- 11.Fujita N, Sugimoto R, Urawa N, Araki J, Mifuji R, Yamamoto M, Horiike S, Tanaka H, Iwasa M, Kobayashi Y, Adachi Y, Kaito M. Hepatic iron accumulation is associated with disease progression and resistance to interferon/ribavirin combination therapy in chronic hepatitis C. J Gastroenterol Hepatol. 2007;22(11):1886–1893. doi: 10.1111/j.1440-1746.2006.04759.x. [DOI] [PubMed] [Google Scholar]
- 12.Sherrington CA, Olynyk JK. Iron as a cofactor in chronic hepatitis C infection. Liver. 2002;22(3):187–189. doi: 10.1046/j.0106-9543.2002.00002.x. [DOI] [PubMed] [Google Scholar]
- 13.Turlin B, Deugnier Y. Evaluation and interpretation of iron in the liver. Semin Diagn Pathol. 1998;15(4):237–245. [PubMed] [Google Scholar]
- 14.Popescu NL, Predescu OI, Badea O, Pirici I, Pantiş C, Busuioc CJ, Cotoi BV, Mogoantă L. The process of liver fibrosis in chronic hepatitis C - histological and immuno-histochemical study. Rom J Morphol Embryol. 2018;59(4):1121–1126. [PubMed] [Google Scholar]
- 15.Angulo P, Keach JC, Batts KP, Lindor KD. Independent predictors of liver fibrosis in patients with nonalcoholic steatohepatitis. Hepatology. 1999;30(6):1356–1362. doi: 10.1002/hep.510300604. [DOI] [PubMed] [Google Scholar]
- 16.Brunt EM, Janney CG, Di Bisceglie AM, Neuschwander-Tetri BA, Bacon BR. Nonalcoholic steatohepatitis: a proposal for grading and staging the histological lesions. Am J Gastroenterol. 1999;94(9):2467–2474. doi: 10.1111/j.1572-0241.1999.01377.x. [DOI] [PubMed] [Google Scholar]
- 17.García-Samaniego J, Romero M, Granados R, Alemán R, Jorge Juan M, Suárez D, Pérez R, Castellano G, González-Portela C. Factors associated with early virological response to peginterferon-α-2a/ribavirin in chronic hepatitis C. World J Gastroenterol. 2013;19(12):1943–1952. doi: 10.3748/wjg.v19.i12.1943. [DOI] [PMC free article] [PubMed] [Google Scholar]
- 18.Petta S, Cammà C, Di Marco V, Alessi N, Cabibi D, Caldarella R, Licata A, Massenti F, Tarantino G, Marchesini G, Craxì A. Insulin resistance and diabetes increase fibrosis in the liver of patients with genotype 1 HCV infection. Am J Gastroenterol. 2008;103(5):1136–1144. doi: 10.1111/j.1572-0241.2008.01813.x. [DOI] [PubMed] [Google Scholar]
- 19.Ziada DH, El Saadany S, Enaba M, Ghazy M, Hasan A. The interaction between insulin resistance, liver fibrosis and early virological response in Egyptian patients with chronic hepatitis C. Can J Gastroenterol. 2012;26(6):325–329. doi: 10.1155/2012/291457. [DOI] [PMC free article] [PubMed] [Google Scholar]
- 20.Hwang SJ, Lee SD. Hepatic steatosis and hepatitis C: still unhappy bedfellows. J Gastroenterol Hepatol. 2011;26(Suppl 1):96–101. doi: 10.1111/j.1440-1746.2010.06542.x. [DOI] [PubMed] [Google Scholar]
- 21.Laurito MP, Silva GF, Cheinquer H, Sharma R, Verna E, Parise ER. Does insulin resistance impair the virological response to peginterferon/ribavirin in chronic hepatitis C genotype 3 patients. Arq Gastroenterol. 2018;55(2):179–183. doi: 10.1590/S0004-2803.201800000-32. [DOI] [PubMed] [Google Scholar]
- 22.Ţieranu EN, Donoiu I, Istrătoaie O, Găman AE, Ţieranu ML, Ţieranu CG, Gheonea DI, Ciurea T. Rare case of single coronary artery in a patient with liver cirrhosis. Rom J Morphol Embryol. 2017;58(4):1505–1508. [PubMed] [Google Scholar]
- 23.Thorburn D, Curry G, Spooner R, Spence E, Oien K, Halls D, Fox R, McCruden EAB, MacSween RNM, Mills PR. The role of iron and haemochromatosis gene mutations in the progression of liver disease in chronic hepatitis C. Gut. 2002;50(2):248–252. doi: 10.1136/gut.50.2.248. [DOI] [PMC free article] [PubMed] [Google Scholar]
- 24.Fujita N, Horiike S, Sugimoto R, Tanaka H, Iwasa M, Kobayashi Y, Hasegawa K, Ma N, Kawanishi S, Adachi Y, Kaito M. Hepatic oxidative DNA damage correlates with iron overload in chronic hepatitis C patients. Free Radic Biol Med. 2007;42(3):353–362. doi: 10.1016/j.freeradbiomed.2006.11.001. [DOI] [PubMed] [Google Scholar]


