

Abstract
Introduction
Immunoglobulin (Ig)A nephropathy (IgAN) is the most frequently diagnosed primary glomerulonephritis worldwide. Despite the common diagnostic feature of mesangial IgA-containing immune complex deposition, the clinical course of the disease is extremely variable, with 30% of patients developing end-stage kidney disease within 20 years of diagnosis. Therefore, identifying which patients are likely to progress is paramount.
Results
In this pilot study, we found that urinary exosomal miR-204 expression was significantly reduced in IgAN compared with healthy subjects. However, there was no difference in miR-204 expression between IgAN and non-IgAN chronic kidney disease controls. Analysis of miR-204 expression in kidney biopsy cores by next-generation sequencing followed by quantitative polymerase chain reaction validation in independent cohorts demonstrated that expression of miR-204 was significantly lower in IgAN compared with thin-membrane nephropathy but not compared with membranous nephropathy. Patients with IgAN at high risk of future progression had significantly lower expression of miR-204 than those at low risk of progression. Cortical localization indicated that miR-204 was preferentially expressed in the interstitium compared with glomeruli in IgAN nonprogressors and that this distribution was lost in IgAN progressors. Receiver operating characteristic curve analysis between the 2 IgAN cohorts revealed an area under the curve of 0.82. In addition, miR-204 expression correlated with known clinicopathological prognostic risk factors. Importantly, incorporating miR-204 into the International IgAN risk prediction tool improved the diagnostic power of the algorithm to predict risk of progression.
Conclusion
Additional large-scale studies are now needed to validate the additive value of miR-204 in improving risk prediction in IgAN and more broadly in chronic kidney disease.
Keywords: exosomes, IgA nephropathy, microRNA, renal biopsy, renal progression
Graphical abstract

Immunoglobulin (Ig)A nephropathy (IgAN) is the most commonly diagnosed primary glomerulonephritis in the world.1 Diagnosis is confirmed by the demonstration of mesangial IgA-containing immune complexes. Although mesangial accumulation of IgA is a unifying feature of IgAN, the extent of IgA deposition does not appear to correlate with clinical phenotype, in particular the subsequent risk of kidney failure. Approximately 30% of patients will progress to end-stage kidney disease (ESKD) within 20 years of diagnosis, whereas one-third will maintain normal kidney function, despite continued asymptomatic abnormal urinalysis. Identifying patients at increased risk of progression at an early stage is a clinical priority both to ensure patients are appropriately counseled about their disease and to allow potentially toxic immunomodulatory treatments to be directed to those patients most at risk of kidney failure.2 At present, the gold standard for predicting risk of progression in IgAN is the International IgAN Risk Prediction Tool (IIgANRPT), which uses demographic and baseline clinicopathological variables.3, 4, 5 It is accepted that this risk prediction tool is likely to evolve over time as new variables are added to refine prognostication. In this article, we present data to support the further evaluation of miR-204 as a likely prognostic factor that could help to refine prognostication in IgAN.
MicroRNAs (miRs) are short, 22-base noncoding RNA molecules that modulate gene expression, primarily by targeting the 3'UTR of target mRNA.6 Although miRs are involved in myriad important physiological processes, their dysregulation is known to be associated with a variety of diseases.7, 8, 9 A small number of miRs are now recognized as having direct associations with IgAN. One of these, miR-148b, is known to target core 1 galactosyltransferase in B cells, the key enzyme involved in the galactosylation of the IgA1 molecule at the hinge region and thereby contributes to the generation of what is now accepted as the “pathogenic” form of the IgA molecule.10 Numerous other studies have investigated miRs associated with more generalized aspects of kidney disease, including fibrosis and/or inflammation, which are equally relevant to the downstream pathways operating in IgAN.11,12 Few studies, however, have sought to find miRs or specific miR signatures able to predict progression itself. We have recently reported that miR-150 expression in the kidney is strongly associated with the risk of future progression in IgAN.13 Moreover, addition of miR-150 levels to the IIgANRPT resulted in improved prognostic accuracy.
In a study by Szeto et al., a urine sediment miR signature was reported that could discriminate Chinese patients with IgAN from healthy subjects (HS).14 Moreover, one of the miRs, miR-204, appeared to be the major driver for this discrimination, with a receiver operating characteristic area under the curve of 0.976. Because miR-204 is known to be enriched in the kidney,15 changes in the urine excretion of miR-204 with kidney disease could signify a direct relationship between intrarenal miR-204 and the pathophysiology of kidney disease. Although of potential interest, the study by Szeto et al. was small, performed solely in a Chinese cohort, and did not include kidney disease control subjects. Furthermore, because urine sediment comprises cell debris from a variety of cell types,16, 17, 18, 19, 20 it is an undefined and variable source of RNA that is often degraded and of low quality.17 In this study, we measured miR expression in the exosomal fraction of urine. miRs encapsulated within exosomes are protected from degradative enzymes such as RNAses and proteases likely to be found in urine.20 More important, because they are known to be involved in intercellular communication, they are likely to have been specifically generated in response to the disease process.21
Before embarking on a large validation study of miR-204, we chose to undertake a focused pilot investigation to evaluate urine miR-204 as a potential diagnostic biomarker in Caucasians with IgAN, assess the specificity of the earlier results by incorporating chronic kidney disease (CKD) controls, and determine how urine excretion of miR-204 related to intrarenal modulation of miR-204 with kidney disease.
Methods
Kidney biopsy and urine samples
Frozen kidney biopsy cores, formalin-fixed paraffin-embedded (FFPE) tissue, and urine samples were obtained after written consent. Approval for the study was granted by the Northamptonshire, Leicestershire, and Rutland Ethics Committee (UHL 09873). Kidney tissue from cases of membranous nephropathy (MN) were used as CKD controls, and cases of thin membrane nephropathy (TMN) with estimated glomerular filtration rate (eGFR) >90 ml/min/1.73 m2 and normal light microscopy appearances were included as “normal” controls. All included cases were Caucasian. Fifteen urine samples were obtained from biopsy-proven IgAN patients, 8 from patients with CKD of various etiologies, and 6 HS. Baseline characteristics for all patients included in the kidney biopsy component of the study can be found in our previous publication.13 Baseline data for patients who provided urine samples can be found in Table 1.
Table 1.
Patient demographics
| Age | eGFR (ml/min/1.73 m2) | 24-h UP (g/d) | M:F | |
|---|---|---|---|---|
| IgAN | 49.1 ± 4.5 | 54.3 ± 6.5 | 1.90 ± 0.5 | 10:5 |
| Non-IgAN | 66.8 ± 6.0 | 46.0 ± 10.2 | 0.5 ± 0.3 | 6:2 |
F, female; IgAN, immunoglobulin A nephropathy; M, male; UP, urine protein.
Demographic and clinical data of patients at the time of urine collection for 15 IgAN and 12 non-IgAN chronic kidney disease patients. No clinical data were available for 6 healthy subjects.
All IgAN cases had a minimum of 10-year follow-up from diagnosis, and none had received immunosuppression treatment either at the time of biopsy or in the subsequent follow-up period. Cases of rapidly progressive IgAN requiring immunosuppression were excluded from the study. Cases were classified as “nonprogressors” (IgANnp) if the serum creatinine had changed by <10% over the 10 years since diagnosis. Cases where the serum creatinine had at least doubled or the patient had developed ESKD in the same time period were classified as “progressors” (IgANp).
Urine exosome extraction
Urinary exosomes were extracted using exosome isolation solution for culture media (Invitrogen, Waltham, MA) as directed by the manufacturer’s instructions. Briefly, exosomes were isolated from 1 ml of urine by centrifuging at 2000g for 30 minutes to remove cell debris. Total Exosome Isolation Reagent (0.5 ml) was added to the cleared urine supernatant, vortexed vigorously and incubated at 4°C overnight. The samples were then centrifuged at 10,000g, at 4°C for 1 hour. Exosomes present in the pellet were resuspended in 700 μl QIAzol (Qiagen, Hilden, Germany) ready for RNA extraction.
RNA extraction
RNA was extracted from urinary exosomes, biopsy cores, and laser-captured micro-dissected tissue using miRNeasy Mini kit (Qiagen) as directed by the manufacture’s protocol.
Reverse transcription polymerase chain reaction
RNA samples were diluted to 2 ng/μl and reverse transcribed using the TaqMan microRNA reverse transcription (RT) kit using specific Taqman (Applied Biosystems ThermoFisher) RT miR primers. Polymerase chain reaction (PCR) was performed using TaqMan universal mastermix with UNG using miR-specific Taqman PCR assays. Quantitative PCR (qPCR) data were normalized using miR-191 housekeeping miR.
Next-generation sequencing
RNA extracted from 6 frozen kidney biopsy cores from each of the 4 cohorts (IgANp, IgANnp, MN, TMN) were processed and next-generation sequenced by Exiqon (Vedbaek, Denmark) on the Illumina sequencing technology platform as previously described.13
Validation qPCR
miR validation was performed by RT-qPCR on RNA extracted from the biopsy cores of a further 4 cohorts of 20 independent patients as previously described.13
Cortical localisation
Glomerular and interstitial tissue in the immediate vicinity of the glomerulus was laser-capture microdissection from FFPE sections from patients with IgAN, MN, and TMN (Table 2). FFPE sections (4 μM) were deparaffinized using 3 × 5 min incubations in xylene. Laser-capture microdissection was performed using Arcturus Capsure Macro LCM (Arcturus Engineering Inc., Mountain View, CA) caps on an Arcturus PixCell II.
Table 2.
Patient numbers
| Analysis | IgANnp | IgANp | MN | TMN |
|---|---|---|---|---|
| Biopsy cores | ||||
| NGS | 6 | 6 | 6 | 6 |
| Validation RT-PCR | 20 | 20 | 20 | 20 |
| Urine samples | IgAN | CKD | HS |
|---|---|---|---|
| 15 | 8 | 6 |
| No. of kidney biopsies subjected to LCMD | IgANnp G | IgANnp I | IgANp G | IgANp I | TMN G | TMN I |
|---|---|---|---|---|---|---|
| 6 | 7 | 7 | 6 | 10 | 7 |
G, glomeruli; I, interstitium; IgAN, immunoglobulin A nephropathy; IgANnp, IgAN nonprogressor; IgANp, IgAN progressor; LCMD, laser-capture microdissection; NGS, next-generation sequencing; RT-PCR = reverse transcriptase polymerase chain reaction; TMN, thin membrane nephropathy.
Summary of patient numbers used for each analysis. LCMD was performed on formalin fixed paraffin embedded sections. For further clinical information, please see our previous study.13
Statistics
Relative miR expression levels were calculated according to the Livak equation.22 RT-qPCR results were analyzed using GraphPad Prism 7. D’Agostino-Pearson omnibus normality tests were performed on data sets where n > 8, whereas the Shapiro-Wilk normality test was used for data sets with n < 8. Two variables were compared by t test (parametric data), or, for nonparametric data, the Mann-Whitney test was applied. When comparing more than 2 variables, a 1-way analysis of variance with Bonferroni post hoc correction was used (parametric), whereas a Kruskal-Wallis test was used for nonparametric data. A confidence interval of 0.95, P ≤ 0.05, was applied for all statistical tests.
The IIgANRPT constitutes 2 Cox proportional hazards models of time from biopsy to the primary outcome (50% decline in eGFR from that at biopsy or ESKD) censored at death or the end of follow-up with or without race as a predictor variable. Additional predictor variables in both models include eGFR, mean arterial blood pressure, proteinuria, and age at biopsy; the MEST histology scores; and the use of renin angiotensin system blockers or immunosuppression at or before biopsy. The linear predictor for each patient in the dataset was derived using the beta-coefficients from the IIgANRPT models and values of the prediction variable in the analytic dataset. The predicted risk of the primary outcome based on the IIgANRPT was generated using the linear predictor and the baseline survival from the original IIgANRPT publication. To assess the prediction value of miR-204 when added to the IIgANRPT, new Cox proportional hazards models were generated with miR-204 as the only covariate and the linear predictor as an offset (coefficient fixed at one). Discrimination was assessed using the C-statistic adapted for censoring and evaluated using the 4-year risk of the primary outcome.5 Reclassification was assessed using the continuous net reclassification improvement and integrated discrimination improvement adapted for censoring.5 Analyses were performed using SAS Version 9.4 (SAS Institute, Cary, NC).
Results
Expression of miR-204 in Caucasian urine exosomes
To determine whether changes in urinary miR-204 excretion are also seen in Caucasians with IgAN and whether these changes are specific for IgAN, we measured miR-204 expression in exosomes prepared from archived urines from patients with IgAN, non-IgAN CKD, and HS. We found significantly lower levels of miR-204 in urinary exosomes in IgAN compared with HS (P = 0.015). However, levels of miR-204 in non-IgAN CKD were similarly reduced compared with HS (P = 0.049). Importantly, we found no difference in urinary levels of miR-204 between IgAN and non-IgAN CKD (Figure 1).
Figure 1.
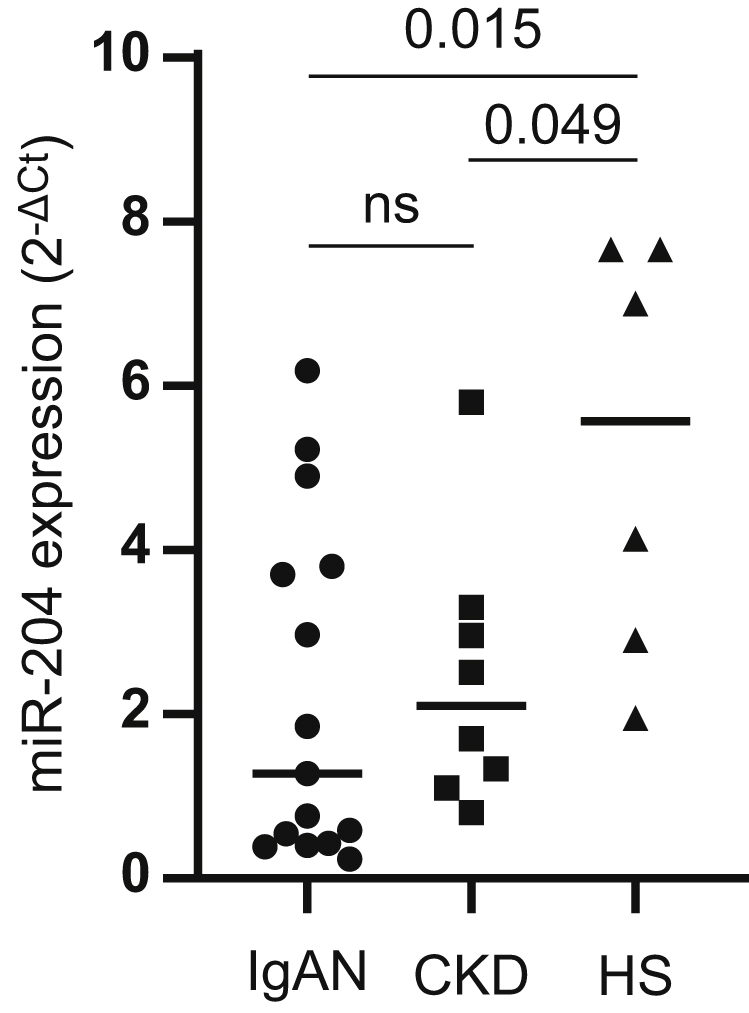
Expression of microRNA (miR)-204 in urine exosomes. RNA was extracted from exosomes obtained from the urines of patients with immunoglobulin A nephropathy (IgAN; n = 15), chronic kidney disease (CKD) (n = 8), and healthy subjects (HS) (n = 6) and analyzed for expression of miR-204 by reverse transcription polymerase chain reaction. Dot plot shows miR-204 expression in the 3 cohorts; IgAN versus HS (P = 0.015), CKD versus HS (P = 0.049), IgAN versus CKD (not significant). Results are expressed as mean ± SEM.
Kidney biopsy next-generation sequencing miR-204 expression
Given that the urinary source of exosomal miRs is likely to be the kidney, we analyzed previously generated next generation sequencing (NGS) data (Gene Expression Omnibus; accession # GSE141344; https://www.ncbi.nlm.nih.gov/geo/)13 to assess miR-204 expression in kidney biopsy cores. In this “discovery” cohort, miR-204 expression was significantly lower in IgAN cases compared with those with TMN (P = 0.0024) (Figure 2a) and between IgAN and MN (P = 0.017) patients (Figure 2b). However, there was no significant difference in miR-204 between MN and TMN (Figure 2c). Classification of IgAN patients into future nonprogressors and progressors revealed that miR-204 expression was significantly lower in those patients that later progressed (IgANp) compared with those with stable disease (IgANnp) (P = 0.0152) (Figure 2d).
Figure 2.

Discovery: expression of microRNA (miR)-204 in kidney biopsy cores. miR-204 expression in kidney biopsy cores was determined by next generation sequencing. Dot plots compare expression (tags per million [TPM]) between cohorts: immunoglobulin A nephropathy (IgAN) versus thin membrane nephropathy (TMN) (P = 0.0024), IgAN versus membranous nephropathy (MN) (P = 0.017), MN versus TMN (not significant [ns]), IgAN nonprogressors (IgANnp) versus IgAN progressors (IgANp) (P = 0.0152). Results are expressed as mean ± SEM of TPM.
Validation of miR204 expression
Validation of the NGS data was undertaken by RT-qPCR on an independent set of biopsy cores (20 per cohort). The data confirmed that there was a significant difference in miR-204 expression between IgAN versus TMN (P = 0.0047) (Figure 3a), although not between IgAN and MN (Figure 3b) or MN and TMN (Figure 3c). Importantly, we confirmed that miR-204 expression was significantly lower in the cases that later progressed (IgANp) compared with those with stable disease (IgANnp) (P = 0.0003) (Figure 3c).
Figure 3.

Validation: expression of microRNA (miR)-204 in kidney biopsy cores. miR-204 expression was validated by reverse transcription qualitative polymerase chain reaction in an independent set of biopsies (20 per cohort). Dot plots show miR-204 expression in each cohort: immunoglobulin A nephropathy (IgAN) versus thin membrane nephropathy (TMN) (P = 0.0024), IgAN versus membranous nephropathy (MN) (P = 0.017), MN versus TMN (not significant [ns]), IgAN progressors (IgANp) versus IgAN nonprogressors (IgANnp) (P = 0.0152). Results are expressed as means ± SEM of miR-204 expression (2-ΔCt).
Intrarenal miR-204 expression correlates with clinicopathological risk factors for progression
We next assessed whether intrarenal miR-204 expression correlated with clinicopathological risk factors associated with progression, including eGFR, proteinuria and components of the Oxford score. miR-204 expression significantly correlated with eGFR (R = 0.64, P < 0.0001) (Figure 4a) and negatively correlated with proteinuria (R = –0.484, P = 0.002) in IgAN (Figure 4b). By contrast, miR-204 expression did not correlate with eGFR (Figure 4c) and only exhibited a trend with urine protein/creatinine ratio (0.073) in MN and TMN (Figure 4d). There was no significant association of miR-204 expression with the mesangial hypercellularity or segmental sclerosis score of the Oxford classification (Figure 5a,c). However, a significant reduction in miR-204 expression was associated with the presence of the E1 lesion (P = 0.0167), and the T1/2 lesion (P = 0.003) (Figure 5b,d). It was not possible to assess any relationship with the C score because all included biopsies scored C0.
Figure 4.

Correlation of microRNA (miR)204 expression with estimated glomerular filtration rate (eGFR) and urine protein/creatinine ratio (UPCR). Correlation curves show miR-204 expression versus eGFR (R = 0.64, P < 0.0001) and versus UPCR (R = –0.484, P = 0.002) in immunoglobulin A nephropathy (IgAN) (a and b). membranous nephropathy (MN) and thin membrane nephropathy (TMN) did not correlate with eGFR (c) but showed a trend (P = 0.073) with UPCR (d).
Figure 5.

Relationship of microRNA (miR)204 expression to the mixed epithelial and stromal tumor (MEST)-C score. miR-204 expression was analyzed according the Oxford MEST-C score (M1 vs. M0; S1 vs. S0; E1 vs. E0, T1/2 vs. T0; all included biopsies were C0, and thus no comparison based on the C score was possible). There was no difference in miR-204 expression within the mesangial hypercellularity (M) or segmental sclerosis (S) lesions (a and c). However, a significant difference was seen within the endothelial hypercellularity (E) and interstitial fibrosis/tubular atrophy (T) lesions (b and d) (P = 0.0167 and P = 0.003, respectively).
Cortical location of miR-204 expression
To determine the cortical location of miR-204 expression, RNA was extracted from tissue isolated from glomerular and interstitial areas of FFPE biopsy sections, randomly chosen from the biopsy cores used for NGS and validation by laser capture microdissection, and analyzed by RT-qPCR. MiR-204 expression showed a trend toward higher expression in the interstitium compared to that in the glomeruli in IgAN cases with stable disease (IgANnp) and in TMN (P = 0.07 for both) (Figure 6). In contrast, there was no difference in miR-204 expression between the glomerular and interstitial compartments in those cases that later progressed (IgANp), consistent with a downregulation of this miR in the interstitium of patients at greatest risk of future kidney function decline. There was no difference in glomerular miR-204 expression among IgANnp, IgANp, and TMN (Figure 6).
Figure 6.

Cortical location of microRNA (miR)-204 expression. miR expression was measured in glomerular and tubulointerstitial tissue obtained following laser capture microdissection. The dot blot shows expression of miR-204 in the glomeruli (G) and interstitium (I) in immunoglobulin A nephropathy nonprogressors (IgANnp), progressors (IgANp), and thin membrane nephropathy (TMN). A trend in miR-204 expression was observed between glomeruli and interstitium in IgANnp biopsies (P = 0.07) and in TMN biopsies (P = 0.07), but no significant difference was seen in IgANp biopsies.
Power of miR-204 to identify future IgAN progressors and nonprogressors
To assess the discriminatory power of miR-204 in IgAN, a receiver operating characteristic curve was plotted comparing intrarenal miR-204 expression in IgANp and IgANnp. This revealed an area under the curve of 0.82 (P = 0.0005) (Figure 7a) with an expression value of <0.520, giving a 60% sensitivity with 90% specificity (Table 3). When the data from miR-204 were combined with the miR-150 data from our previous study,13 the area under the curve increased to 0.88 (P < 0.001) (Figure 7b).
Figure 7.

microRNA (miR)-204 expression discriminates immunoglobulin A nephropathy (IgAN) patients at greater risk of progression. (a) Receiver operating characteristic (ROC) curve showing miR-204 expression in progressors (IgANp) and nonprogressors (IgANnp). Area under the curve = 0.82 (P = 0.0005), expression of <0.52 gives a sensitivity of 60% with a specificity of 90% (Table 1). (b) Combining miR-204 and miR-150 (from our previous study) increased the area under the curve to 0.88 (P < 0.001). (c) Correlation curve of miR-204 expression versus predicted 5-year risk of a 50% decline in estimated glomerular filtration rate (eGFR) or end-stage kidney disease (ESKD) calculated using the International IgAN Risk Prediction Tool. (R = –0.6758, P < 0.0001).
Table 3.
Biomarker performance characteristics for miR204
| 2-ΔCt | Sensitivity | Specificity | LR | |
|---|---|---|---|---|
| <1.187 | High sensitivity | 100 | 15 | 1.176 |
| <0.4237 | High specificity | 40 | 100 | |
| <0.5201 | Best cut-off | 60 | 90 | 6 |
miR, MicroRNA.
The performance characteristics of miR-204 are presented. miR expression values for 100% sensitivity and 100% specificity are shown as well as the best cut-off values to attain best predictive performance with likelihood ratio (LR).
miR-204 expression correlates with IIgANRPT score
The IIgANRPT combines baseline demographic and clinicopathological variables to generate the risk of a 50% decline in eGFR or ESKD for up to 5 years after a kidney biopsy. We therefore assessed whether miR-204 expression at the time of biopsy correlated with the 5-year risk of a 50% decline in eGFR or ESKD in our cohort, as calculated by the IIGANRPT. The risk score significantly correlated with miR-204 expression (R = –0.6758, P < 0.0001) (Figure 7c).
miR-204 improves prediction when added to the IIgANPRT
The prediction performance of the original IIgANPRT models with and without race were next compared with the performance of the models with the addition of miR-204. When miR-204 was added to both the models with and without race, it was associated with a significant reduction in the risk of a 50% decline in eGFR or ESKD (hazard ratio 0.024; 95% confidence interval: 0.001, 0.64; P = 0.02; and hazard ratio 0.024, 95% confidence interval: 0.001, 0.65; P = 0.03 respectively). Compared with the original IIgANRPT models, the addition of miR-204 improved discrimination as assessed by a significant increase in the C-statistic, and improved reclassification as assessed by significant event and nonevent net reclassification improvement and significant integrated discrimination improvement values (Table 4).
Table 4.
Prediction performance of the IIgANPT with or without race applied to the analytic cohort alone, or in combination with microRNA (miR)-204
| C-stat (95% CI) | Δ C-stat (95% CI) | Event NRI (95% CI) | Nonevent NRI (95% CI) | IDI (95% CI) | |
|---|---|---|---|---|---|
| Model with race | 0.81 (0.76, 0.85) | Ref | Ref | Ref | Ref |
| Plus miR-204 | 0.90 (0.82, 0.96) | 0.09 (0.04, 0.15) | 0.64 (0.17, 0.96) | 0.54 (0.17, 0.82) | 0.35 (0.25, 0.44) |
| Model without race | 0.81 (0.76, 0.85) | Ref | Ref | Ref | Ref |
| Plus miR-204 | 0.90 (0.82, 0.95) | 0.10 (0.04, 0.15) | 0.64 (0.17, 0.96) | 0.54 (0.17, 0.82) | 0.32 (0.22, 0.41) |
CI, confidence interval; IDI, integrated discrimination improvement; IIgANRPT, International IgAN Risk Prediction Tool; NRI, net reclassification improvement; Ref= reference model.
The change (Δ) in C-statistic compares the IIgANRPT model with the biomarker to the IIgANRPT model alone. Prediction performance was evaluated using the 4-year risk of a 50% decline in estimated glomerular filtration rate or end-stage kidney disease. Significant net reclassification improvement and integrated discrimination improvement values are those whose 95%CI do not include zero.
Discussion
The purpose of this investigation was to undertake a focused pilot study to evaluate urine miR-204 as a potential diagnostic biomarker in Caucasians with IgAN, assess the specificity of previously published results and determine how urine excretion of miR-204 related to intrarenal modulation of miR-204 with kidney disease. A study in urine sediments by Szeto et al. reported that miR-204 could discriminate patients with IgAN from HS in an exclusively Chinese cohort with a receiver operating characteristic area under the curve of 0.976.14 Although of potential interest, this study was small, performed solely in a Chinese cohort, and did not include kidney disease control subjects. We aimed to assess whether miR-204 could discriminate IgAN from HS as well as disease controls in a Caucasian cohort, and, given the potential kidney origin of this miR, to evaluate its expression in kidney biopsy cores and its potential role as a diagnostic and/or prognostic biomarker in IgAN.
Instead of using urinary sediment, which is made up of cell debris,16, 17, 18, 19, 20 in this study, we investigated miR-204 expression in urinary exosomes. Exosomes are small vesicles derived from the endosome that afford miRs protection from degradation by RNAses and proteases.20 Urine exosome miR-204 levels were lower in IgAN and CKD urines than those of HS but not different from each other, suggesting that measurement of this miR in urinary exosomes may discriminate patients with kidney disease from HS but are not specific for IgAN. The magnitude of the difference of miR-204 expression between IgAN and HS in the current study was lower than in the Chinese study (2.5-fold vs. to 8.5-fold, respectively). Measurement of exosomal miRs rather than miRs extracted from sediment may account for some of this difference because excreted miR-204 may also be associated with cells/cell debris rather than exosomes. We cannot discount, however, that this difference is due to a difference in disease pathways operating in Caucasian and Chinese IgAN.23
On the basis of the comparative expression of urine exosomal miR-204 expression, we do not believe miR-204 has potential as a diagnostic biomarker of IgAN. However, because miR-204 is known to be enriched in the kidney and we also observed changes in urine excretion of miR-204 with kidney disease, we wanted to explore whether there was a direct relationship between intrarenal miR-204 and the pathophysiology of progressive kidney disease. In our original NGS study, miR-204 exhibited a 1.45-fold difference in expression between IgAN cases classified as IgANp and IgANnp, and as such fell below the arbitrary threshold of >1.5 difference in miR expression we used for selection, validation, and further analysis.13 Reanalysis of the NGS data showed that although the differences were relatively small, miR-204 expression was significantly lower in IgAN cases compared with TMN, and MN, and importantly, miR-204 levels were significantly different between IgANp and IgANnp. Validation of these findings by RT-qPCR in an independent set of cases confirmed these NGS observations and raised the possibility that miR-204 expression could function as a prognostic, rather than diagnostic, biomarker in IgAN. At present, the gold standard for predicting risk of progression in IgAN is the IIgANRPT, which uses baseline demographic and clinicopathological variables.3, 4, 5 It is accepted that this risk prediction tool is likely to evolve over time as new variables are added to refine prognostication. In our earlier study, we showed that addition of intrarenal miR-150 expression data to the IIgANRPT could potentially strengthen risk prediction.13 In this study, we have taken an additional step forward by showing, for the first time, that a novel biomarker, miR-204, can significantly improve the predictive power of the IIgANRPT, despite the limited number of samples analyzed in this pilot study.
In further support for a role of miR-204 in progression of kidney disease, Rudnicki et al. identified miR-204 as 1 of 7 miRs that inversely correlated with progression across several CKDs.24 In that study, 3 miR-204 target mRNAs were identified as being significantly reciprocally upregulated in the kidney—KRAS, PLD2, PTK2B, which are all associated with the GnRH signalling pathway.24
Although only exhibiting a trend a more detailed examination of kidney tissue using RNA obtained from laser capture microdissection of the cortex suggested that miR-204 is predominantly expressed in the tubulointerstitial compartment rather than in glomeruli. We also observed a reduction in the tubulointerstial:glomerular expression of miR-204 in IgAN patients who subsequently went on to develop progressive kidney disease, indicating that miR-204 is specifically downregulated in the tubulointerstitium in high-risk patients, and this likely accounts for the reduction of this miR in the urine of patients with kidney disease. Consistent with these observations Li et al. reported that cytokine-induced inflammation in proximal tubular epithelial cells (HK-2) resulted in reduced miR-204 expression, whereas overexpression of miR-204 was able to reduce IL-6–induced inflammation.25 Furthermore, the IL-6 receptor is a direct target of miR-204, and therefore reduced expression of miR-204 would be expected to enhance inflammatory responses in the tubulointerstitium by increasing cellular sensitivity to IL-6 through increased expression of its cognate receptor. miR-204 has also been shown to prevent epithelial-mesenchymal transition by targeting the transcription factor SP1 as part of the TGF-β signaling pathway.26 Release of this inhibition as levels of miR-204 fall in the tubulointerstitium would be expected to promote fibrosis. Interstitial fibrosis and tubular atrophy due to chronic allograft nephropathy has also been associated with downregulation of miR-204.27
Cumulative evidence supports an inherently protective role for miR-204 in the tubulointerstitium of the kidney. Indeed, overexpression of miR-204 in a mouse model of ischemia reperfusion injury markedly reduced the extent of inflammation and fibrosis.28 Although we have studied miR-204 as a novel biomarker of risk of progression in IgAN, data would suggest that miR-204 could also potentially be used as a novel treatment in inflammatory and fibrotic kidney diseases, including IgAN.
Little is known concerning the targets of miR-204 in the kidney, but a network analysis of potential miR-204 targets performed on data obtained from a murine study in corneal wound healing indicated that downregulation of miR-204 was associated with activation of MAPK, VEGF, Wnt, ErbB, PI3K-Akt, TGFβ, mTOR signaling, and focal adhesion pathways.29 Associated enriched gene ontology terms included effects on cell proliferation, cell migration, cell cycle, epithelial-mesenchymal transition, wounding healing, and actin cytoskeleton, terms that are equally relevant to the pathways involved in kidney disease progression.
In summary, we have shown that urinary exosome miR-204 expression is reduced in IgAN, but that this is not specific to IgAN and therefore urinary miR-204 is unlikely to prove useful as a diagnostic biomarker of IgAN. This fall in urinary miR-204 is likely due to reduced expression of miR-204 in the tubulointerstital compartment of the kidney, where in health it acts to protect the kidney from inflammation and scarring. Having shown in our pilot study that the addition of miR-204 significantly improves the prognostication power of the IIgANRPT, we believe our data justify a large-scale biomarker validation study to determine whether urine exosomal miR-204 can refine prognostic risk prediction in IgAN. This study will require urine samples at the time of kidney biopsy from approximately 700 patients with a minimum of 5 years of follow-up and sufficient “events” (50% decline in eGFR or ESKD) to reliably evaluate the value of adding a urine miRnomic signature to the current gold standard for prognostication in IgAN, the IIgANRPT. Outside of IgAN, it is of course possible that miR-204 may be incorporated in prognostic scores for other causes of kidney disease and in the future could be developed as a novel therapeutic for treating progressive kidney failure.
Disclosures
All the authors declared no competing interests
Acknowledgments
The authors thank the Mayer Family Foundation for supporting this work.
References
- 1.Trimarchi H., Barratt J., Monteiro R.C. IgA Nephropathy: “State of the Art.” A report from the 15th International Symposium on IgA Nephropathy celebrating the 50th anniversary of its first description. Kidney Int. 2019;95:750–756. doi: 10.1016/j.kint.2019.01.007. [DOI] [PubMed] [Google Scholar]
- 2.Floege J., Barbour S.J., Cattran D.C. Management and treatment of glomerular diseases (part 1): conclusions from a Kidney Disease: Improving Global Outcomes (KDIGO) Controversies Conference. Conference Participants. Kidney Int. 2019;95:268–280. doi: 10.1016/j.kint.2018.10.018. [DOI] [PubMed] [Google Scholar]
- 3.Barbour S.J., Coppo R., Zhang H. Evaluating a new international risk-prediction tool in IgA nephropathy. JAMA Intern Med. 2019;179:942–952. doi: 10.1001/jamainternmed.2019.0600. [DOI] [PMC free article] [PubMed] [Google Scholar]
- 4.Royston P., Altman D.G. External validation of a Cox prognostic model: principles and methods. BMC Med Res Methodol. 2013;13:33. doi: 10.1186/1471-2288-13-33. [DOI] [PMC free article] [PubMed] [Google Scholar]
- 5.Chambless L.E., Cummiskey C.P., Cui G. Several methods to assess improvement in risk prediction models: extension to survival analysis. Stat Med. 2011;30:22–38. doi: 10.1002/sim.4026. [DOI] [PubMed] [Google Scholar]
- 6.Bartel D.P. MicroRNAs: genomics, biogenesis, mechanism and function. Cell. 2004;116:281–297. doi: 10.1016/s0092-8674(04)00045-5. [DOI] [PubMed] [Google Scholar]
- 7.Jansson M.D., Lund A.H. MicroRNAs and cancer. Mol Oncol. 2012;6:590–610. doi: 10.1016/j.molonc.2012.09.006. [DOI] [PMC free article] [PubMed] [Google Scholar]
- 8.Vegter E.L., van der Meer, de Windt L.J. MicroRNAs in kidney physiology and disease. Eur J Heart Fail. 2016;18:457–468. doi: 10.1002/ejhf.495. [DOI] [PubMed] [Google Scholar]
- 9.Trionfini P., Benigni A., Remuzzi G. MicroRNAs in kidney physiology and disease. Nat Rev Nephrol. 2015;11:23–33. doi: 10.1038/nrneph.2014.202. [DOI] [PubMed] [Google Scholar]
- 10.Serino G., Sallustio F., Cox S.N. Abnormal miR-148b expression promotes aberrant glycosylation of IgA1 in IgA nephropathy. J Am Soc Nephrol. 2012;23:814–824. doi: 10.1681/ASN.2011060567. [DOI] [PMC free article] [PubMed] [Google Scholar]
- 11.Wang G., Kwan B.C., Lai F.M. Elevated levels of miR-146a and miR-155 in kidney biopsy and urine from patients with IgA nephropathy. Dis Markers. 2011;30:171–179. doi: 10.3233/DMA-2011-0766. [DOI] [PMC free article] [PubMed] [Google Scholar]
- 12.Qin W., Chung A.C., Huang X.R. TGFβ/Smad3 signalling promotes renal fibrosis by inhibiting miR-29. J Am Soc Nephrol. 2011;22:1462–1474. doi: 10.1681/ASN.2010121308. [DOI] [PMC free article] [PubMed] [Google Scholar]
- 13.Pawluczyk I.Z.A., Didangelos A., Barbour S.J. Differential expression of microRNAs in IgA nephropathy: miR-150-5p, a potential mediator and marker of disease progression. Kidney Int. 2021;99:1127–1139. doi: 10.1016/j.kint.2020.12.028. [DOI] [PubMed] [Google Scholar]
- 14.Szeto C-C Wang G., Ng J.K.-C. Urinary miRNA profile for the diagnosis of IgA nephropathy. BMC Nephrol. 2019;20:77. doi: 10.1186/s12882-019-1267-4. [DOI] [PMC free article] [PubMed] [Google Scholar]
- 15.Sun Y., Koo S., White N. Development of a micro-array to detect human and mouse microRNAs and characterisation of expression in human organs. Nucleic Acids Res. 2004;32:e188. doi: 10.1093/nar/gnh186. [DOI] [PMC free article] [PubMed] [Google Scholar]
- 16.Szeto C.C. Urine miRNA in nephrotic syndrome. Clin Chim Acta. 2014;436:308–313. doi: 10.1016/j.cca.2014.06.016. [DOI] [PubMed] [Google Scholar]
- 17.Chan R.E.W., Szeto C.C. Advances in the clinical laboratory assessment of urinary sediment. Clin Chim Acta. 2004;340:67–78. doi: 10.1016/j.cccn.2003.11.006. [DOI] [PubMed] [Google Scholar]
- 18.Wang G., Szeto C.C. Methods of microRNA quantification in urinary sediment. Methods Mol Biol. 2013;1024:211–220. doi: 10.1007/978-1-62703-453-1_17. [DOI] [PubMed] [Google Scholar]
- 19.Cheng L., Sun X., Scicluna B.J. Characterisation and deep sequencing analysis of exosomal and non-exosomal miRNA in human urine. Kidney Int. 2014;86:433–444. doi: 10.1038/ki.2013.502. [DOI] [PubMed] [Google Scholar]
- 20.Min Q., Chen X., Zou Y. Differential expression of urinary exosomal microRNAs in IgA nephropathy. J Clin Lab Anal. 2018;32:e22226. doi: 10.1002/jcla.22226. [DOI] [PMC free article] [PubMed] [Google Scholar]
- 21.Raposo G., Stoorvogel W. Extracellular vesicles: exosomes, microvesicles, and friends. J Cell Biol. 2013;200:373–383. doi: 10.1083/jcb.201211138. [DOI] [PMC free article] [PubMed] [Google Scholar]
- 22.Livak K.J., Schmittgen T.D. Analysis of relative gene expression data using real-time quantitative PCR and the 2(-Delta Delta C(T)) Method. Methods. 2001;25:402–408. doi: 10.1006/meth.2001.1262. [DOI] [PubMed] [Google Scholar]
- 23.Yeo S.C., Goh S.M., Barratt J. Is immunoglobulin A nephropathy different in different ethnic populations? Nephrology. 2019;24:885–895. doi: 10.1111/nep.13592. [DOI] [PubMed] [Google Scholar]
- 24.Rudnicki M., Perco P., D’haene B. Renal microRNA- and RNA-profiles in progressive chronic kidney disease. Eur J Clin Invest. 2016;46:213–226. doi: 10.1111/eci.12585. [DOI] [PubMed] [Google Scholar]
- 25.Li H., Wang J., Liu X. Micro-204-5p suppresses IL-6-mediated inflammatory response and chemokine generation in HK-2 renal tubular epithelial cells by targeting IL6R. Biochem Cell Biol. 2019;97:109–117. doi: 10.1139/bcb-2018-0141. [DOI] [PubMed] [Google Scholar]
- 26.Chen S., Wu P., Sun L. miR-204 regulates epithelial mesenchymal transition by targeting SP1 in the tubular epithelial cells after acute injury induced by ischemia-reperfusion. Oncol Rep. 2017;37:1148–1158. doi: 10.3892/or.2016.5294. [DOI] [PubMed] [Google Scholar]
- 27.Soltaninejad E., Nickham M.H., Nafar M. Altered expression of microRNAs following chronic allograft dysfunction with interstitial fibrosis and tubular atrophy. Iran J Allergy Asthma Immunol. 2015;14:615–623. [PubMed] [Google Scholar]
- 28.Zhu Y., Yin X., Li J. Overexpression of microRNA-204-5p alleviates renal ischemia-reperfusion injury in mice through blockage of Fas/FasL pathway. Exp Cell Res. 2019;381:208–214. doi: 10.1016/j.yexcr.2019.04.023. [DOI] [PubMed] [Google Scholar]
- 29.An J., Chen X., Chen W. MicroRNA expression profile and role of miR-204 in corneal wound healing. Invest Ophthalmol Vis Sci. 2015;56:3673–3683. doi: 10.1167/iovs.15-16467. [DOI] [PubMed] [Google Scholar]