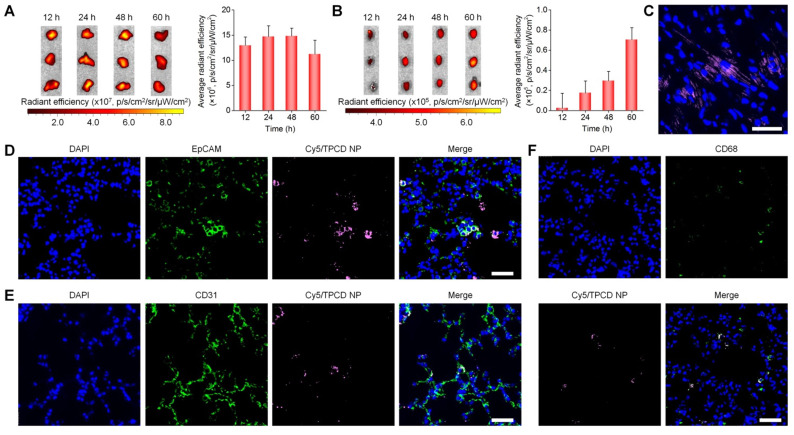
Figure 3.
Distribution of TPCD NP in the lungs and hearts after inhalation in mice. (A-B) Ex vivo fluorescent images (left) and quantitative analysis (right) of mouse lungs (A) and hearts (B) at various time points after inhalation of Cy7.5/TPCD NP. (C) A typical fluorescence image shows the distribution of Cy5/TPCD NP in a cryosection of the heart at 60 h after inhalation. (D-F) Immunofluorescence analysis of co-localization of Cy5/TPCD NP with EpCAM+ lung epithelial cells (D), CD31+ lung endothelial cells (E), and CD68+ macrophages (F) in lung sections. Scale bars: 40 μm. Data in (A-B) are mean ± SD (n = 3).

