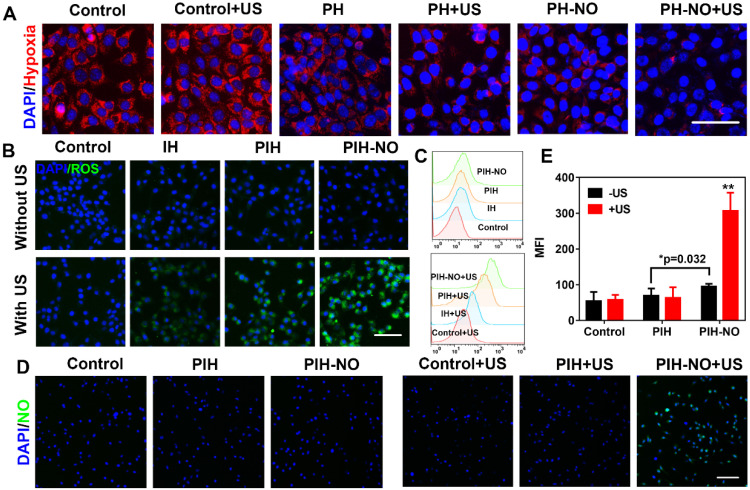
Figure 4.
Intracellular ROS and NO generation. (A) Representative fluorescence images of hypoxia (red) in 4T1 tumor cells after different treatments. (B) ROS generation (DCFH-DA, green) and (C) Flow cytometry quantitative analysis of ROS generation in treated groups with or without US. The scale bar is 100 μm. (D) Representative fluorescence images and (E) semiquantitative analysis of NO release stained with DAF-FM (green) in 4T1 tumor cells after various treatments. The scale bar is 200 μm. *p <0.05 (PIH-NO without US vs. PIH without US), **p <0.01 (PIH-NO with US vs. other treatments). Data are expressed as means ± SD (n = 3).

