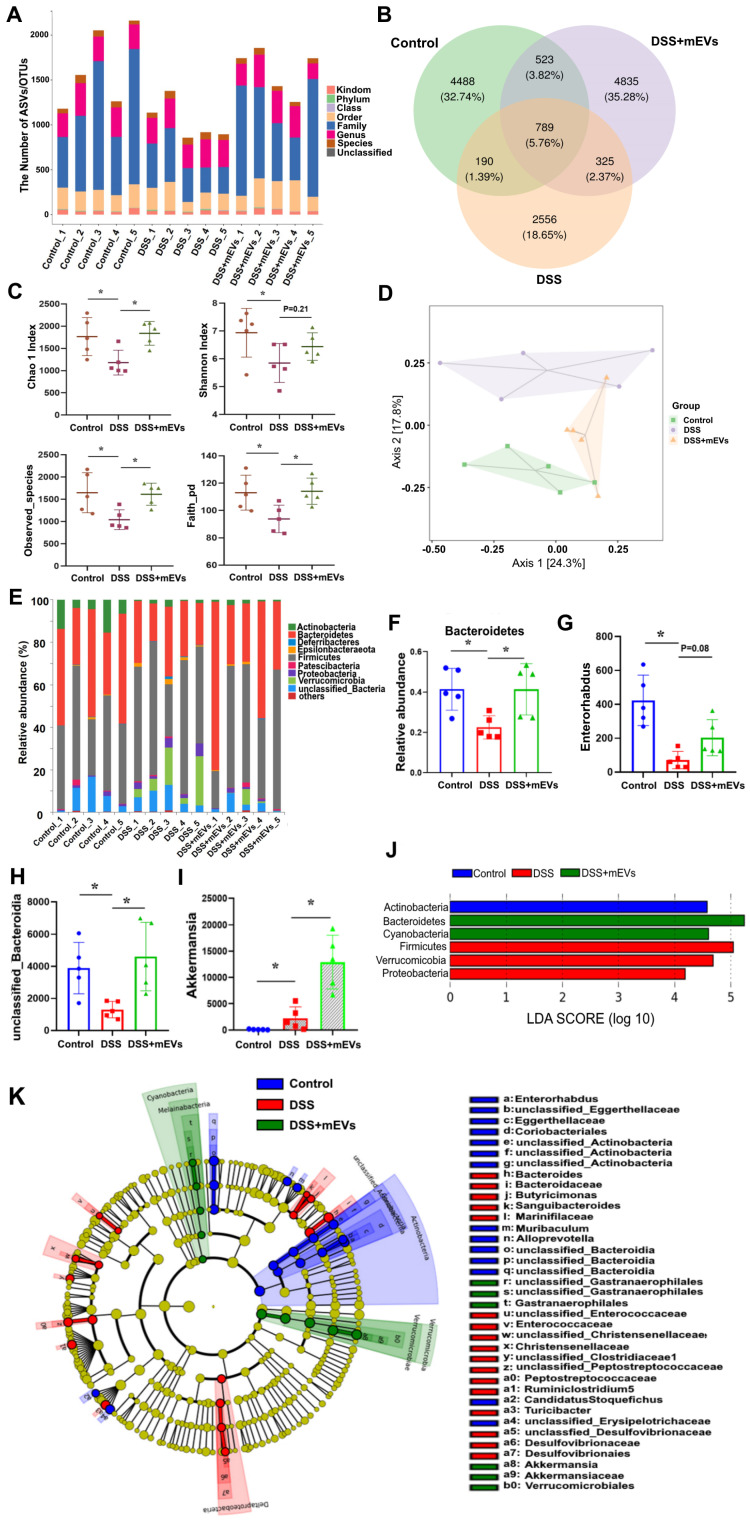
Figure 7.
mEVs reshape the gut microbiota composition in DSS-induced UC mice. Mouse feces were collected two days prior to euthanasia. Mice were treated according to the schedule illustrated in Figure 3A. Bacterial DNA from feces was analyzed using 16S rRNA gene sequencing (n = 5). (A) Results of the taxonomic annotation. (B) Venn diagram of ASV/OTU in the feces. The numbers of ASVs/OTUs were evaluated by 16S rRNA gene V4-V5 pyrosequencing reads. ASVs, Amplicon Sequence Variants; OTUs, Operational Taxonomic Units. (C) Alpha diversity indexes calculated with QIIME2 according to ASV/OTU numbers of each group. *p < 0.05. (D) β-diversity evaluated using the weighted UniFrac-based PCoA. (E) Bar graphs showing the relative abundance of different bacteria at the phylum level. (F) Relative abundances of Bacteroidetes at the phylum level. *p < 0.05. (G-I) Changes of the OUTs of Enterorhabdus, unclassified_Bacteroidia, and Akkermansia at the genus level. *p < 0.05. (J) Linear discriminant analysis (LDA) effect size (LEfSe) method was used to investigate bacterial community at the phylum level. LDA score higher than 3 indicates a higher relative abundance in the corresponding group than that in other groups. (K) Cladogram based on LEfSe analysis showing community composition of the gut microbiota in mice.

