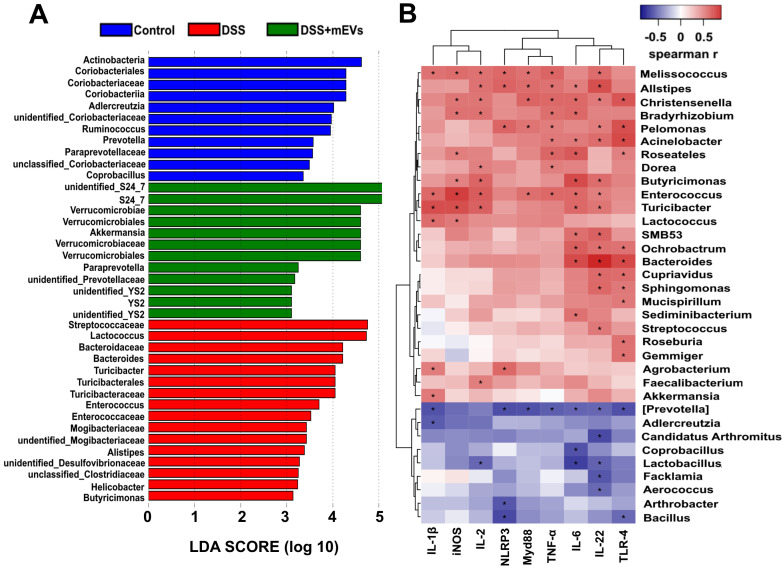
Figure 8.
Correlation analysis between the gut microbiota and intestinal immune inflammatory factors. (A) Differentially enriched gut microbiota in each group of mice at the genus level by linear discriminant analysis (LDA). LDA score higher than 3 indicates a higher relative abundance in the corresponding group than that in other groups. (B) Correlation matrix showing the strength of correlation between the gut microbiota (at the genus level) and the concentrations of immune inflammatory factors in the colon. Values in cells are Spearman correlation coefficient. Statistical significance was determined for all pairwise comparisons using Spearman's method. p < 0.05. Spearman r values range from -0.5 (blue) to 0.5 (red).

