

Abstract
Objectives. The aims were to compare the performance of cardiovascular risk calculators, Framingham Risk Score (FRS) and QRISK2, in RA and matched non-RA patients and to evaluate whether their performance could be enhanced by the addition of CRP.
Methods. We conducted a retrospective analysis, using a clinical practice data set linked to Hospital Episode Statistics (HES) data from the UK. Patients presenting with at least one RA diagnosis code and no prior cardiovascular events were matched to non-RA patients using disease risk scores. The overall performance of the FRS and QRISK2 was compared between cohorts, and assessed with and without CRP in the RA cohort using C-Index, Akaike Information Criterion (AIC) and the net reclassification index (NRI).
Results. Four thousand seven hundred and eighty RA patients met the inclusion criteria and were followed for a mean of 3.8 years. The C-Index for the FRS in the non-RA and RA cohort was 0.783 and 0.754 (P < 0.001) and that of the QRISK2 was 0.770 and 0.744 (P < 0.001), respectively. Log[CRP] was positively associated with cardiovascular events, but improvements in the FRS and QRISK2 C-Indices as a result of inclusion of CRP were small, from 0.764 to 0.767 (P = 0.026) for FRS and from 0.764 to 0.765 (P = 0.250) for QRISK2. The NRI was 3.2% (95% CI: −2.8, 5.7%) for FRS and −2.0% (95% CI: −5.8, 4.5%) for QRISK2.
Conclusion. The C-Index for the FRS and QRISK2 was significantly better in the non-RA compared with RA patients. The addition of CRP in both equations was not associated with a significant improvement in reclassification based on NRI.
Keywords: rheumatoid arthritis, cardiovascular, C-reactive protein, risk algorithm, net reclassification index, retrospective, Cox, survival
Rheumatology key messages
The Framingham Risk Scores discrimination in the RA population is lower than in the general population.
The inclusion of CRP does not seem to improve reclassification of cardiovascular risk in RA patients.
Introduction
Patients with RA compared with the general population have an increased risk of mortality [1–3]. There is evidence to suggest that this mortality gap is increasing, although recent studies indicate a decreasing trend in cardiovascular (CV) fatality in RA patients [2, 4]. The main cause of increased mortality in RA patients is CV-related events [5, 6]. Several epidemiological studies have shown that the relative risk of acute myocardial infarction in RA patients ranges from 1.5 to 2.0, and for stroke it is 1.4 to 2.7 fold higher [7–10].
The pathophysiological mechanism underlying the increased CV risk in RA patients is not fully understood. RA patients have chronic high-grade inflammation, which is an important contributor towards the development of premature atherosclerosis and CV events [11, 12]. It is unclear whether the markers of inflammation, such as CRP and ESR, and other markers, such as RF and RA disease activity, are more strongly associated with CV events in RA and thus could weaken the association of the traditional CV risk factors to CV events. In addition, there is evidence to suggest that traditional CV risk factors and markers of RA severity both contribute to predicting CV events in RA patients [2, 13, 14].
One consensus recommendation for the management of RA recommends the evaluation for CV risk at baseline using traditional CV risk algorithms, such as Framingham Risk Scores (FRS), which is based on the Framingham Heart Study, or the SCORE algorithm, which is based on the WHO MONICA Study [15]. Given that these algorithms were not developed in the RA-specific population, the recommendation suggest adjusting the risk to account for the increased CV risk in RA patients [15]. Recent studies reporting RA-specific CV risk calculators have had mixed success in developing an improved CV risk calculator in RA patients [14, 16].
The primary objective of this analysis was to evaluate and compare the performances of CV risk algorithms in RA vs matched non-RA patients. The secondary objective was to evaluate the association of CRP with CV events in RA patients and explore whether the performance of the CV risk algorithms could be enhanced by the addition of CRP, as was the case in the Reynolds Risk Score [17].
Methods
Study design and database
This was a retrospective cohort analysis, based on electronic medical records from the Clinical Practice Research Datalink (CPRD). The CPRD is jointly funded by the National Health Service (NHS), National Institute for Health Research and the Medicines and Healthcare products Regulatory Agency. It currently comprises ∼5 million active patients with long-term follow-up information. To obtain a complete picture of CV events, the CPRD data were linked to the Health Episode Statistics (HES) data from April 1997 onwards, which contain details of all admissions and outpatient appointments in NHS hospitals.
Study population
The study included all adult RA patients (age ⩾18 years) with records of sufficient quality, identified through the acceptable patient flag. The RA population was defined as all patients presenting at least one RA diagnosis read code after 01/01/1988 (index code), with no RA or juvenile RA codes before the index code. Read codes are standard medical diagnosis codes used in the UK general practice system. The index date was defined as the date of first RA-related clinical or referral record. Patients were required to have at least 12 months of data reported before the index date.
RA patients were matched 1:4 to non-RA patients based on their year of entry into the CPRD database using a disease risk score for RA, CV risk category (National Cholesterol Education Program classification) and CV treatment status. The disease risk score was based on a logistic regression model evaluating the probability of having RA and included gender, smoking, obesity, psoriasis, Charlson Co-Morbidity Index and family history of RA as covariates [18]. RA patients were categorized into CV risk categories of low, medium or high at index date based on the number of risk factors, explained further in the next subsection, on exposure and outcomes definitions. CV risk categorization and treatment status of CV risk for all non-RA patients were calculated for each 6-month window. Non-RA patients were selected as potential matches within each CV risk category and treatment status that was closest to the case’s index date. Potential matches were also required to have entered the CPRD database during the same year as the case and to have at least one health-care encounter within 2 months of the case’s index date. From the pool of potential matches, each RA patient was matched to a non-RA patient, with replacement based on the disease risk score and using the nearest neighbour match method [18]. An index date was assigned to the non-RA patient based on the closest observation date to the RA patient’s index date, and the match was confirmed based on the recalculated non-RA patient’s CV risk category at the assigned index date. The process was repeated to match a maximum of four controls to each case. Standardized differences were used to compare the measured baseline characteristics between the RA and the non-RA populations. A standardized difference of <0.1 was considered indicative of a good balance [19].
The CPRD has been granted Multiple Research Ethics Committee approval (05/MRE04/87) to undertake purely observational studies, with external data linkages including HES and Office of National Statistics mortality data. The work of CPRD is also covered by National Information Governance Board - Ethics and Confidentiality Committee approval ECC 5-05 (a) 2012. This study was approved by the Independent Scientific Advisory Committee for Medicines and Healthcare products Regulatory Agency database research under protocol no. 12_079Ra.
Exposure and outcomes definitions
Medical diagnoses and events were identified through read codes, whereas medical product codes were used for treatments. Lists of codes were constructed to define baseline covariates, CV risks and CV events. In order to create the code list for each condition, published lists of codes were used and supplemented by additional searches of the medical and product browser. Group 1 or 2 read codes were used for RA diagnosis as defined in a previous published study using CPRD data [20]. The compiled list was then screened by an analyst in order to exclude all non-relevant codes, and a second screening was then conducted by a clinician. For the HES analysis, ICD 10 codes were used to record medical diagnoses and events. Based on the Framingham Heart Study definition, the CV event list was a composite of myocardial infarction, stroke, heart failure, aortic aneurysm, transient ischaemic attack, unstable angina or intermittent claudication. The QRISK2 definition of CV events included myocardial infarction, coronary heart disease (CHD), stroke and transient ischaemic attack [21]. Laboratory values were identified and calculated at index date, considering the most recent value within 2 years of the date of interest. CRP values were also obtained from the laboratory tests data. The presence of hypertension at the index date was based on a record of a diagnosis of hypertension via read code or a diastolic blood pressure of >90 mmHg or systolic blood pressure of >140 mmHg or both within the 2 years prior to the index date. Dyslipidaemia at the index date was based on a diagnosis or treatment for dyslipidaemia or high-density lipoprotein cholesterol <1.03 mmol/l or low-density lipoprotein cholesterol >4.14 mmol/l or total cholesterol (TC) >5.17 mmol/l or triglyceride >2.26 mmol/l. Atrial fibrillation, family history of CHD and renal disease were evaluated at the index date based on a record of corresponding diagnosis codes within 2 years of the index date. Obesity was identified by a record of a read code or a BMI >30 kg/m2 occurring within 2 years of the index date. The covariates for the QRISK2 model were age, sex, smoking status (yes/no), treated hypertension (yes/no, hypertension with prescribed treatment), obesity (yes/no, instead of BMI), diabetes (yes/no), atrial fibrillation (yes/no), family history of CHD (yes/no), RA (yes/no) and renal disease (yes/no). RA was not included as covariate because of complete separation of populations in the RA and non-RA populations, respectively. In addition, the Townsend deprivation score and ethnicity were not included in the analysis because of their unavailability in our data set.
Treatment status was defined as a bivariate variable for patients who received therapy to treat diabetes, hypertension or dyslipidaemia within 2 years of the index date. The CV risk categories, used for the matching only, were based on National Cholesterol Education Program definitions and were composed of the four categories of low, medium, high and very high risk by summing the following risk factors: dyslipidaemia (low-density lipoprotein cholesterol ⩾4.14 mmol/l or high-density lipoprotein cholesterol ⩽1.03 mmol/l), hypertension, age (>45 years for males and >55 years for females) and current smoker [22]. If patients had none of the risk factors they were considered low risk, one risk factor was medium risk and more than one risk factor was high risk. Patients with diabetes, heart disease, a history of cardiovascular event or procedure were considered in the very high risk class.
Statistical analysis
Descriptive statistics were used to summarize the demographic characteristics of the RA and non-RA cohorts. The differences in CV risk factors in the two cohorts were tested using χ2 tests. The associations between CRP, lipids and CV events were evaluated by plotting Kaplan–Meier survival curves (time to CV event) by baseline CRP tertiles and TC categories based on UKtreatment guidelines (low: <5.172 mmol/l; medium: 5.172–6.180 mmol/l; high: ⩾6.180 mmol/l [22]) and using log rank tests. Negative binomial models were used to evaluate the risk of CV events (based on the FRS definition) by CRP and TC categories.
The 10-year FRS and QRISK2 are Cox proportional hazard models, which include the traditional CV risk factors. They were compared for discriminatory ability and model fit in the RA and non-RA cohorts. The proportional hazard assumption was evaluated for each covariate in univariate models by testing the interaction between the covariate and time in its logarithm transformation: . If the estimate was significantly different from 0 (P < 0.05) then the covariate was considered to violate the proportional hazard assumption. Model discriminatory properties were evaluated using the area under the receiver operating characteristic curve measured by Harrell’s C-Index, and the model fit was evaluated using the Akaike Information Criterion (AIC). The 95% CIs for the C-Index and the difference in the C-Index were calculated using 1000 bootstrap samples. Harrell’s C-Index is a measure that assesses the ability of a model to distinguish subjects who will develop events from those who will not and can be interpreted as the conditional probability that, for any pair of event and non-event patients, the predicted risk of an event is higher for the patient with an event [23]. The net reclassification index (NRI) was used to evaluate the reclassification ability of the addition of the logarithm of CRP concentration (log[CRP]) to the base FRS and QRISK2 prediction model. The NRI is a measure of the added predicted value of a new marker (CRP). In the context of survival data, it is calculated using a prospective approach, summarizing the upward and downward reclassifications, in terms of predicted risk categories, of the original model compared with the new model with the added covariate [24]. In the RA cohort, the base FRS and QRISK2 models were extended to include the baseline log[CRP] in addition to the traditional CV predictors. The C-Index and AIC were used to evaluate the performance of the FRS with and without CRP in RA patients.
Results
From 1997 to 2010, 12 747 primary prevention RA and 44 452 non-RA patients met the inclusion criteria. On average (s.d.) at baseline, RA patients were 58.5 (14.8) years old, with a follow-up of 6.0 (4.5) years (76 003 patient-years) and had CRP of 23.5 (33.5) mg/l. Females represented 71% of the population; 38% were hypertensive and 24% dyslipidaemic (Table 1). The median reported time between CRP record and the index date was 49 days (interquartile range: 14–137). Non-RA patients had similar characteristics at baseline, with the exception of mean CRP and ESR values, which were 2.5 and 1.8 times lower, respectively. The incidence of CV events based on FRS definition of CV events was 4.29/100 patient-years (95% CI: 4.15, 4.44) in RA patients and 3.11/100 patient-years (95% CI: 3.04, 3.17) in non-RA patients. Using the QRISK2 CV definition, the incidence of CV events was 1.78/100 patient-years (95% CI: 1.69, 1.88) in RA patients and 1.38/100 patient-years (95% CI: 1.33, 1.42) in non-RA patients. Within the RA and non-RA cohorts, based on a Kaplan–Meier analysis, the probability of a CV event at 5 years was 8.97 and 6.97%, respectively (log-rank P < 0.001; Fig. 1).
Table 1.
Baseline characteristics of RA and non-RA primary prevention patients
| RA patients | Non-RA patients | |||
|---|---|---|---|---|
| Characteristics | N | N | ||
| Number of patient-years, sum, years | 12 747 | 76 003 | 44 452 | 260 206 |
| Duration of follow-up, mean (s.d.), years | 12 747 | 6.0 (4.5) | 44 452 | 5.9 (4.5) |
| Age at index date, mean (s.d.), years | 12 747 | 58.5 (14.8) | 44 452 | 58.3 (15.4) |
| Charlson Co-morbidity Index, mean (s.d.) | 12 747 | 1.3 (0.9) | 44 452 | 0.3 (0.8) |
| Total cholesterol, mean (s.d.), mmol/l | 3874 | 5.3 (1.2) | 12 801 | 5.4 (1.2) |
| HDL cholesterol, mean (s.d.), mmol/l | 2774 | 1.4 (0.4) | 9459 | 1.4 (0.5) |
| Diastolic blood pressure, mean (s.d.), mmHg | 9042 | 79.5 (9.9) | 30 300 | 79.8 (11.1) |
| Systolic blood pressure, mean (s.d.), mmHg | 9042 | 136 (19.1) | 30 300 | 136 (19.4) |
| CRP, mean (s.d.), mg/l | 4780 | 23.4 (33.5) | 2816 | 9.9 (24) |
| ESR, mean (s.d.), mm/h | 6377 | 30.9 (24.7) | 5477 | 16 (16) |
| HbA1c, mean (s.d.), % | 681 | 7.1 (1.6) | 2554 | 7.2 (1.6) |
| Females, n (%) | 12 747 | 9046 (71) | 44 452 | 30 422 (68.4) |
| Obesity, n (%) | 12 747 | 1423 (11.2) | 44 452 | 4761 (10.7) |
| Dyslipidaemia, n (%) | 12 747 | 3094 (24.3) | 44 452 | 10 883 (24.5) |
| Diabetes, n (%) | 12 747 | 780 (6.1) | 44 452 | 3114 (7.0) |
| Hypertension, n (%) | 12 747 | 4870 (38.2) | 44 452 | 16 198 (36.4) |
| Current smoker, n (%) | 12 747 | 3551 (27.9) | 44 452 | 12 322 (27.7) |
| Atrial fibrillation, n (%) | 12 747 | 127 (1.0) | 44 452 | 343 (0.8) |
| Family history of CHD, n (%) | 12 747 | 372 (2.9) | 44 452 | 1396 (3.1) |
| Renal disease, n (%) | 12 747 | 152 (1.2) | 44 452 | 530 (1.2) |
| CV risk category, n (%)a | 12 747 | 44 452 | ||
| Low risk | 2721 (21.3) | 10 283 (23.1) | ||
| Medium risk | 4342 (34.1) | 14 073 (31.7) | ||
| High risk | 4410 (34.6) | 15 093 (34.0) | ||
| Very high risk | 1274 (10.0) | 5003 (11.3) | ||
National Cholesterol Education Program definition. CHD: coronary heart disease; CV: cardiovascular; HbA1c: glycosylated haemoglobin; HDL: high-density lipoprotein.
Fig. 1.

Time to CV event in RA and non-RA patients
CV: cardiovascular.
CRP and TC were categorized into three levels (low, medium and high). The threshold values for CRP levels (corresponding to tertiles) were CRP ⩽6, 6 < CRP ⩽20 and CRP >20 mg/l, and the values for TC were based on treatment guidelines defined in the statistical analysis subsection of the Methods. Based on the Kaplan–Meier analysis, probabilities of a CV event at 5 years based on FRS definition in patients with low, medium and high CRP levels were 6.57, 7.20 and 12.20%, respectively (log-rank P < 0.001; Fig. 2). The respective probabilities by TC levels were 9.97, 9.62 and 12.68% (log-rank P = 0.366; Fig. 2). Within each TC category, the risk of a CV event increased with the CRP level (P = 0.011; Fig. 3).
Fig. 2.

Time to CV event by baseline TC and CRP levels in RA patients
CV: cardiovascular; TC: total cholesterol.
Fig. 3.
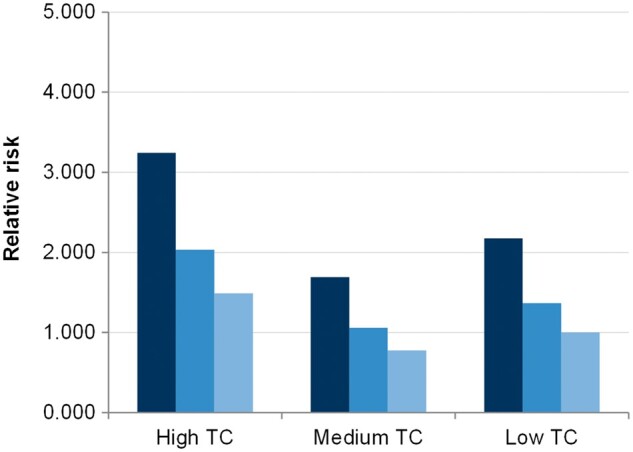
Relative Risk of CV event in RA patients
CV: cardiovascular; TC: total cholesterol.
The analysis of univariate models indicated no significant interaction between time in its logarithmic transformation and the covariates of the FRS and QRISK2 Cox models, so the proportional hazard assumption was deemed acceptable. The multivariate Cox analyses with the FRS and QRISK2 risk factors showed that all the traditional CV risk factors were significantly associated with CV events except for dyslipidaemia, in both the RA and the non-RA cohorts for the FRS based model. For the QRISK2-based analysis, in addition to dyslipidaemia, obesity, atrial fibrillation and renal disease were not significant in RA (Table 2). Based on the hazard ratios (HRs), all risk factors had a similar magnitude of effect in the RA vs non-RA cohort. The C-Index for the FRS in the non-RA vs RA cohort was 0.783 and 0.754 (P < 0.001) and that of the QRISK2 was 0.744 and 0.770 (P < 0.001), respectively (Table 2). The observed and predicted event rates at 3 years were plotted for both RA and non-RA patients based on the predictions from both the FRS and QRISK2 models. Overall, similar patterns were observed between FRS and QRISK2 in RA and non-RA cohorts (plots as supplementary material, available at Rheumatology Online).
Table 2.
Model results for any cardiovascular event in RA and non-RA patients
| FRS model | QRISK2 | |||||||
|---|---|---|---|---|---|---|---|---|
| Covariates | RA patients (n = 12 747) | Non-RA patients (n = 44 452) | RA patients (n = 12 747) | Non-RA patients (n = 44 452) | ||||
| HR (95% CI) | P-value | HR (95% CI) | P-value | HR (95% CI) | P-value | HR (95% CI) | P-value | |
| Age | 1.07 (1.07, 1.08) | <0.001 | 1.08 (1.07, 1.08) | <0.001 | 1.06 (1.06, 1.07) | <0.001 | 1.07 (1.07, 1.08) | <0.001 |
| Gender (ref. = male) | 0.67 (0.60, 0.75) | <0.001 | 0.63 (0.59, 0.68) | <0.001 | 0.71 (0.62, 0.82) | <0.001 | 0.65 (0.6, 0.71) | <0.001 |
| Hypertension (ref. = no) | 1.10 (0.98, 1.23) | 0.093 | 1.05 (0.97, 1.13) | 0.204 | 1.15 (0.99, 1.34) | 0.061 | 1.14 (1.03, 1.26) | 0.012 |
| Treatment for hypertension (ref. = no) | 1.44 (1.28, 1.62) | <0.001 | 1.56 (1.45, 1.69) | <0.001 | 1.48 (1.27, 1.73) | <0.001 | 1.33 (1.2, 1.47) | <0.001 |
| Current smoker (ref. = no) | 1.25 (1.09, 1.42) | 0.001 | 1.20 (1.10, 1.30) | <0.001 | 1.19 (0.99, 1.42) | 0.059 | 1.09 (0.97, 1.21) | 0.135 |
| Diabetes (ref. = no) | 1.66 (1.38, 2.00) | <0.001 | 1.59 (1.43, 1.76) | <0.001 | 1.53 (1.20, 1.96) | <0.001 | 1.43 (1.24, 1.64) | <0.001 |
| Dyslipidaemia (ref. = no) | 0.93 (0.81, 1.07) | 0.302 | 1.01 (0.93, 1.10) | 0.746 | 1.02 (0.85, 1.22) | 0.841 | 1.03 (0.92, 1.14) | 0.633 |
| Obesity (ref. = no) | 0.95 (0.75, 1.21) | 0.693 | 1.05 (0.91, 1.21) | 0.542 | ||||
| Atrial fibrillation (ref. = no) | 0.88 (0.53, 1.48) | 0.636 | 1.48 (1.11, 1.97) | 0.008 | ||||
| Family history of CHD (ref. = no) | 0.50 (0.25, 1.00) | 0.049 | 1.13 (0.84, 1.53) | 0.406 | ||||
| Renal disease (ref. = no) | 0.96 (0.45, 2.03) | 0.911 | 1.14 (0.79, 1.66) | 0.491 | ||||
| FRS model | QRISK2 | |||||||
|---|---|---|---|---|---|---|---|---|
| Covariates | RA patients (n = 12 747) | Non-RA patients (n = 44 452) | RA patients (n = 12 747) | Non-RA patients (n = 44 452) | ||||
| C-Index (95% CI) | 0.754 (0.733, 0.775) | 0.783 (0.770, 0.795) | 0.744 (0.714, 0.774) | 0.770 (0.753, 0.788) | ||||
| ΔC-Index (95% CI) | +0.029 (0.012, 0.042), P < 0.001 | +0.026 (0.008, 0.043), P < 0.001 | ||||||
Analysis was performed on all primary prevention RA and non-RA patients. CIs of the difference in C-Index were computed based on the percentiles obtained after using bootstrap sampling on 200 simulations. CHD: coronary heart disease; FRS: Framingham Risk Score; HR: hazard ratio; ref.: reference category.
The addition of log[CRP] was positively associated with CV events in the RA cohort for the FRS model (HR = 1.12; 95% CI: 1.03, 1.23) but not in the QRISK2 model (HR = 1.03; 95% CI: 0.91, 1.16; Table 3). The model discriminations due to the addition of log[CRP] were improved by very small amounts, with C-Index increments between the two models of 0.003 (P = 0.026) for the FRS model and 0.0005 (P = 0.250) for the QRISK2 (Table 3). Likewise, very small AIC differences were observed in the models with and without log[CRP] (4881 vs 4877 in the FRS and 2741 vs 2743 for QRISK2). The overall reclassification as a result of the addition of CRP was characterized by a non-significant NRI of 3.2% (95% CI: −2.8, 5.7%) in the FRS model and a negative improvement of −2.0% (95% CI: −5.8, 4.5%) in the QRISK2 model (Table 3).
Table 3.
Model results for any cardiovascular event in RA patients stratified by CRP
| FRS model | QRISK2 | |||||||
|---|---|---|---|---|---|---|---|---|
| Covariates | Without CRP | With CRP | Without CRP | With CRP | ||||
| HR (95% CI) | P-value | HR (95% CI) | P-value | HR (95% CI) | P-value | HR (95% CI) | P-value | |
| Age | 1.08 (1.06, 1.09) | <0.001 | 1.07 (1.06, 1.08) | <0.001 | 1.07 (1.05, 1.08) | <0.0001 | 1.07 (1.05, 1.08) | <0.0001 |
| Gender (ref. = male) | 0.68 (0.54, 0.84) | <0.001 | 0.70 (0.56, 0.88) | 0.002 | 0.73 (0.54, 0.99) | 0.042 | 0.74 (0.54, 1.00) | 0.049 |
| Hypertension (ref. = no) | 0.94 (0.74, 1.19) | 0.594 | 0.93 (0.73, 1.17) | 0.532 | 0.98 (0.71, 1.35) | 0.897 | 0.98 (0.71, 1.34) | 0.884 |
| Treatment for hypertension (ref. = no) | 1.60 (1.25, 2.05) | <0.001 | 1.59 (1.24, 2.03) | <0.001 | 1.83 (1.31, 2.55) | 0.000 | 1.82 (1.30, 2.55) | 0.000 |
| Current smoker (ref. = no) | 1.58 (1.26, 1.98) | <0.001 | 1.58 (1.26, 1.98) | <0.001 | 1.58 (1.16, 2.14) | 0.004 | 1.58 (1.16, 2.14) | 0.004 |
| Diabetes (ref. = no) | 1.61 (1.16, 2.25) | 0.005 | 1.60 (1.15, 2.22) | 0.006 | 1.65 (1.05, 2.6) | 0.031 | 1.65 (1.05, 2.6) | 0.031 |
| Dyslipidaemia (ref. = no) | 0.83 (0.64, 1.06) | 0.138 | 0.85 (0.66, 1.10) | 0.217 | 0.8 (0.57, 1.13) | 0.203 | 0.81 (0.57, 1.14) | 0.221 |
| Obesity (ref. = no) | 0.75 (0.46, 1.24) | 0.268 | 0.75 (0.46, 1.24) | 0.264 | ||||
| Atrial fibrillation (ref. = no) | 0.55 (0.14, 2.24) | 0.403 | 0.56 (0.14, 2.26) | 0.412 | ||||
| Family history of CHD (ref. = no) | 0.53 (0.17, 1.67) | 0.280 | 0.53 (0.17, 1.68) | 0.282 | ||||
| Renal disease (ref. = no) | 0.39 (0.10, 1.59) | 0.190 | 0.39 (0.10, 1.60) | 0.191 | ||||
| Log[CRP] | 1.12 (1.03, 1.23) | 0.012 | 1.03 (0.91, 1.16) | 0.626 | ||||
| FRS model | QRISK2 | |||||||
|---|---|---|---|---|---|---|---|---|
| Covariates | Without CRP | With CRP | Without CRP | With CRP | ||||
| AIC | 4881.1 | 4876.7 | 2740.8 | 2742.6 | ||||
| C-Index (95% CI) | 0.764 (0.720, 0.809) | 0.767 (0.723, 0.812) | 0.764 (0.699, 0.829) | 0.765 (0.700, 0.830) | ||||
| ΔC-Index (95% CI) | +0.003 (0.00017, 0.00827), P = 0.026 | +0.0005 (−0.00087, 0.00561), P = 0.250 | ||||||
| NRI (95% CI) | 3.2% (−2.8, 5.7%) | −2.0% (−5.8, 4.5%) | ||||||
Analysis on primary prevention RA patients with available value of CRP at baseline (n = 4780). CIs of the difference in C-Index and NRI were computed based on the percentiles obtained after using bootstrap sampling on 1000 simulations. AIC: Information Criterion; CHD: coronary heart disease; FRS: Framingham Risk Score; HR: hazard ratio; NRI: net reclassification index; ref.: reference category.
Discussion
Our study investigated the performance of the FRS and QRISK2 equations in RA and matched non-RA patients and assessed the additional value of including CRP, assessed at the index date, to the FRS and QRISK2 risk algorithm. This is the first UK study to compare the FRS and QRISK2 risk algorithm in RA and non-RA patients matched on the baseline CV risk factors.
Several studies have confirmed the higher CV risks in RA patients [7–10]. The CV incidence rates in the RA cohort observed in our analysis are comparable to a recent publication from the UK using The Health Improvement Network data set, a clinical practice data set similar to CPRD [25]. However, the observed event rates appear relatively high compared with other observational studies from The Netherlands and Sweden, highlighting difference in CV event rates in RA populations across countries [4].
There is evidence that the increased CV risk in RA patients might not be explained by traditional risk factors alone [26]. In addition, traditional risk calculators, such as FRS, underestimate the CV risk among RA patients, especially with high CV risk [27]. RA patients have chronic high-grade inflammation, but the only CV risk calculator that includes markers of inflammation is the Reynolds Risk Score, which was also developed in the general population [28]. Thus, the Reynolds Risk Score would be likely to underestimate the CV risk in RA patients [29, 30]. The QRISK2 score incorporates RA but it is not specific and there is evidence that it overestimates CV risk [31, 32].
We evaluated the performance of FRS and QRISK2 in RA patients and matched non-RA patients and tested whether the addition of CRP would improve the performance of these calculators in the RA cohort. We used the FRS risk algorithm, because EULAR guidelines in RA recommends using FRS for CV risk stratification of RA patients and it is also referenced in the UK clinical guidelines by the Joint British Recommendations on the Prevention of CHD [27, 33]. The QRISK2 has been recommended for CV risk estimation by the National Institute of Health and Care Excellence in the UK.
To compare the algorithms in the two cohorts, we controlled for traditional CV risk factors by matching RA to non-RA patients based on their CV risk profile. Overall, we found that the algorithms had a good discrimination in RA patients, although the C-Index was lower compared with the CV risk-matched non-RA cohort. Similar to our findings, other studies reported that the FRS algorithm underestimates the CV risk in established and early RA patients, especially in patients with high baseline deciles of predicted risks, but ours is the first study having a comparator group matched for baseline CV risks [29, 32]. Further examination of the Cox model indicated that almost all the traditional risk factors in FRS had a similar magnitude of effect in the RA and non-RA cohorts except smoking, hypertension and diabetes, whose HRs were ∼5% higher in the RA compared with the non-RA cohort. There is evidence to suggest that RA patients have a different CV risk factor profile compared with non-RA patients because they are more likely to be obese and more likely to be smokers and hypertensive [34]. There is emerging evidence to suggest that the immune dysregulation, chronic high-grade inflammation and metabolic disturbances found in RA patients could contribute to the increased CV events [26, 35–37]. We observed baseline CRP, but not TC, to be associated with a higher CV event risk in RA. This observation was found to hold even after controlling for all the traditional risk factors. We further evaluated the association between TC, CRP and CV events in RA patients and noticed that within each category of TC (low, medium and high), an increase in CRP levels increased CV events. Thus, we hypothesize that CRP could have a risk-modifying effect in RA patients. However, the inclusion of CRP as a risk factor in the FRS and QRISK2 did not improve the reclassification of CV risks; in fact, it worsened the reclassification in QRISK2. Thus, CRP itself might not explain the overall increased CV events observed in RA patients. These findings are consistent with those observed in two other analyses using a similar methodology and based on electronic medical record databases from the USA [38, 39]. Given the findings of our analysis, we think that studies focusing on developing and validating RA-specific risk CV algorithms are most appropriate [14, 32]. Some studies have reported success in developing and validating such algorithms; therefore, future research should focus on further testing of these RA-specific CV algorithms [14].
There were several limitations to our analysis. First, this was a retrospective analysis, implying some sources of bias attributable to confounding factors. However, this was partly accounted for by matching patients based on disease risk score for RA and CV risk profiles. The identification of RA patients was based on RA diagnosis records in groups 1 and 2 of Thomas et al. [20], and seronegative RF read codes were not included. However, the list of codes is associated with a sensitivity of 93% and a specificity of 49% and thus there could be some false-positive patients in our case cohort. As the findings from our study are similar to those of two other studies using similar methodology and based on US electronic medical records, we anticipate that false positives have minimal impact on the overall conclusion [38, 39]. In the non-RA cohort, neither lipids nor hypertension was predictive of future CVD events. This could be explained by the fact that the patient data for this analysis were from a general practice database and thus the patients were managed for their CV risk factors. Treatment for hypertension is on the causal pathway of risk factors for CVD and, in fact, we noticed that treatment for hypertension was a predictor. In our data set, there were a number of missing laboratory values for non-traditional CV risk factors and so categorical yes/no variables were used instead in both the FRS and QRISK2 models. For example, dyslipidaemia was based on a combination of laboratory value thresholds, treatment and diagnosis codes. However, as this would impact the two cohorts equally, we do not think this would impact the overall findings of our analysis. In addition, we were not able to include some of the QRISK2 covariates, such as ethnicity or the Townsend deprivation score, because of their unavailability. The imputation of missing values for CRP and continuous laboratory values in general could have been undertaken. For CRP, a variety of imputation approaches could have been used. Although this would have enabled us to retain the full sample size, imputation can introduce bias. For instance, the missing information might not be random; that is, CRP might be tested only when general practitioners suspect a high value. This means that the missing CRP values might be lower than the recorded ones. Given that data on UK postal codes was not available via CPRD, we used the approach as stated by the developers of QRISK2 [40]. As the average follow-up time was 6.0 and 3.8 years in the overall RA cohort and RA patients with CRP measures, respectively, we estimated 5- and 3-year CV risks in this analysis. Although we do agree that this apparent inconsistency could introduce confusion, the aim of the present paper was to estimate the incremental improvement in prediction with the addition of inflammatory measures and not the 10-year estimated risk of CVD. Furthermore, focusing on patients with CRP data available in the second analysis may have resulted in a selection bias. Our analysis of the non-traditional risk factor was limited to CRP because other factors, such as RA disease activity, were not available for analysis. Another limitation was the 49-day delay between the reported CRP value and the index date.
Despite limitations, the study was based on data with both a large sample size and a good follow-up period. Thus, the results are generalizable to the UK population and are representative of its clinical practice.
Conclusion
The FRS and QRISK2 have a good discrimination in the RA population, but it was significantly lower than the general population. Even though CRP is associated with an increased risk of CV events, the inclusion of CRP in the FRS equation and the QRISK2 model did not result in an improvement in reclassification of CV risk.
Supplementary Material
Acknowledgements
Bristol-Myers Squibb contracted MAPI for this study. Editorial assistance was provided by MAPI. K.P.L. is supported by the National Institute of Health K08 AR 060257. E.A. is an external PhD student at the Institute of Health Policy and Management and the Institute for Medical Technology Assessment of Erasmus University Rotterdam. The university is reimbursed for thesis supervision.
Funding: This study is supported by Bristol-Myers Squibb.
Disclosure statement: E.A. is a shareholder and employee of Bristol-Myers Squibb and an external PhD student at the Institute of Health Policy and Management and the Institute for Medical Technology Assessment of Erasmus University Rotterdam. F.B. is an employee of MAPI. D.H.S. is supported by research grants to Brigham and Women’s Hospital by Amgen, Lilly and Pfizer, serves in unpaid capacities on a Pfizer sponsored trial on an unrelated topic and receives royalties from UpToDate on unrelated topics. All other authors have declared no conflicts of interest.
Supplementary data
Supplementary data are available at Rheumatology Online.
References
- 1. Aviña-Zubieta JA, Choi HK, Sadatsafavi M et al. Risk of cardiovascular mortality in patients with rheumatoid arthritis: a meta-analysis of observational studies. Arthritis Rheum 2008;59:1690–7. [DOI] [PubMed] [Google Scholar]
- 2. Kaplan MJ. Cardiovascular complications of rheumatoid arthritis: assessment, prevention, and treatment. Rheum Dis Clin North Am 2010;36:405–26. [DOI] [PMC free article] [PubMed] [Google Scholar]
- 3. Meune C, Touze E, Trinquart L, Allanore Y. Trends in cardiovascular mortality in patients with rheumatoid arthritis over 50 years: a systematic review and meta-analysis of cohort studies. Rheumatology 2009;48:1309–13. [DOI] [PubMed] [Google Scholar]
- 4. Meek IL, Vonkeman HE, van de Laar MA. Cardiovascular case fatality in rheumatoid arthritis is decreasing; first prospective analysis of a current low disease activity rheumatoid arthritis cohort and review of the literature. BMC Musculoskelet Disord 2014;15:142. [DOI] [PMC free article] [PubMed] [Google Scholar]
- 5. Goodson N, Symmons D. Rheumatoid arthritis in women: still associated with an increased mortality. Ann Rheum Dis 2002;61:955–6. [DOI] [PMC free article] [PubMed] [Google Scholar]
- 6. Riise T, Jacobsen BK, Gran JT, Haga HJ, Arnesen E. Total mortality is increased in rheumatoid arthritis. A 17-year prospective study. Clin Rheumatol 2001;20:123–7. [DOI] [PubMed] [Google Scholar]
- 7. Meune C, Touzé E, Trinquart L, Allanore Y. High risk of clinical cardiovascular events in rheumatoid arthritis: levels of associations of myocardial infarction and stroke through a systematic review and meta-analysis. Arch Cardiovasc Dis 2010;103:253–61. [DOI] [PubMed] [Google Scholar]
- 8. Turesson C, Jarenros A, Jacobsson L. Increased incidence of cardiovascular disease in patients with rheumatoid arthritis: results from a community based study. Ann Rheum Dis 2004;63:952–5. [DOI] [PMC free article] [PubMed] [Google Scholar]
- 9. Solomon DH, Karlson EW, Rimm EB et al. Cardiovascular morbidity and mortality in women diagnosed with rheumatoid arthritis. Circulation 2003;107:1303–7. [DOI] [PubMed] [Google Scholar]
- 10. Solomon DH, Goodson NJ, Katz JN et al. Patterns of cardiovascular risk in rheumatoid arthritis. Ann Rheum Dis 2006;65:1608–12. [DOI] [PMC free article] [PubMed] [Google Scholar]
- 11. Sattar N, McCarey DW, Capell H, McInnes IB. Explaining how “high-grade” systemic inflammation accelerates vascular risk in rheumatoid arthritis. Circulation 2003;108:2957–63. [DOI] [PubMed] [Google Scholar]
- 12. de Groot L, Posthumus MD, Kallenberg CG, Bijl M. Risk factors and early detection of atherosclerosis in rheumatoid arthritis. Eur J Clin Invest 2010;40:835–42. [DOI] [PubMed] [Google Scholar]
- 13. Solomon DH, Kremer J, Curtis JR et al. Explaining the cardiovascular risk associated with rheumatoid arthritis: traditional risk factors versus markers of rheumatoid arthritis severity. Ann Rheum Dis 2010;69:1920–5. [DOI] [PMC free article] [PubMed] [Google Scholar]
- 14. Solomon DH, Greenberg J, Curtis JR et al. Derivation and internal validation of an expanded cardiovascular risk prediction score for rheumatoid arthritis (ERS-RA): A CORRONA registry study. Arthritis Rheumatol 2015;67:1995–2003. [DOI] [PubMed] [Google Scholar]
- 15. Gabay C, Buchs N, Dudler J et al. Cardiovascular risk management in patients with rheumatoid arthritis. Open Cardiovasc Med J 2015;18:127–33. [Google Scholar]
- 16. Arts EE, Popa CD, Den Broeder AA et al. Prediction of cardiovascular risk in rheumatoid arthritis: performance of original and adapted SCORE algorithms. Ann Rheum Dis 2016;75:674–80. [DOI] [PubMed] [Google Scholar]
- 17. Cook NR, Paynter NP, Eaton CB et al. Comparison of the Framingham and Reynolds Risk scores for global cardiovascular risk prediction in the multiethnic Women’s Health Initiative. Circulation 2012;125:1748–56, S1–11 [DOI] [PMC free article] [PubMed] [Google Scholar]
- 18. Ray WA, Stein CM, Daugherty JR et al. COX-2 selective non-steroidal anti-inflammatory drugs and risk of serious coronary heart disease. Lancet 2002;360:1071–3. [DOI] [PubMed] [Google Scholar]
- 19. Austin PC, Grootendorst P, Anderson GM. A comparison of the ability of different propensity score models to balance measured variables between treated and untreated subjects: a Monte Carlo study. Stat Med 2007; 26:734–53. [DOI] [PubMed] [Google Scholar]
- 20. Thomas SL, Edwards CJ, Smeeth L, Cooper C, Hall AJ. How accurate are diagnoses for rheumatoid arthritis and juvenile idiopathic arthritis in the general practice research database? Arthritis Rheum 2008;59:1314–21. [DOI] [PubMed] [Google Scholar]
- 21. Hippisley-Cox J, Coupland C, Vinogradova Y, Robson J, Brindle P. Performance of the QRISK cardiovascular risk prediction algorithm in an independent UK sample of patients from general practice: a validation study. Heart 2008;94:34–9. [DOI] [PubMed] [Google Scholar]
- 22. National Cholesterol Education Program (NCEP) Expert Panel on Detection, Evaluation, and Treatment of High Blood Cholesterol in Adults (Adult Treatment Panel III). Third Report of the National Cholesterol Education Program (NCEP) Expert Panel on Detection, Evaluation, and Treatment of High Blood Cholesterol in Adults (Adult Treatment Panel III) final report. Circulation 2002;106:3143–421. [PubMed] [Google Scholar]
- 23. Pencina MJ, D’Agostino RB. Overall C as a measure of discrimination in survival analysis: model specific population value and confidence interval estimation. Stat Med 2004;23:2109–23. [DOI] [PubMed] [Google Scholar]
- 24. Pencina MJ, D’Agostino RB Sr, D’Agostino RB Jr, Vasan RS. Evaluating the added predictive ability of a new marker: from area under the ROC curve to reclassification and beyond. Stat Med 2008;27:157–72, discussion 207–12. [DOI] [PubMed] [Google Scholar]
- 25. Ogdie A, Yu Y, Haynes K et al. Risk of major cardiovascular events in patients with psoriatic arthritis, psoriasis and rheumatoid arthritis: a population-based cohort study. Ann Rheum Dis 2015;74:326–32. [DOI] [PMC free article] [PubMed] [Google Scholar]
- 26. del Rincón ID, Williams K, Stern MP, Freeman GL, Escalante A. High incidence of cardiovascular events in a rheumatoid arthritis cohort not explained by traditional cardiac risk factors. Arthritis Rheum 2001;44:2737–45. [DOI] [PubMed] [Google Scholar]
- 27. Peters MJ, Symmons DP, McCarey D et al. EULAR evidence-based recommendations for cardiovascular risk management in patients with rheumatoid arthritis and other forms of inflammatory arthritis. Ann Rheum Dis 2010;69:325–31. [DOI] [PubMed] [Google Scholar]
- 28. Ridker PM, Buring JE, Rifai N, Cook NR. Development and validation of improved algorithms for the assessment of global cardiovascular risk in women: the Reynolds Risk Score. JAMA 2007;297:611–9. [DOI] [PubMed] [Google Scholar]
- 29. Crowson CS, Matteson EL, Roger VL, Therneau TM, Gabriel SE. Usefulness of risk scores to estimate the risk of cardiovascular disease in patients with rheumatoid arthritis. Am J Cardiol 2012;110:420–4. [DOI] [PMC free article] [PubMed] [Google Scholar]
- 30. Kawai VK, Chung CP, Solus JF et al. The ability of the 2013 American College of Cardiology/American Heart Association cardiovascular risk score to identify rheumatoid arthritis patients with high coronary artery calcification scores. Arthritis Rheumatol 2015;67:381–5. [DOI] [PMC free article] [PubMed] [Google Scholar]
- 31. Arts EE, Fransen J, den Broeder AA, Popa CD, van Riel PL. The effect of disease duration and disease activity on the risk of cardiovascular disease in rheumatoid arthritis patients. Ann Rheum Dis 2015;74:998–1003. [DOI] [PubMed] [Google Scholar]
- 32. Arts EE, Popa C, Den Broeder AA et al. Performance of four current risk algorithms in predicting cardiovascular events in patients with early rheumatoid arthritis. Ann Rheum Dis 2015;74:668–74. [DOI] [PubMed] [Google Scholar]
- 33. Jackson R. Guidelines on preventing cardiovascular disease in clinical practice. BMJ 2000;320:659–61. [DOI] [PMC free article] [PubMed] [Google Scholar]
- 34. Gabriel SE, Crowson CS. Risk factors for cardiovascular disease in rheumatoid arthritis. Curr Opin Rheumatol 2012;24:171–6. [DOI] [PubMed] [Google Scholar]
- 35. Solomon DH, Katz JN, Weiblatt ME. The increased risk of cardiovascular events in rheumatoid arthritis is most extreme in young adults. Arthritis Rheum 2005;52:S230. [Google Scholar]
- 36. Aubry MC, Maradit-Kremers H, Reinalda MS et al. Differences in atherosclerotic coronary heart disease between subjects with and without rheumatoid arthritis. J Rheumatol 2007;34:937–42. [PubMed] [Google Scholar]
- 37. Aviña-Zubieta JA, Abrahamowicz M, De Vera MA et al. Immediate and past cumulative effects of oral glucocorticoids on the risk of acute myocardial infarction in rheumatoid arthritis: a population-based study. Rheumatology 2013;52:68–75. [DOI] [PubMed] [Google Scholar]
- 38. An J, Alemao E, Cheetham T et al. The role of C-reactive protein or erythrocyte sedimentation rate in predicting cardiovascular outcomes in rheumatoid arthritis: analysis of data from US managed care organization. Ann Rheum Dis 2014;73 (Supp 2):605. [Google Scholar]
- 39. Rajagopalan V, Alemao E, Kawabata H, Solomon DH. Performance of the Framingham Cardiovascular risk prediction model with and without C-reactive protein or erythrocyte sedimentation rate in RA: analysis of US electronic medical records database. Ann Rheum Dis 2014;73 (Supp 2):615. [Google Scholar]
- 40.QRISK®2. http://www.qrisk.org/index.php.
Associated Data
This section collects any data citations, data availability statements, or supplementary materials included in this article.