Abstract
Purpose
To determine whether MRI volumetric and image texture analysis correlates with treatment-induced biologic changes in desmoid fibromatosis (DF) earlier than conventional response criteria.
Materials and Methods
This retrospective study included 27 patients with histologically proven extra-abdominal DF who were managed with active surveillance or systemic therapy (from 2004 to 2016). MRI volumetric and image texture parameters were derived from manual tumor segmentations, and tumor signal intensity was normalized to muscle. Results were compared with objective response rates based on Response Evaluation Criteria in Solid Tumors (RECIST) version 1.1, World Health Organization (WHO) lesion response, volumetrics, and MRI-modified Choi criteria. Correlation coefficients (r) between image texture features and maximum tumor diameters were obtained by using a meta-analysis approach.
Results
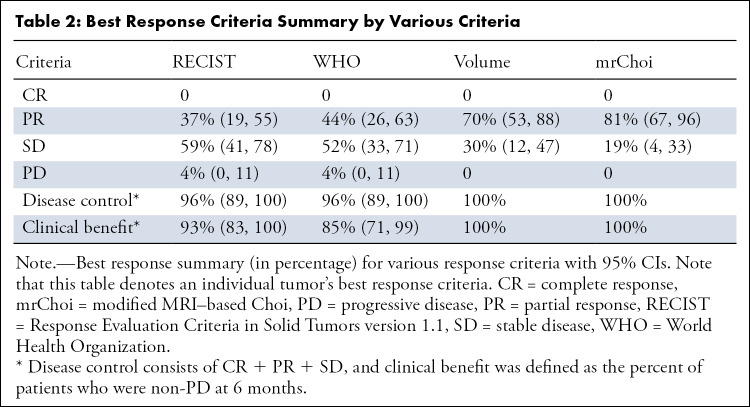
The 27 included patients (mean age, 39 years; 74% women) were followed for an average of 4 years, comprising 207 distinct time-point assessments. The mean baseline tumor maximum diameter was 7.9 cm (range, 3.4–15.2 cm). Partial response (PR) rates as best response were 37%, 44%, 70%, and 81% by RECIST, WHO, volumetrics, and MRI-modified Choi criteria, respectively. Among the 10 tumors showing RECIST PR, a preceding MRI-modified Choi PR was observed in 70% (seven of 10), on average 1.3 years earlier. Multiple image texture parameters showed associations with objective measurements of tumor diameter including mean tumor-to-muscle signal ratio (r = 0.51; P = .004), median tumor-to-muscle signal ratio (r = 0.52; P = .003), energy (r = 0.48; P < .001), run entropy (r = 0.32, P = .04), and gray-level nonuniformity (r = 0.54; P ≤ .001).
Conclusion
Volumetric signal and image texture assessment allows more comprehensive analysis of DF biologic change and may permit early prediction of DF behavior and therapeutic response.
Keywords: MR Imaging, Soft Tissues/Skin, Neoplasms-Primary
© RSNA, 2021
Keywords: MR Imaging, Soft Tissues/Skin, Neoplasms-Primary
Summary
Volumetric radiomics analysis of desmoid fibromatosis may allow early identification of treatment response and offers promising image markers of disease activity.
Key Points
■ Volumetric analysis of desmoid fibromatosis may allow approximately 1 year earlier identification of tumor response compared with Response Evaluation Criteria in Solid Tumors.
■ Decreased mean and median tumor-to-muscle signal ratio were assessed volumetrically and correlated with response (correlation coefficient, 0.51; P = .004 [mean] and 0.52; P = .003 [median]).
■ Radiomics of desmoid fibromatosis, particularly the features of energy (r = 0.48; P < .001), run entropy (r = 0.32; P = .04), and gray-level nonuniformity (r = 0.54; P < .001), emerged as potential imaging markers of treatment response.
Introduction
Desmoid fibromatosis (DF) is a locally aggressive, nonmetastasizing mesenchymal tumor with a variable course. Despite an inability to metastasize, DF has a pattern of infiltrative growth associated with substantial morbidity (1), with 2-year local recurrence rates following surgical resection ranging from 30% to 75%, depending on location (2). These observations have spurred interest in developing nonsurgical management that focuses on symptomatic improvement and disease control rather than surgical resection. While there are several active therapies, each has its own toxicities, and a strategy of active surveillance, predicated on serial imaging and clinical assessments, may be appropriate for some patients (3).
At MRI, DF is often characterized by heterogeneous T2 hyperintensity and enhancement admixed with bands of hypointensity. T2 hyperintensity and enhancement within the tumor putatively reflect areas of cellularity and proliferation, while hypointense nonenhancing tumor components reflect hypocellular collagenous regions (4,5). Increasing collagenization accompanies reduction in the tumor cellularity and suggests biologic quiescence, so that decreases in enhancement and T2 hyperintensity serve as imaging features of positive response to therapy.
While widely recognized, these inherent changes in the tumors are neglected in response criteria that only assess tumor size in one dimension, particularly Response Evaluation Criteria in Solid Tumors (RECIST) version 1.1 (6). Because biologic changes in the parenchyma are reflected in signal spatial heterogeneity and other features of image texture, we hypothesized that volumetric and image texture–based analysis (7) would allow a more comprehensive and accurate assessment of radiologic changes in tumor morphologic features and composition. Our objective was to determine whether DF volumetric segmentation and image texture analysis could allow early prediction of tumor response and disease control.
Materials and Methods
Study Design
Institutional review board approval was obtained for this Health Insurance Portability and Accountability Act–compliant study, and in accordance with the requirements of a retrospective review, informed consent was not required. All procedures performed in studies involving human participants were in accordance with the ethical standards of the institutional and/or national research committee and with the 1964 Helsinki Declaration and its later amendments or comparable ethical standards.
Musculoskeletal radiology reports from our institution over a period of 11.5 years (2004 to 2016) were screened for keywords including “desmoid” or “fibromatosis.” Inclusion criteria included adults older than 18 years of age at the time of baseline examination, histologically proven DF with at least one measurable lesion by RECIST 1.1 criteria, availability of baseline MRI examination before initiation of systemic therapy or period of observation, and availability of at least three MRI examinations for longitudinal assessment. Exclusion criteria were individuals younger than 18 years of age at the time of baseline MRI, fewer than three MRI examinations available for longitudinal analysis, intraperitoneal location of tumor, or lack of clinical documentation of treatment history. MRI examinations were only included during treatment intervals where systemic therapy was exclusively administered; MRI examinations performed after local treatment with surgery or minimally invasive ablative procedures were excluded. Only deep fibromatoses were included; superficial palmar and plantar fibromatoses were excluded. A total of 69 patients were eligible for inclusion.
A total of 42 patients were excluded for the following reasons: they did not have histologically proven extra-abdominal DF (often the diagnosis was superficial fibromatosis or cortical desmoid, n = 30), lacked baseline MRI or had fewer than three MRI examinations available for review (n = 9), or the patients had no measurable disease (n = 3). Both untreated and recurrent tumors were included, but image analysis was restricted to an interval free of local intervention (eg, surgery, radiation, or percutaneous ablation). This left 27 patients for inclusion. In patients with multiple tumors, only the largest was included for analysis and segmentation. All lesions were sporadic; no patient had documented familial adenomatous polyposis syndrome. Patient demographic data, as well as systemic agent treatment regimen, were recorded.
MRI Acquisition
In this retrospective study, MRI scanners ranged in strength from 1.5 to 3 T (Symphony, Magnetom Avanto, Magnetom Trio, and Magnetom Verio; Siemens). Protocols were tailored for DF anatomic location so that receiver coils and parameters such as field of view and section thickness were optimized for the body part being imaged. Section thickness ranged from 3 to 6 mm, and matrix size from 256 × 192 up to 384 × 192. Contrast-enhanced T1-weighted fat-suppressed sequences utilized a repetition time msec/echo time msec range of 500–600/10–12. When a contrast-enhanced sequence was unavailable, a fat-suppressed sequence was utilized with repetition time msec/echo time msec range of 2500–5000/40–55.
MRI Analysis
Tumor location was recorded and assessed in two categories: torso (including chest and abdominal wall) and extremity (upper and lower). Tissue compartment was assessed where tumor was centered at baseline and designated as fascial intermuscular, intramuscular, or fascial and intramuscular. A prior analysis of 13 of these patients using only two time points and simple single section regions of interest (but no volumetric segmentation) has been previously published (8). Two-dimensional measurements across the long and short axis of the tumors were recorded using Mint Lesion 3.4 (Mint Medical) to assess RECIST 1.1 and World Health Organization (WHO) lesion-level responses.
For the tumor segmentations, either fat-suppressed postcontrast T1-weighted or fat-suppressed proton-density or T2-weighted were used for each time point, with postcontrast sequences selected when available. The segmentations were carried out in consensus by a student (K.F.) and a fellowship-trained musculoskeletal radiologist (T.K.S.) with 7 years of clinical experience. Readers were not blinded to clinical treatment history. Segmentations were performed using 3D Slicer, a free and open-source software package for image analysis (available at https://www.slicer.org) (9). Manual contouring around the tumor boundaries, including use of manually refined volume interpolation, was performed section-by-section. We utilized a semiautomated morphologic contour interpolation algorithm in which an arbitrary number of manually constructed “seed” contours was established, and the software then filled in tumor contours on the intervening sections according to the interpolation algorithm. These interpolated contours were then manually refined section-by-section to achieve an accurate volumetric segmentation; edge detection software was not utilized. Desmoid tumors are often infiltrative with thin tails that extend along fascial planes, confounding reproducibility in maximum tumor diameter measurements; to mitigate this, we limited segmentation volumes to portions of the tumor where tails were greater than 2 mm in thickness. Because signal intensity at conventional MRI is arbitrary, muscle was used as an internal reference tissue, similar to prior investigations of changes in MRI enhancement in treated soft-tissue tumors (10). Internal reference tissue signal intensity in the skeletal muscle was defined by arbitrary regions of interest of at least 1 cm in diameter within regional skeletal muscle on at least three sections, so that variations in normal muscle signal intensity along the z-axis were averaged. Care was taken to avoid areas of muscle where signal intensity was artifactually degraded. While not recorded, we estimated that segmentations required approximately 15–30 minutes per time point assessment. Those cases involving smaller tumors with fewer irregular margins were expedited by the semiautomated segmentation process because less manual refinement was required to contour the tumor.
Image Texture Analysis
After tumor segmentation, the tumor volume was analyzed by the radiomics plug-in in 3D Slicer. This plug-in is based on Pyradiomics, which is an open-source Python package capable of extracting image texture features from medical imaging (11). A description of features can be found at https://pyradiomics.readthedocs.io/en/latest/features.html. Multiple image texture features from multiple textural feature classes were selected for analysis. Classes included first-order features (eg, mean, variance, kurtosis, energy), gray-level co-occurrence matrix, gray-level dependence matrix, gray-level run-length matrix, gray-level size-zone matrix (GLSZM), and neighboring gray-tone difference matrix.
Response Categorization
Because DF may shrink asymmetrically along either the major or minor cross-sectional axes, response was characterized by both RECIST 1.1 and WHO criteria at the lesion (not patient) level; distant or noncontiguous disease was not considered. Briefly, by RECIST 1.1, partial response (PR) is defined as greater than a 30% reduction in maximum diameter, progressive disease (PD) as a greater than a 20% increase in maximum diameter over nadir, and stable disease otherwise (complete response was not observed in our patients) (6). WHO criteria stipulate that PR is a greater than 50% decrease in the product of long and perpendicular diameters, whereas PD occurs when there is a greater than 25% increase in the product (12). For this study, PR for volumetrics was defined as a greater than 50% decrease, while PD was defined as a greater than 25% increase; these thresholds, while somewhat arbitrary, have been used in other volumetric studies of tumor response (13). Modified MRI-based Choi criteria were adapted for this study based on methods described above by using muscle signal as an internal reference to calculate a volumetric tumor-to-muscle ratio (8,10); a decrease in this ratio of greater than or equal to 30% from baseline was considered PR (MRI-modified Choi PR), while an increase of greater than 20% was considered PD (MRI-modified Choi PD). Progression-free survival (PFS) was defined as time from baseline MRI until first recorded instance of PD.
Statistical Analysis
Statistical analysis was performed using Stata version 13.1 (Stata) and R version 3.6.3 (R Foundation for Statistical Computing). Baseline descriptive tumor characteristics were computed. Overall and therapy-specific responses were compared by using paired t test and k-sample test of medians, respectively. Kaplan Meier curves for PFS were plotted for both RECIST 1.1 and WHO criteria, and best lesion responses were also recorded. The risk of PFS stratified by tumor location was assessed using the log-rank test. Volumetric results were compared with one- and two-dimensional measurements of tumor cross-sectional area. R package meta was used for obtaining pooled correlation coefficient from individual Spearman correlation coefficients. Image texture features were correlated with maximum tumor diameter using Spearman correlation coefficients by meta-analysis approach, which accounts for variation between correlation coefficients between individuals. Bonferroni correction was applied because 25 different features were tested, resulting in a corrected significance level of 0.2%. We also calculated adjusted P values from false discovery rate approach.
Results
Demographics and Baseline Tumor Characteristics
The mean age of the 27 patients was 39 years (range, 19–67 years), and 74% (20 of 27) were women (Table 1). The mean duration of imaging follow-up from baseline MRI was 1444 days or 4.0 years ± 2.7 (standard deviation) (range, 0.8–10.3 years). Among the 27 patients, a total of 207 unique time point assessments were performed (range, three to 17 examinations per patient). Ten tumors were primarily centered in the fascia, either superficially or in intermuscular fascial planes; 10 tumors had substantial components along the fascia and within muscle; seven tumors were centered within the muscle. Among 10 tumors involving the torso, seven involved the chest wall, and three the abdominal wall; three involved the gluteal region, three involved the neck, nine the lower extremity, and two the upper extremity.
Table 1:
Patient Demographics and Tumor Characteristics
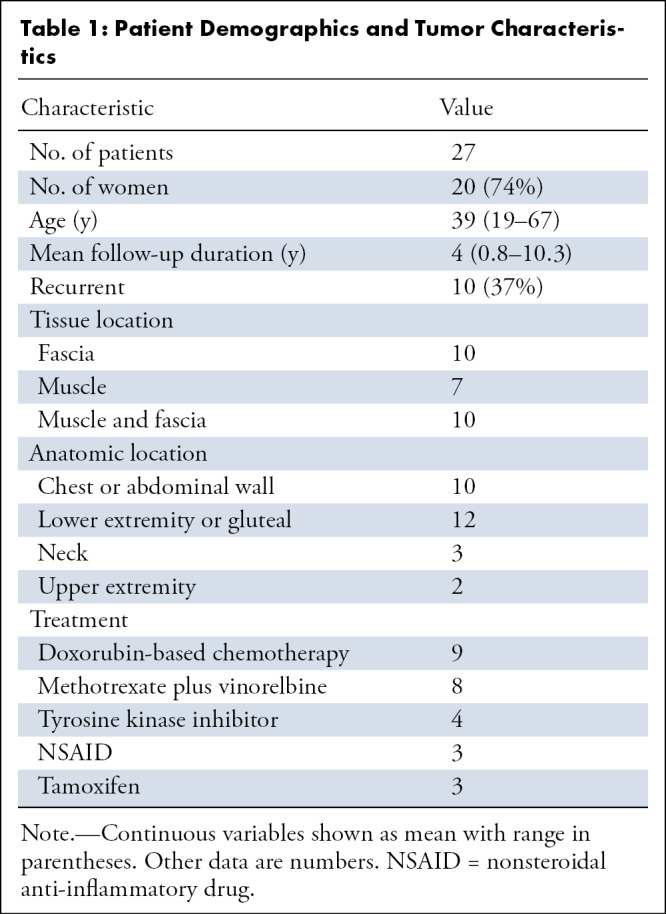
A total of 37% (10 of 27) of the patients had recurrent tumors, with many patients having been exposed to prior systemic agents and/or having undergone concurrent therapy with more than one agent (eg, tamoxifen and celecoxib; Table 1). For purposes of data analysis, patients were grouped according to the treatment of longest duration.
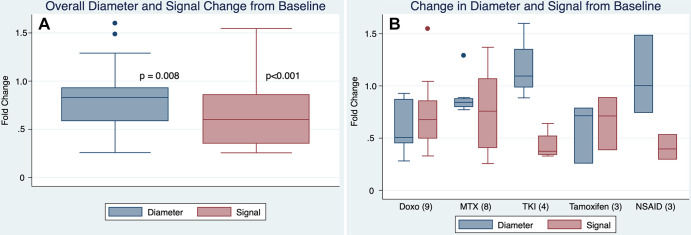
At baseline, mean tumor maximum diameter was 7.9 cm ± 3.4 (range, 3.4–15.2 cm); mean tumor volume was 176 cm3 ± 212 (range, 14.0–796 cm3). Mean normalized tumor signal ratio was 1.8. When compared with baseline, tumors at last follow-up showed overall significant decreases in size and signal (Fig 1).
Figure 1:
(A) Box plot of all patients shows that tumor size and signal at last follow-up decreased compared with baseline (ratio < 1 indicating decrease). P values determined by paired t tests. (B) By primary systemic treatment among different agents. There was no overall difference among the different treatment groups (P = .07 and .40 for diameter and signal, respectively, k-sample equality of medians); however, it should be noted that given small sample size, this study was underpowered to assess for meaningful differences between treatments. Doxo = doxorubicin-based chemotherapy, MTX = vinorelbine/methotrexate-based chemotherapy, NSAID = nonsteroidal anti-inflammatory drug (celecoxib or sulindac), TKI = tyrosine kinase inhibitor (imatinib or sorafenib).
Conventional Response Metrics: RECIST 1.1 and WHO
Ultimately, nine tumors progressed by RECIST. The overall median PFS by RECIST was 6.3 years and 5.5 years by WHO (Fig 2). There was no correlation between increasing age and disease progression (3% decrease in hazard ratio by univariate Cox proportional hazard model; P = .15) Also, sex was not a predictor of PFS (P = .74, log-rank test). Tumor location in the torso versus extremities did not influence median PFS, which were 6.3 and 4.7 years, respectively (P = .49, log-rank test). Tumor compartmental involvement was also not associated with PFS differences, with median PFS of 6.3 years for tumors centered intermuscularly or along fascia and 4.7 years for tumors within muscle; median PFS was not reached for tumors with substantial intramuscular and fascial components (P = .74, log-rank test).
Figure 2:
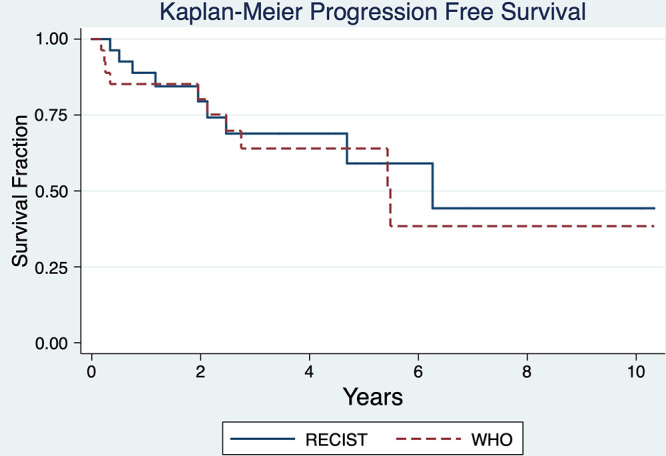
Overall Kaplan-Meier curves for study population shows progression-free survival (PFS) by RECIST 1.1 and WHO criteria at the lesion level. By RECIST 1.1 median PFS was 6.3 years, while by WHO median PFS was 5.5 years. RECIST = Response Evaluation Criteria in Solid Tumors, WHO = World Health Organization.
There were 10 tumors that showed PR by RECIST as the best response (Table 2), which occurred at a mean of 2 years. The overall mean change in tumor size to the best response was −27% in maximum diameter (range −75% to +48% from baseline). Excluding the patient with +48% increase in maximum diameter, mean overall change at the best response was −30.3%, with only three other patients having tumors that did not decrease in maximum diameter (and increasing 0.3%, 2%, and 7% from baseline).
Table 2:
Best Response Criteria Summary by Various Criteria
By WHO criteria, median PFS was 5.5 years. There were no differences in WHO median PFS based on tumor location or compartmental involvement. By WHO criteria, 12 tumors achieved PR, in a mean time of 2.5 years. Among 10 tumors with RECIST PR, nine tumors also achieved WHO PR: in four lesions (44%) WHO PR preceded RECIST PR by a mean of 0.53 years, in another four lesions (44%) WHO PR coincided with RECIST PR, and in one lesion (11%) RECIST PR preceded WHO PR by 0.2 years.
Alternative Response Metrics: Volume and MRI-modified Choi Criteria
A total of 70% (19 of 27) of tumors showed a decrease in segmented tumor volume of at least 50% compared with baseline, reaching this threshold at a mean of 1.3 years. All 10 tumors showing RECIST PR also exhibited at least a 50% decrease in volume either before PR (n = 8, 80%) or contemporaneous with PR (n = 2, 20%), in a mean time of 1.1 years (range, 0–3.9 years) and a median of 0.61 years from baseline; this was a shorter time frame compared with RECIST PR of 2 years (P = .02, paired t test). Of nine tumors showing at least a 50% decrease in volume within the 1st year of follow-up, only one developed subsequent PD (P = .23 in Kaplan-Meier analysis for a decrease of > 50% vs < 50%; Fig 3).
Figure 3:
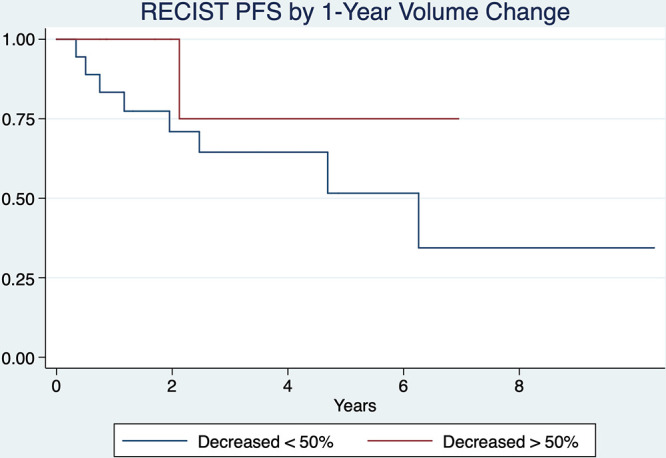
Kaplan-Meier curves compare tumors that had greater than or less than a 50% decrease in tumor volume at 1 year as defined by Response Evaluation Criteria in Solid Tumors (RECIST) 1.1 progression-free survival (PFS) (P = .23).
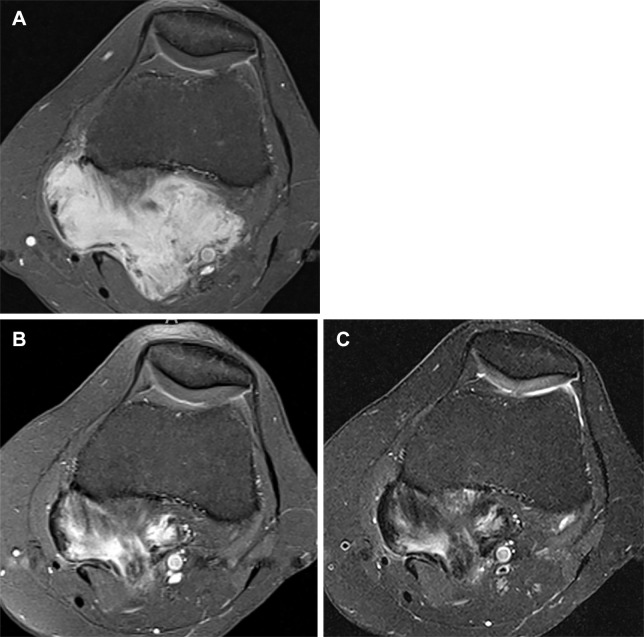
Overall, 81% (22 of 27) of tumors showed a decrease in signal ratio of greater than or equal to 30% from baseline (MRI-modified Choi PR, Fig 4); this occurred at a mean of 1.8 years ± 1.6 (range, 0.2–5.4 years). Among the 10 tumors showing RECIST PR, a preceding decrease in mean signal ratio from baseline by greater than or equal to 30% was observed in seven (70%), on average 1.3 years earlier than RECIST PR. Only 18% (four of 22) of tumors with MRI-modified Choi PR eventually showed evidence of PD, yielding a disease control rate of 82% (18 of 22) once this threshold was observed. The mean interval until PD in these four tumors was 2.0 years (range, 0.83–3.9 years) (Fig 5).
Figure 4:
(A) Axial contrast-enhanced T1-weighted fat-suppressed MR image at baseline shows avidly enhancing desmoid fibromatosis deep in the popliteal fossa, maximum diameter measured 66 mm. (B) After 10 months’ systemic therapy, there was significant reduction in enhancement throughout the tumor, reflecting increased collagenization; maximum diameter measured 55 mm. By RECIST 1.1, this 17% reduction in tumor diameter would be considered stable disease, highlighting RECIST 1.1 insensitivity to biologic tumor response. In contradistinction, the contrast-enhancement ratio decreased by approximately 50%, indicating partial response by MRI-modified Choi criteria. (C) Axial fat-suppressed proton density–weighted MR image (repetition time msec/echo time msec, 2980/50) also from the 10-month time point mirrors the pattern of contrast enhancement observed in B, highlighting that these sequences similarly map the tumor’s cellular and collagenous elements. mrChoi = modified MRI-based Choi, RECIST = Response Evaluation Criteria in Solid Tumors 1.1.
Figure 5:
(A) Axial contrast-enhanced T1-weighted fat-suppressed MRI scan at baseline shows an enhancing desmoid fibromatosis deep in the lateral proximal thigh that measured up to 64 mm in maximum diameter (arrow). (B) At follow-up 14 months later, the desmoid fibromatosis shows increase in diameter to 81 mm (arrow), a 27% increase from baseline, constituting progressive disease. Note that while the anterior tumor component contains characteristic bands of collagen, the posterior component remains avidly enhancing and has increased in width.
Among patients who never achieved RECIST PR (n = 17), the best responses averaged −10% (standard deviation, 18%) and occurred at a mean of 2.6 years (standard deviation, 2.8 years) from baseline. In this patient subset, the best volumetric and MRI-modified Choi response means were −40% and −38%; there were nine volumetric and 13 MRI-modified Choi PRs which occurred at 1.8 and 1.9 years from baseline, respectively.
Image Textural Features
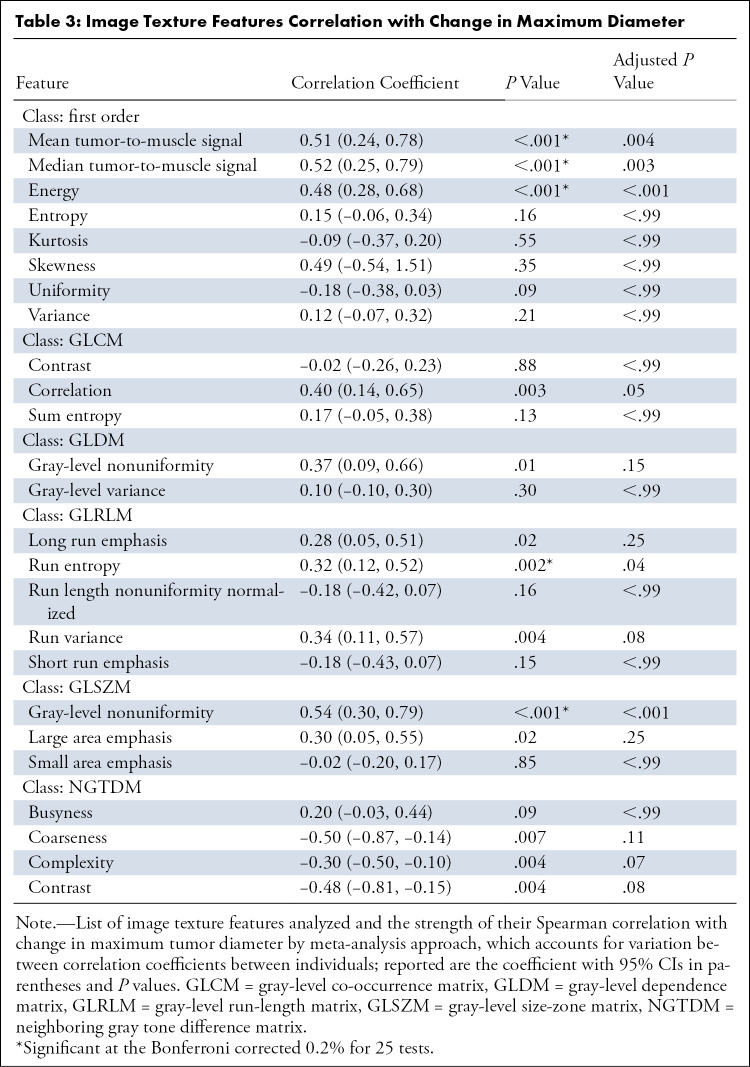
Spearman correlation coefficient ρ was used to test for univariate associations between the change in maximum tumor diameter and image texture features. Overall, at least one feature from every texture class was significantly associated with change in tumor diameter in the univariate analysis at an uncorrected 5% significance level, and 20% (five of 25) of tested texture features were significant at the Bonferroni corrected 0.2% significance level (Table 3).
Table 3:
Image Texture Features Correlation with Change in Maximum Diameter
Mean tumor-to-muscle signal ratio, the basis for MRI-modified Choi response criteria, and the related median tumor-to-muscle signal ratio, showed moderate correlation coefficients with tumor size (ρ = 0.51 [P < .001] and 0.52 [P < .001]), which remained significant after Bonferroni correction (corrected P = .004 and P = .003, respectively). Other features that maintained Bonferroni-corrected significance included energy (ρ = 0.48; P < .001), run entropy (ρ = 0.32; P = .04), and GLSZM gray-level nonuniformity (ρ = 0.54; P < .001).
Discussion
DF remains a challenging entity to manage despite recent advances in understanding the genetic drivers of tumor biology. Recently established consensus guidelines endorse active surveillance as the preferred approach to primary or recurrent sporadic and familial DFs, with medical therapy used as second-line treatment and surgery reserved for abdominal wall tumors failing active surveillance (3). Tyrosine kinase inhibition has shown a greater than 80% disease control rate at 2 years, compared with 36% receiving a placebo (14). However, a significant percentage of patients receiving a placebo had tumors that spontaneously regressed, such that approximately 20% reached RECIST PR. Longitudinal MRI assessment that incorporates volumetric and image texture analysis could improve management by identifying early imaging markers of aggressiveness and therapeutic response. Our findings corroborate the recent findings by Crombé et al and the French Sarcoma Group that radiomics quantification of changes in tumor heterogeneity improves response evaluation in systemically treated DF (15).
Individual DF behavior is notoriously difficult to fully characterize in a single measurement, and RECIST 1.1 fails to address (a) minor axis morphologic changes and (b) signal intensity variation owing to tumor collagenization. We attempted to address some of these shortcomings by investigating whether tumor volumetrics and image texture analysis offered compelling imaging markers of tumor response in a retrospective cohort of patients treated with systemic therapy for DF.
Among the 10 tumors that showed best RECIST response as PR (at a mean time of 2 years), the vast majority showed PR at the same or earlier time points for all other response criteria tested. For WHO criteria, this included four preceding PRs by an average of 6 months; for volumetrics, there were eight preceding PRs by an average of 1.1 years; and for MRI-modified Choi, there were seven preceding PRs at a mean of 1.3 years earlier than RECIST PR.
It is particularly important to establish treatment efficacy early based on signal changes because RECIST PR may not manifest until many months or even years after treatment initiation. Quantifying decreases in signal intensity over the entire tumor volume provides important confirmation of a systemic agent’s activity; this verification is critical in reassuring patients and clinicians that continuation of therapy is warranted. Our results also suggest that attaining PR thresholds may be available more than 1 year sooner when signal alterations, rather than size, are considered. Integrating signal-based response criteria into assessments of desmoid tumors may thereby permit an acceleration of desmoid clinical trials by (a) reducing the time necessary to achieve particular objective imaging endpoints (ie, PR), or (b) reducing the study sample size required by power analysis by generating a stronger treatment effect signal for active agents.
In a univariable analysis, a decrease in MRI-modified Choi ratio from baseline was a statistically significant predictor of decreased tumor size over time. After correcting for multiple testing, image texture features that significantly correlated with tumor diameter included tumor-to-muscle signal ratio (using mean and median signal), energy, run entropy, and gray-level nonuniformity. While a full discussion of how image features are calculated is beyond the scope of this article, higher order textural analyses hinge on quantification of the relationship between signal intensity and spatial arrangement of different pairs and groupings of pixels, permitting more granular assessment of tumor signal changes and heterogeneity (7,16). Energy is a measure of the magnitude of voxel values in an image but is confounded by tumor volume. Run entropy measures the randomness in the distribution of run lengths and gray levels—lower values indicate less heterogeneity in the texture patterns. Gray-level nonuniformity measures the variability of gray-level intensity values, with lower values indicating increasing tumor homogeneity (11).
The moderate levels of correlation observed between these features of tumor signal heterogeneity and tumor size supports the notion that dimensional changes accompany parenchymal changes in signal intensity. It is possible that only a few key textural parameters would be sufficient to further stratify tumor response, as recently shown in other soft-tissue sarcomas when correlating radiomics with tumor grade (17), response (18), and overall survival (19). When considering time point response assessments, we focused on mean tumor-to-muscle signal ratio as the most intuitive textural feature, and as the most appropriate corollary to other response criteria in soft-tissue sarcomas (10,20). The image texture parameters that moderately correlated with tumor size in our study—energy, run entropy, and GLSZM gray-level nonuniformity—were not directly tested as a set of early response criteria because these were intended to be exploratory analyses. As hypothesis-generating data, the consistent moderate correlation of image texture parameters with tumor size across various radiomics feature classes merits further investigation as a separate set of response features. This in fact has recently been borne out because a radiomics score developed by Crombé et al showed superior performance compared with conventional response criteria, with higher radiomics score portending worse clinical outcomes (15).
This study had several weaknesses, notably its retrospective nature and lack of correlates for subjective clinical response. Because it was retrospective, there was heterogeneity in the MRI protocols, with variability related to section thickness, fat-suppression strategies, and fast-spin versus gradient-echo sequences potentially confounding comparisons between examinations of the same patient, and among different patients. In a few instances, fat-suppressed T2-weighted sequences were used instead of postcontrast sequences, but given the similarity of these two sequences in identifying cellular versus collagenous tumor components, we believe this study limitation has little effect on our conclusions. Image acquisition parameters also influence image texture measurements, and we emphasize that MRI protocol differences between scans should be minimized in future studies aiming to validate image texture features as imaging markers (21). Using muscle tissue as an internal reference for signal intensity helped mitigate some of these technical differences, but a prospective data set with uniform acquisition parameters would be ideal. We also lacked a robust clinical instrument for scoring symptomatic improvement over the course of treatment, with imaging serving as the primary indicator of disease activity. Many tumors in this series were large, but image textural analysis may be less informative for smaller, more homogeneous lesions. Correlating DF imaging changes with clinical outcomes remains a priority but will be challenging in this disease because traditional oncology endpoints like histologic necrosis or survival are not relevant in DF (22). Future studies might employ a strategy of using “time to change in therapy” as a clinical endpoint in the absence of prospectively gathered symptom and/or function scores, although even this endpoint is likely heavily influenced by imaging findings. It should be stressed this study was not conducted to ascertain differences in treatment outcomes and was underpowered to compare efficacy of different regimens. Rather, the primary aim was to compare imaging endpoints in a disease in which traditional response criteria may be inadequate to characterize tumor biology.
In conclusion, this study shows that desmoid fibromatoses manifest changes in response to systemic therapy that may be quantified at early time points using volumetric and texture analysis, and in particular, normalized tumor signal. This approach provides attractive imaging markers for therapeutic efficacy that precede by months or years traditional one- and two-dimensional metrics of response. Prospective studies are warranted to validate the performance of MRI image texture parameters compared with RECIST 1.1 so that disease-specific response criteria for DF might be established.
Acknowledgments:
We would like to gratefully acknowledge the assistance of Ahmet Murat Bagci and Sang H. Lee in conducting preliminary tumor analysis.
T.K.S. has received grant support From the Toshiba America Medical Systems/RSNA Research Seed Grant (#RSD1635) and grant support From the Desmoid Tumor Research Foundation; B.A.W. has received grant support From the Desmoid Tumor Research Foundation.
Disclosures of Conflicts of Interest: T.K.S. Activities related to the present article: institution received RSNA/Toshiba America Medical Systems research seed grant (RSD1635 “Semi-automated qMRI to Assess Desmoid Tumor Volumetric and Stromal Changes Induced by Systemic Therapy”; author is principal investigator); Sub-I on grant from Desmoid Tumor Research Foundation “Correlation of CTNNB1 Mutation Status with Chemotherapy Response by MRI in Patients with Desmoid Tumors”; principal investigator: Breelyn A. Wilky. Activities not related to the present article: author paid consultant for Arog Pharmaceuticals (received no funding related to preparation of this manuscript); honoraria from iiCME for speaking activities unrelated to preparation of this manuscript. Other relationships: disclosed no relevant relationships. K.F. disclosed no relevant relationships. K.S. disclosed no relevant relationships. N.A. Activities related to the present article: disclosed no relevant relationships. Activities not related to the present article: employed by the University of Miami. Other relationships: disclosed no relevant relationships. D.K. disclosed no relevant relationships. A.R. disclosed no relevant relationships. J.T. Activities related to the present article: disclosed no relevant relationships. Activities not related to the present article: author is consultant for Deciphera, Bayer, Blueprint, Epizyme, Daiichi, and C4 Therapeutics. Other relationships: disclosed no relevant relationships. B.A.W. Activities related to the present article: disclosed no relevant relationships. Activities not related to the present article: author is consultant for Springworks and Deciphera. Other relationships: disclosed no relevant relationships.
Abbreviations:
- DF
- desmoid fibromatosis
- GLSZM
- gray-level size-zone matrix
- PD
- progressive disease
- PFS
- progression-free survival
- PR
- partial response
- RECIST
- Response Evaluation Criteria in Solid Tumors
- WHO
- World Health Organization
References
- 1.Lee JC, Thomas JM, Phillips S, Fisher C, Moskovic E. Aggressive fibromatosis: MRI features with pathologic correlation. AJR Am J Roentgenol 2006;186(1):247–254. [DOI] [PubMed] [Google Scholar]
- 2.Penel N, Le Cesne A, Bonvalot S, et al. Surgical versus non-surgical approach in primary desmoid-type fibromatosis patients: A nationwide prospective cohort from the French Sarcoma Group. Eur J Cancer 2017;83(125):131. [DOI] [PubMed] [Google Scholar]
- 3.Desmoid Tumor Working Group. The management of desmoid tumours: A joint global consensus-based guideline approach for adult and paediatric patients. Eur J Cancer 2020;127(96):107. [DOI] [PubMed] [Google Scholar]
- 4.Shinagare AB, Ramaiya NH, Jagannathan JP, et al. A to Z of desmoid tumors. AJR Am J Roentgenol 2011;197(6):W1008–W1014. [DOI] [PubMed] [Google Scholar]
- 5.Ganeshan D, Amini B, Nikolaidis P, Assing M, Vikram R. Current Update on Desmoid Fibromatosis. J Comput Assist Tomogr 2019;43(1):29–38. [DOI] [PMC free article] [PubMed] [Google Scholar]
- 6.Eisenhauer EA, Therasse P, Bogaerts J, et al. New response evaluation criteria in solid tumours: revised RECIST guideline (version 1.1). Eur J Cancer 2009;45(2):228–247. [DOI] [PubMed] [Google Scholar]
- 7.Gillies RJ, Kinahan PE, Hricak H. Radiomics: Images Are More than Pictures, They Are Data. Radiology 2016;278(2):563–577. [DOI] [PMC free article] [PubMed] [Google Scholar]
- 8.Sheth PJ, Del Moral S, Wilky BA, et al. Desmoid fibromatosis: MRI features of response to systemic therapy. Skeletal Radiol 2016;45(10):1365–1373. [DOI] [PubMed] [Google Scholar]
- 9.Fedorov A, Beichel R, Kalpathy-Cramer J, et al. 3D Slicer as an image computing platform for the Quantitative Imaging Network. Magn Reson Imaging 2012;30(9):1323–1341. [DOI] [PMC free article] [PubMed] [Google Scholar]
- 10.Stacchiotti S, Collini P, Messina A, et al. High-grade soft-tissue sarcomas: tumor response assessment--pilot study to assess the correlation between radiologic and pathologic response by using RECIST and Choi criteria. Radiology 2009;251(2):447–456. [DOI] [PubMed] [Google Scholar]
- 11.van Griethuysen JJM, Fedorov A, Parmar C, et al. Computational Radiomics System to Decode the Radiographic Phenotype. Cancer Res 2017;77(21):e104–e107. [DOI] [PMC free article] [PubMed] [Google Scholar]
- 12.Suzuki C, Torkzad MR, Jacobsson H, et al. Interobserver and intraobserver variability in the response evaluation of cancer therapy according to RECIST and WHO-criteria. Acta Oncol Stockh Swed 2010;49(4):509–514. [DOI] [PubMed] [Google Scholar]
- 13.Shah GD, Kesari S, Xu R, et al. Comparison of linear and volumetric criteria in assessing tumor response in adult high-grade gliomas. Neuro Oncol 2006;8(1):38–46. [DOI] [PMC free article] [PubMed] [Google Scholar]
- 14.Gounder MM, Mahoney MR, Van Tine BA, et al. Sorafenib for Advanced and Refractory Desmoid Tumors. N Engl J Med 2018;379(25):2417–2428. [DOI] [PMC free article] [PubMed] [Google Scholar]
- 15.Crombé A, Kind M, Ray-Coquard I, et al. Progressive Desmoid Tumor: Radiomics Compared With Conventional Response Criteria for Predicting Progression During Systemic Therapy-A Multicenter Study by the French Sarcoma Group. AJR Am J Roentgenol 2020;215(6):1539–1548. [DOI] [PubMed] [Google Scholar]
- 16.Davnall F, Yip CSP, Ljungqvist G, et al. Assessment of tumor heterogeneity: an emerging imaging tool for clinical practice?. Insights Imaging 2012;3(6):573–589. [DOI] [PMC free article] [PubMed] [Google Scholar]
- 17.Zhang Y, Zhu Y, Shi X, et al. Soft Tissue Sarcomas: Preoperative Predictive Histopathological Grading Based on Radiomics of MRI. Acad Radiol 2019;26(9):1262–1268. [DOI] [PubMed] [Google Scholar]
- 18.Crombé A, Périer C, Kind M, et al. T2 -based MRI Delta-radiomics improve response prediction in soft-tissue sarcomas treated by neoadjuvant chemotherapy. J Magn Reson Imaging 2019;50(2):497–510. [DOI] [PubMed] [Google Scholar]
- 19.Spraker MB, Wootton LS, Hippe DS, et al. MRI Radiomic Features Are Independently Associated With Overall Survival in Soft Tissue Sarcoma. Adv Radiat Oncol 2019;4(2):413–421. [DOI] [PMC free article] [PubMed] [Google Scholar]
- 20.Choi H. Role of Imaging in Response Assessment and Individualised Treatment for Sarcomas. Clin Oncol (R Coll Radiol) 2017;29(8):481–488. [DOI] [PubMed] [Google Scholar]
- 21.Rizzo S, Botta F, Raimondi S, et al. Radiomics: the facts and the challenges of image analysis. Eur Radiol Exp 2018;2(1):36. [DOI] [PMC free article] [PubMed] [Google Scholar]
- 22.Bellera CA, Penel N, Ouali M, et al. Guidelines for time-to-event end point definitions in sarcomas and gastrointestinal stromal tumors (GIST) trials: results of the DATECAN initiative (Definition for the Assessment of Time-to-event Endpoints in CANcer trials)†. Ann Oncol 2015;26(5):865–872. [DOI] [PubMed] [Google Scholar]


