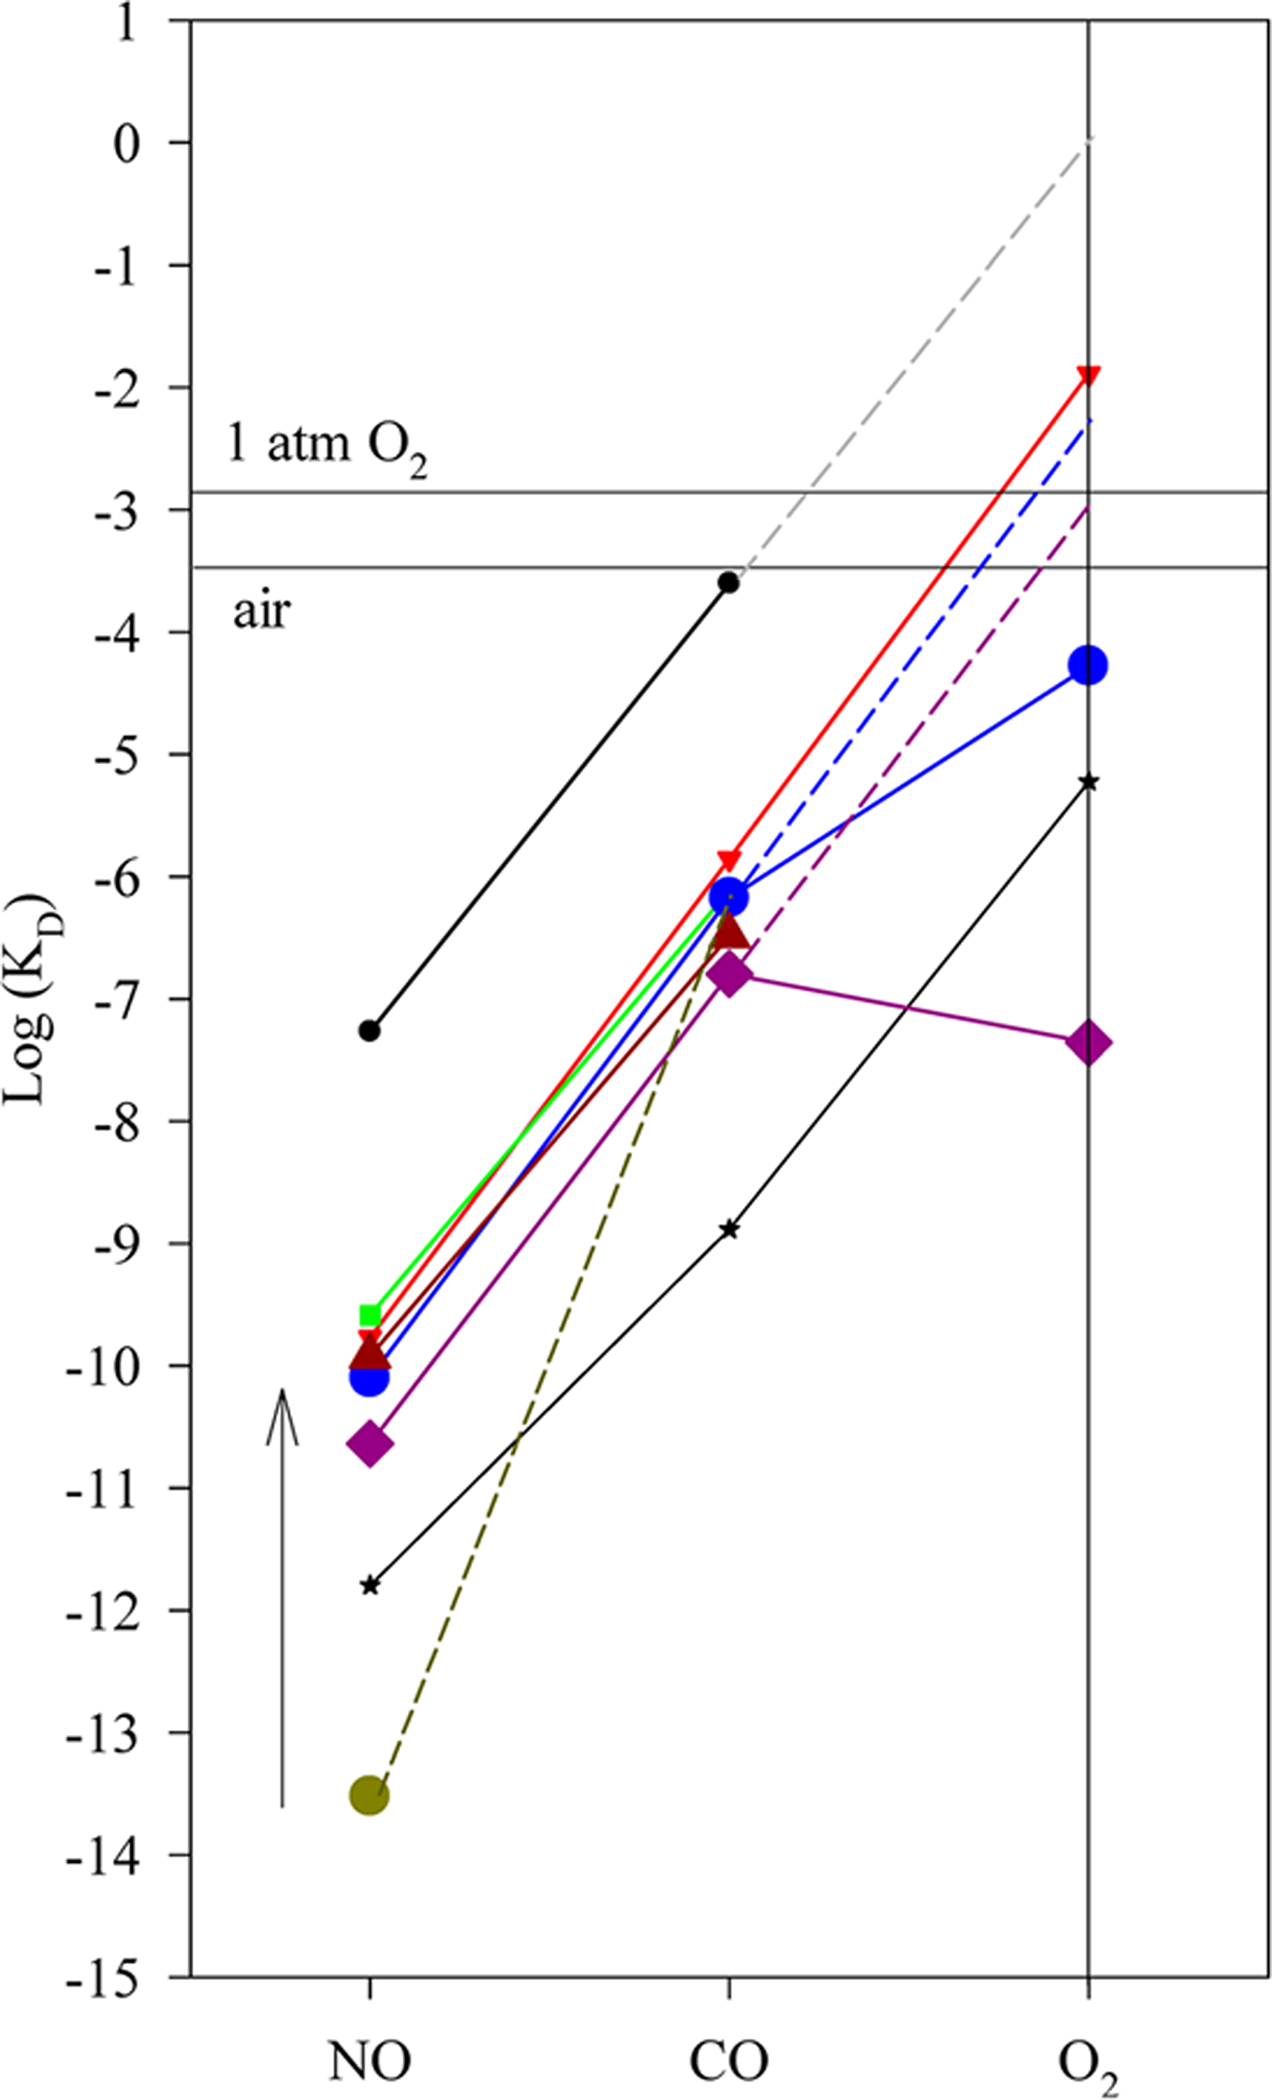
Figure 7.

Relationship of log KD’s for H-NOXs versus ligand type. The measured logarithm values of KD(NO), KD(CO), and KD(O2) of H-NOXs are plotted versus ligand type. KD’s measured for sGC and heme model ferrous PPIX(1-MeIm) are also plotted for comparisons. Wt Cb H-NOX (blue circle); Y139F Cb H-NOX (brown triangle); Tt H-NOX (purple diamond); Vc H-NOX (green square); Ns H-NOX (red triangle); sGC (black circle) (an extrapolation from sGC log KD(NO)-log KD(CO) line, gray dashed line, predicts its KD(O2) ≈ 1.1 M) and ferrous PPIX (1-MeIm) (black star). The KD(NO) (dark yellow circle) of Cb H-NOX previously measured6 is connected to its KD(CO) by the broken line; the change between the KD(NO) measured in this study, and the previously measured value is represented by the arrow. The blue and purple dashed lines represent the prediction of KD(O2)’s of Cb and Tt H-NOXs, respectively, based on the extrapolation from their log KD(NO)-log KD(CO) lines.
