

Abstract
The coronavirus-19 pandemic and its secondary effects threaten the continuity of essential health services delivery, which may lead to worsened population health and a protracted public health crisis. We quantify such disruptions, focusing on maternal and child health, in eight sub-Saharan countries. Service volumes are extracted from administrative systems for 63 954 facilities in eight countries: Cameroon, Democratic Republic of Congo, Liberia, Malawi, Mali, Nigeria, Sierra Leone and Somalia. Using an interrupted time series design and an ordinary least squares regression model with facility-level fixed effects, we analyze data from January 2018 to February 2020 to predict what service utilization levels would have been in March–July 2020 in the absence of the pandemic, accounting for both secular trends and seasonality. Estimates of disruption are derived by comparing the predicted and observed service utilization levels during the pandemic period. All countries experienced service disruptions for at least 1 month, but the magnitude and duration of the disruptions vary. Outpatient consultations and child vaccinations were the most commonly affected services and fell by the largest margins. We estimate a cumulative shortfall of 5 149 491 outpatient consultations and 328 961 third-dose pentavalent vaccinations during the 5 months in these eight countries. Decreases in maternal health service utilization are less generalized, although significant declines in institutional deliveries, antenatal care and postnatal care were detected in some countries. There is a need to better understand the factors determining the magnitude and duration of such disruptions in order to design interventions that would respond to the shortfall in care. Service delivery modifications need to be both highly contextualized and integrated as a core component of future epidemic response and planning.
Keywords: Essential health services, service disruptions, sub-Saharan Africa, maternal and reproductive health, COVID-19 pandemic, health management information systems
Key messages.
The COVID-19 pandemic and its secondary effects caused significant disruptions in the delivery of essential health services across sub-Saharan Africa and may produce substantial increases in morbidity and mortality.
The largest disruptions were observed in outpatient care and vaccinations, but disruptions were also identified in reproductive and maternal health services with significant cross-country variation in the timing and magnitude.
The ability of health systems to maintain continuity of essential services must be protected as the global community responds to the pandemic and the ensuing economic crises.
Dedicated catch-up campaigns may minimize the adverse consequences of missed care, especially for children.
Introduction
As countries respond to the coronavirus-19 (COVID-19) pandemic, health systems face the additional burden of maintaining continuity in essential health services. Pandemic-induced disruptions in routine health-care services, especially for countries with fragile health systems, can lead to a protracted public health crisis and threaten global progress toward reducing maternal and child mortality as well as other global health goals. Past disruptions of essential health services have been documented for various services and crises (Chang et al., 2004; Sochas et al., 2017; Wagenaar et al., 2018). As an example, systematic reviews and meta-analysis of the 2013–16 West African Ebola outbreak found large reductions in healthcare utilization (Ribacke et al., 2016; Wilhelm and Helleringer, 2019). These lapses can have a direct impact on morbidity and mortality. For instance, disruptions in vaccination in the three countries with the highest Ebola burden resulted in an elevated incidence of measles persisting for 2 years after the outbreak (Sesay et al., 2017; Wesseh et al., 2017; Masresha et al., 2020).
The global extent and the protracted length of the current COVID-19 pandemic threaten the continuity of health services along multiple channels. A health system’s capacity to provide routine services can be impaired by the reallocation of resources toward pandemic response, an overburdened health workforce and strained supply chains. There may also be a reduction in healthcare-seeking behavior as potential patients avoid health facilities due to fear of exposure. For example, women who believed health facilities were a transmission source during the 2013–16 Ebola outbreak were at 30% lower odds of delivering within a facility (Ly et al., 2016). The lockdown policies introduced to mitigate the spread of the virus and the economic downturn also affect mobility and the ability to pay for services. A household survey conducted in Nigeria during April–May 2020 found that 79% of households experienced reductions in income compared to mid-March income levels (Siwatu et al., 2020).
From the start of the COVID-19 pandemic, there have been concerns about potential disruptions in essential health services delivery. In a May–July pulse survey of health officials in 105 countries, 90% reported some level of disruption due to the pandemic, with a wide array of services affected (World Health Organization, 2020). Although higher-income countries have reported disruptions in outpatient care and vaccinations, low- and middle-income countries reported more extensive utilization gaps and were more likely to indicate shortages in medical supplies and staff (Saso et al., 2020; World Health Organization, 2020). Early model-based studies simulated adverse changes to health outcomes under various scenarios of service disruptions and disease spread (Abbas et al., 2020; Hogan et al., 2020; Jewell et al., 2020; Roberton et al., 2020; Sherrard-Smith et al., 2020). Subsequently, emerging literature documents observed changes in service utilization during the pandemic. For example, disturbances were reported in China’s tuberculosis control and treatment services and the number of vaccinations administered in Pakistan and Sierra Leone (Buonsenso et al., 2020; Chandir et al., 2020; Fei et al., 2020). A study of referral hospitals in Burkina Faso, Tanzania and The Gambia found substantial reductions in new and follow-up attendance at hepatitis clinics (Lemoine et al., 2020). Studies that examine a wider range of services have reported mixed results. A survey of primary health clinics in rural South Africa finds no impact of lockdown measures on total visits but identified decreases in child health-care visits (Siedner et al., 2020). In Kenya, a comparison of monthly service utilization data from March to June in 2019 and 2020 reveals no significant hospital attendance changes for antenatal care, births, family planning consultations and other services but identified increases in both teen pregnancy and family planning uptake among youth (Shikuku et al., 2020).
This study quantifies the disruption of maternal and child health services during the COVID-19 pandemic using nationally comprehensive administrative data in eight sub-Saharan African nations. These countries, whose population totals almost 30% of the sub-Saharan African population, include Cameroon, Democratic Republic of Congo (DRC), Liberia, Malawi, Mali, Nigeria, Sierra Leone and Somalia. As women and children are vulnerable groups that may be at higher risk of adverse health outcomes due to service disruptions, this study focuses on reproductive, maternal and child health services.
Methods
Study design
To assess the impact of the COVID-19 pandemic on the utilization of essential health services, we use a generalized interrupted time series study design. Longitudinal panel data on monthly service volumes from health facilities over the period from January 2018 to February 2020 are used to predict hypothetical service utilization levels in March–July 2020 in the absence of the pandemic. This design assumes that both secular trends and seasonal effects observed before the pandemic would have persisted if the pandemic had not occurred. Earlier years are not included to reduce the possibility of bias due to national policy changes, sporadic health outreach campaigns, other health shocks and the lower completeness of immature Health Management Information Systems (HMIS) observed before 2018.
The interruption date is designated to be March 2020 across the eight countries since it is the first month service volume that was possibly affected by the pandemic. Apart from Nigeria, where the first case was reported on February 28, all analyzed countries reported COVID-19 index cases during March or the beginning of April (see Supplementary Table S1). In addition, the World Health Organization declared the outbreak as a pandemic in March, and countries introduced containment policies, including restrictions on gatherings, domestic travel and workplace closures (Hale et al., 2021). The countries differ, however, in the types of measures introduced. According to the Oxford Blavatnik COVID-19 government response tracker, Liberia, Nigeria and Sierra Leone imposed the most stringent government responses while Somalia and Malawi imposed the least stringent response.1
Data sources
We leverage administrative data on the number of services provided, reported monthly by health facilities into the national HMIS. In contrast to studies that report utilization rates in a single facility or from facilities in a specific region, the use of HMIS data allows for a broad-based investigation of trends in service utilization. HMIS data have been used to monitor service continuity during previous crises. Studies following the 2013–16 West African Ebola epidemic found disruptions measured from HMIS data were consistent estimates from facility registers, household surveys and key informant interviews (Iyengar et al., 2015; Lori et al., 2015; Jones et al., 2016; Wesseh et al., 2017; Wagenaar et al., 2018; Quaglio et al., 2019). By developing a rigorous approach to utilize HMIS to monitor service disruptions, we hope to guide health system interventions to mitigate the indirect effects of COVID-19 and promote an analytic framework that can rapidly identify and respond to future service disruptions. The results can also be used to validate the assumptions adopted in previous modeling exercises (Abbas et al., 2020; Hogan et al., 2020; Jewell et al., 2020; Roberton et al., 2020; Sherrard-Smith et al., 2020) to better anticipate changes to population health outcomes.
This analysis is part of a broader effort by the Global Financing Facility for Women, Children, and Adolescents (GFF) to support national health systems in monitoring the continuation of essential health services during the COVID-19 pandemic. All 36 GFF partner countries were invited to participate in this activity. The countries included in this analysis are the sub-Saharan African countries for which the analysis was complete, and the respective health authorities of each partner country agreed to the publication of the results by December 2020.
A census of facility-level service utilization volumes was extracted in March 2021 from the HMIS for eight countries for each month from January 2018 to July 2020. The data are predominately from the public sector for all eight countries and include primary, secondary and tertiary facilities. Services provided by community workers are not commonly reported in these data. Not all indicators had data available for 2018, and the data from Somalia exclude facilities from the region of Somaliland. For each indicator and calendar year, facilities were excluded if no service volume was provided over the entire year. This criterion commonly excluded medical stores, pharmacies, specialty service facilities (e.g. ophthalmologists), lower-level facilities with limited service packages and non-functional facilities.
Indicators
Eight core health indicators were chosen to characterize the reproductive, maternal and child healthcare continuum. These indicators capture key service delivery events, which have higher completeness rates and higher volume. Reports of health outcomes such as maternal deaths or poor child nutritional status were rare and may be particularly influenced by reduced detection rates during the pandemic period.
Outpatient consultations are selected as a general measure of service utilization. Family planning consultations are the primary indicator of reproductive services. Antenatal care, institutional delivery and postnatal care indicators measure the volume of critical health-care events during maternity. Bacille Calmette-Guérin (BCG) and the third pentavalent dose administration represent the initiation and close completion of the vaccination schedule. Changes in these key indicators are likely to represent changes in other concurrently provided services. Each of these indicators is a measure of the number of services provided during the month, and those are collected from patient ledgers and records, aggregated and reported monthly facility-specific population denominators. Indicator definitions reported in Table 1 are largely consistent between countries, although the precise definition can vary. Not every enumerated health facility provides each of the services or reports volumes each month; therefore, the number of non-missing facility observations varies across indicators and by month. The data cover 63 954 facilities in the eight countries and eight indicators over 31 months. The final database contains 9 499 075 non-missing facility-month pairs. Supplementary Tables S2 and S3 give more detail on the indicator-specific facility reporting behavior for each country.
Table 1.
Definition of health service indicators, by country
| Outpatient consultation | Pentavalent vaccination | BCG vaccination | Delivery | First antenatal care visit | Fourth antenatal care visit | First postnatal care | Family planning | |
|---|---|---|---|---|---|---|---|---|
| Cameroon | Outpatient consultations excluding pregnant women | Number of children who received the Penta 3 vaccine | BCG doses given | Number of institutional deliveries | Number of pregnant women registered in ANC1 | Number of women who attended their 4th or more antenatal care visit | Number of mother/newborn couples who received at least one postnatal consultation within 48 hours of childbirth | Number of new acceptors |
| DRC | Outpatient consultations new cases | Pentavalent 3 doses given 0–11 months | BCG for 0–11 months total | Deliveries by qualified personnel | Number of women who attended the ANC 1st Visit | Number of women who attended the 4th antenatal care visit | Number of women who attended the first PNC visit | Number of accepters of modern family planning methods |
| Liberia | New outpatient consultations | Pentavalent 3 doses given | BCG doses given | Institutional deliveries by skilled birth attendants | Number of women who attended the ANC 1st visit | Number of women who attended the 4th antenatal care visit | Number of PNC visit within 24 hours after delivery | Family planning consultations |
| Malawi | Number of outpatient consultations | Number of children given Pentavalent 3 | Children under 1 given BCG | Institutional deliveries | Number of women who attended the ANC 1st visit | Number of women who attended the 4th antenatal care visit | Number of babies checked during PNC < 48 hours | Number of oral pill users |
| Mali | Total curative consultations | Penta 3 for children 0–11 months | BCG for children 0–11 months | Number of institutional deliveries by qualified personnel | – | Total ANC visits | Number of new postnatal consultations | Number of total family planning consultations |
| Nigeria | Outpatient attendance | Pentavalent 3 doses given | Children under 1 given BCG | Number of deliveries by skilled birth attendants | Number of women who attended the ANC 1st visit | Number of women who attended the 4th antenatal care visit | Number of postnatal consultations | Family planning clients counseled |
| Sierra Leone | Headcount of all services | Pentavalent 3 doses given | BCG Doses Given | Number of deliveries by skilled birth attendants with live birth outcome | Antenatal visit client 1st visit | 4th Antenatal care visit | Number of women with postnatal first contact | Number of family planning clients |
| Somalia | New outpatient consultations | Pentavalent 3 doses given | BCG doses given | Total deliveries | Number of women who attended the ANC 1st visit | Number of women who attended the 4th antenatal care visit | First postnatal visit within two days | Number of contraceptives dispensed |
Indicators in the Health Management Information System are defined and collected by the health authority in each country. In some settings, the selected indicator may not be available, or the data quality may be too poor for inclusion. In these cases, the closest proxy indicator is used, bolded and italicized above.
Data processing
HMIS data present several inferential challenges. First, there may be gaps in information related to a specific geography or service delivery method. For instance, many countries’ private or informal providers are not legally mandated to report to the HMIS. As a result, our analysis provides a partial picture of changes to service provision. Second, data quality and timeliness of reporting can vary across and within countries. Reports from facilities are often hand-tabulated and may include reporting errors. Lastly, the pandemic can strain health facilities, causing reductions in reporting and confounding variation in service volume with changes in reporting completeness.
To limit the threat to reliability posed by these limitations, we first resolve probable outlier values that resulted from data entry errors. Standard guidance for data quality audits of HMIS data suggest defining outliers as observations >2–3SD (or >3.5 z-score) from the mean of other facilities reporting the indicator the same month (World Health Organization, 2017). However, this algorithm is likely to be biased toward correction of values in higher-volume facilities. Therefore, we take an approach of calculating the outliers for each facility separately through a conservative three-rule heuristic. Each facility’s mean and standard deviation were calculated for the distribution truncated by the 10th–90th percentiles. Observations are replaced with a missing value if one of the following sets of conditions is met: (1) the facility reports at least seven data points during the year, the observation is >3 SD from the clipped mean, and the observation is 1.5 times larger than the 90th percentile or (2) the facility reports at least three data points in a given year, and the observation is more than three times the 90th percentile value or (3) the sole observation accounts for 80% of the services the facility reported during the year.
Second, we reconcile situations where the service volume was missing when no services were provided or when the data should be missing, but zero services were reported. Missing or zero reports for an indicator are treated as missing if the health facility reports no outpatient consultations for the same month or if all data for the indicator are missing or zero throughout the calendar year. Otherwise, a zero value is assigned. An example of these sample restrictions and data changes is given for institutional deliveries in Liberia in supplemental figures, and robustness checks for each of the data changes are presented.
Figure 1 reports data completeness after data processing by indicator for facilities that report at least once between January 2018 and July 2020. The highest performing countries in terms of complete data are Mali, Sierra Leone and Liberia, in which 80–90% of facilities consistently report data each month. Four countries experienced a drop in reporting during the pandemic. Indicators are excluded from analysis if they fall below 40% completeness to avoid data biased toward higher-performing facilities or specific geographic areas.
Figure 1.
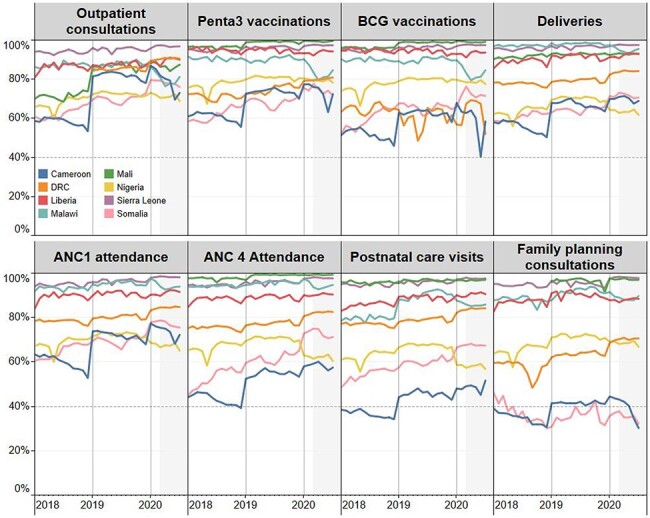
Percentage of facilities reporting data by month, indicator and country, 2018–20
Data on service volumes are abstracted from country Health Management Information Systems Service volumes, which are reported by facilities, often with intermediary collation and aggregation by subnational health officials. Completeness of the service volume reports is defined as the number of facilities with a non-missing report each month, divided by the number of facilities which are reported at least one non-zero volume during the calendar year. Annual shifts in completeness can be due to rollout of the Health Management Information System to additional facilities, routine updates of facility master lists and changes in reporting requirements. A 40% rule-of-thumb threshold is set to be included in the disruption analysis.
Statistical analysis
We use segmented regression to analyze the interrupted time series. The post-interruption period is segmented by month to reflect the nonlinear changes in volume during this period. We use the following ordinary least squares segmented regression model with facility-level fixed effects:
 |
where  is the number of services reported to have been provided by facility
  in month
  . Subscript
  indexes the number of months since January 2018.
  is a vector of dummies for each calendar month to account for seasonality.
  ,
,  ,
,  ,
,  and
and  are dummies for the months during the pandemic. The corresponding parameters,
  , represent the differences between reported utilization and the utilization predicted by the model for the counterfactual no-pandemic scenario, based on pre-COVID trends.
  represents the facility fixed effect, and
  is an independent and identically normally distributed standard error. As HMIS data reporting and administration is hierarchical, the standard errors are clustered at the district or equivalent level. In addition to quantifying monthly changes in service volumes, we summarize the disruptions by calculating the total shortfall in services between March and July against what would have been expected without the pandemic. The stability of results to alternative specifications such as a restriction to a balanced panel of reporting facilities or the replacement of the facility fixed effect with a vector of facility characteristics is explored in the Supplementary Material. The regression model is estimated separately for each country–indicator pair.
Results
Significant reductions in service utilization are estimated in all countries for at least one service after controlling for the secular trend and seasonality between January 2018 and February 2020. Starting with outpatient department (OPD) consultations, Figure 2 shows statistically significant reductions in all countries in at least one of the months considered. Such disruptions were detected for all countries in April 2020, except Somalia where disruption was only detected in May 2020. Table 2 quantifies these reductions in OPD consultations as well for all other indicators. The largest monthly decrease is measured in Liberia, where the number of OPD consultations reported in April 2020 is 30% lower than predicted under the hypothetical no-COVID counterfactual. However, Nigeria had the largest overall reduction in OPD of 16% between March and July. The smallest reductions for the March–July period in OPD are estimated in Somalia (1%), Cameroon (4%) and DRC (4%). OPD utilization appears to have rebounded by June in Cameroon, Liberia, DRC and Somalia, while Mali, Nigeria, Malawi and Sierra Leone still experienced significant disruptions to the continuity of outpatient consultations in June and July.
Figure 2.
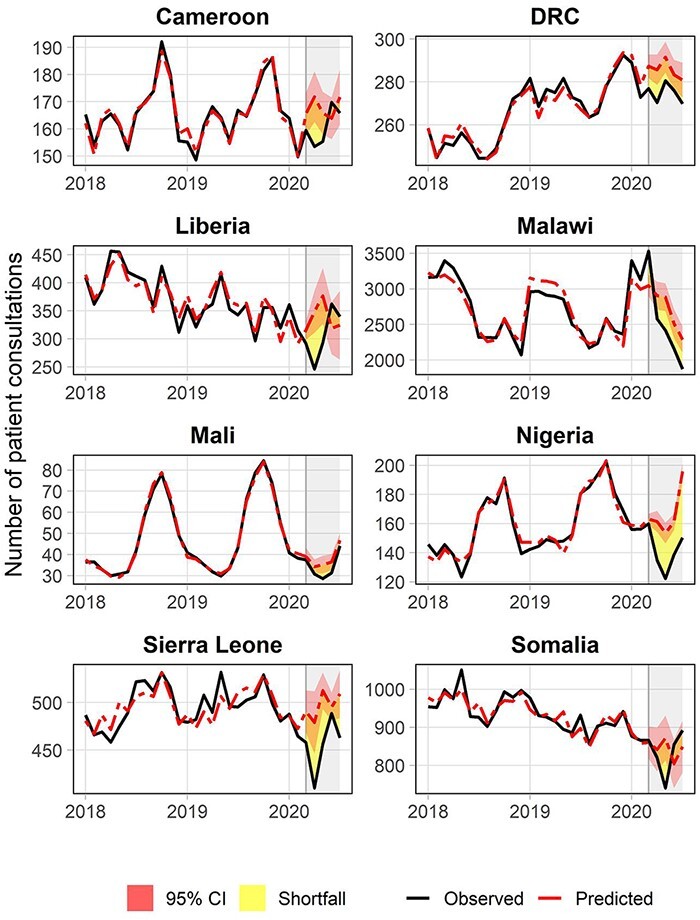
Disruptions in outpatient consultations
The figure shows the estimated disruption in service volume of outpatient consultations for eight countries. The solid black line represents the reported outpatient counts after data cleaning, and the dashed red line represents the modeled outpatient counts using pre-pandemic information. The figure also relays the 5% confidence bands around the predicted service counts to indicate the presence of a statistically significant shortfall over the pandemic period.
Table 2.
Percent decrease in service delivery level for pandemic months [β (95% CI)], by indicator and country
| Cameroon | DRC | Liberia | Malawi | ||||||
|---|---|---|---|---|---|---|---|---|---|
| Outpatient consultations | March 2020 | −2.6 | (−7.0, 1.8) | −3.7 | (−5.6, −1.7) | −7.6 | (−13.1, −2.0) | 15.8 | (10.7, 20.9) |
| April 2021 | −9.2 | (−14.9, −3.5) | −5.4 | (−8.0, −2.9) | −29.5 | (−40.5, −18.5) | −11.4 | (−18.3, −4.5) | |
| May 2020 | −4.7 | (−9.8, 0.5) | −3.8 | (−6.4, −1.3) | −22.3 | (−35.8, −8.8) | −16.2 | (−23.2, −9.3) | |
| June 2020 | 4.5 | (−0.2, 9.2) | −2.6 | (−5.2, −0.1) | 13.5 | (−1.5, 28.5) | −14.1 | (−22.5, −5.7) | |
| July 2020 | −4.2 | (−9.9, 1.6) | −4.0 | (−6.9, −1.0) | 4.6 | (−14.7, 24.0) | −18.2 | (−26.5, −9.9) | |
| Total shortfall | −3.5 | (−7.5, 0.6) | −3.9 | (−6.1, −1.7) | −9.1 | (−20.3, 2.1) | −7.9 | (−13.7, −2.0) | |
| Pentavalent 3 vaccinations | March 2020 | 0.8 | (−2.5, 4.0) | −0.3 | (−1.6, 1.1) | 0.0 | (−7.4, 7.5) | 6.1 | (−1.1, 13.4) |
| April 2021 | −0.7 | (−4.4, 3.0) | −1.7 | (−3.3, 0.0) | −33.9 | (−41.0, −26.9) | −7.8 | (−13.3, −2.3) | |
| May 2020 | −5.6 | (−10.1, −1.2) | −0.2 | (−1.8, 1.3) | −1.0 | (−11.1, 9.1) | 1.7 | (−3.7, 7.1) | |
| June 2020 | −7.9 | (−13.9, −1.9) | 0.0 | (−1.5, 1.4) | −3.5 | (−8.9, 2.0) | 3.9 | (−3.4, 11.1) | |
| July 2020 | 3.2 | (−3.2, 9.7) | 1.6 | (0.0, 3.1) | 2.4 | (−2.3, 7.1) | 2.1 | (−3.1, 7.4) | |
| Total shortfall | −2.0 | (−5.2, 1.2) | −0.1 | (−1.2, 1.0) | −7.8 | (−13.1, −2.5) | 1.2 | (−2.5, 4.9) | |
| BCG vaccinations | March 2020 | 8.7 | (5.6, 11.8) | 7.8 | (0.9, 14.7) | 4.9 | (−2.2, 12.0) | ||
| April 2021 | 2.6 | (−0.4, 5.6) | −20.4 | (−28.2, −12.5) | −0.3 | (−4.5, 3.9) | |||
| May 2020 | 0.9 | (−2.0, 3.8) | 5.8 | (−2.6, 14.3) | 8.1 | (−2.2, 18.3) | |||
| June 2020 | −5.6 | (−8.4, −2.8) | 11.0 | (3.8, 18.2) | 8.6 | (−0.8, 18.1) | |||
| July 2020 | −16.0 | (−19.1, −12.9) | 0.3 | (−6.8, 7.3) | 6.9 | (−2.1, 15.9) | |||
| Total shortfall | −1.4 | (−3.4, 0.6) | 0.3 | (−5.2, 5.8) | 5.6 | (0.5, 10.8) | |||
| Deliveries | March 2020 | 3.1 | (0.3, 5.8) | −1.4 | (−2.7, −0.2) | −2.6 | (−9.7, 4.6) | −3.1 | (−7.6, 1.4) |
| April 2021 | 3.9 | (1.2, 6.6) | −0.7 | (−1.9, 0.5) | −4.8 | (−8.8, −0.9) | −0.1 | (−4.7, 4.4) | |
| May 2020 | 1.3 | (−1.1, 3.7) | 1.0 | (−0.5, 2.5) | −2.0 | (−6.7, 2.7) | −3.1 | (−8.7, 2.6) | |
| June 2020 | 1.8 | (−1.5, 5.2) | 0.8 | (−0.6, 2.2) | 3.7 | (−0.5, 7.8) | −10.9 | (−15.7, −6.1) | |
| July 2020 | 6.9 | (3.8, 10.0) | 1.4 | (0.0, 2.8) | −3.5 | (−9.9, 2.8) | −5.7 | (−8.5, −2.9) | |
| Total shortfall | 3.3 | (1.1, 5.5) | 0.2 | (−0.9, 1.3) | −1.9 | (−6.0, 2.2) | −4.6 | (−7.8, −1.3) | |
| ANC1 attendance | March 2020 | 5.2 | (1.5, 8.8) | 0.4 | (−0.6, 1.5) | −10.2 | (−17.9, −2.5) | 9.5 | (2.0, 17.0) |
| April 2021 | 1.3 | (−1.8, 4.5) | 2.4 | (1.1, 3.8) | −16.9 | (−26.9, −6.9) | −1.7 | (−8.9, 5.5) | |
| May 2020 | −4.1 | (−7.6, −0.7) | 1.0 | (−0.2, 2.1) | −5.9 | (−11.2, −0.6) | −9.1 | (−17.0, −1.3) | |
| June 2020 | 1.6 | (−4.1, 7.2) | 4.1 | (2.8, 5.3) | 12.2 | (5.9, 18.5) | 0.4 | (−9.9, 10.7) | |
| July 2020 | −3.8 | (−7.4, −0.1) | 2.4 | (1.1, 3.7) | −6.5 | (−12.3, −0.8) | −12.7 | (−18.8, −6.6) | |
| Total shortfall | 0.0 | (−2.7, 2.8) | 2.0 | (1.1, 3.0) | −6.0 | (−10.9, −1.1) | −3.3 | (−7.9, 1.3) | |
| ANC4 attendance | March 2020 | −0.2 | (−5.3, 4.9) | 1.3 | (0.1, 2.6) | −3.4 | (−12.6, 5.8) | 24.1 | (15.3, 32.9) |
| April 2021 | 0.2 | (−6.0, 6.4) | 1.8 | (0.3, 3.2) | −17.3 | (−31.6, −2.9) | 11.1 | (4.6, 17.6) | |
| May 2020 | −7.4 | (−13.6, −1.2) | 1.7 | (0.2, 3.3) | −8.6 | (−17.8, 0.6) | 10.7 | (0.6, 20.8) | |
| June 20-20 | −3.2 | (−10.7, 4.3) | 3.0 | (1.4, 4.5) | 7.1 | (−4.3, 18.4) | 19.8 | (11.4, 28.1) | |
| July 2020 | −1.4 | (−8.5, 5.6) | 3.6 | (1.8, 5.3) | 6.5 | (−4.8, 17.7) | −1.0 | (−6.9, 4.9) | |
| Total shortfall | −2.4 | (−7.9, 3.1) | 2.3 | (1.0, 3.5) | −3.9 | (−13.2, 5.5) | 12.2 | (5.7, 18.7) | |
| Postnatal care visits | March 2020 | 7.8 | (1.5, 14.1) | −1.6 | (−2.8, −0.4) | −2.6 | (−8.9, 3.6) | −3.2 | (−14.4, 8.0) |
| April 2021 | 5.2 | (−0.8, 11.2) | −1.3 | (−2.4, −0.1) | −9.9 | (−16.5, −3.2) | −3.1 | (−16.4, 10.1) | |
| May 2020 | 3.5 | (−1.3, 8.3) | 0.4 | (−0.9, 1.7) | −0.8 | (−6.5, 4.8) | −6.8 | (−24.1, 10.5) | |
| June 2020 | 3.7 | (−3.8, 11.2) | 0.7 | (−0.7, 2.0) | −1.9 | (−8.1, 4.3) | −10.2 | (−25.4, 4.9) | |
| July 2020 | 14.7 | (7.8, 21.7) | 0.8 | (−0.7, 2.3) | −7.1 | (−13.7, −0.4) | −14.5 | (−28.2, −0.8) | |
| Total shortfall | 6.8 | (2.4, 11.3) | −0.2 | (−1.3, 0.9) | −4.5 | (−9.3, 0.3) | −7.7 | (−20.2, 4.7) | |
| Family planning consultations | March 2020 | 3.8 | (−1.1, 8.8) | −3.1 | (−21.8, 15.6) | −21.8 | (−40.8, −2.8) | ||
| April 2021 | 14.0 | (−3.6, 31.6) | −5.3 | (−24.7, 14.1) | −21.7 | (−45.7, 2.2) | |||
| May 2020 | 3.0 | (−5.7, 11.6) | 6.2 | (−16.4, 28.8) | −12.3 | (−32.0, 7.4) | |||
| June 2020 | 18.2 | (8.6, 27.7) | 42.9 | (18.7, 67.1) | −19.8 | (−37.5, −2.1) | |||
| July 2020 | 16.5 | (8.9, 24.2) | 2.9 | (−23.1, 29.0) | −9.4 | (−30.3, 11.5) | |||
| Total shortfall | 11.0 | (4.9, 17.2) | 8.2 | (−5.3, 21.7) | −17.0 | (−34.9, 0.9) | |||
| Mali | Nigeria | Sierra Leone | Somalia | ||||||
| Outpatient consultations | March 2020 | −4.0 | (−14.5, 6.6) | −2.0 | (−4.4, 0.3) | −6.7 | (−11.3, −2.0) | 0.7 | (−4.4, 5.7) |
| April 2021 | −10.3 | (−20.4, −0.1) | −16.6 | (−21.2, −12.1) | −14.4 | (−21.4, −7.5) | −2.6 | (−9.6, 4.3) | |
| May 2020 | −18.9 | (−31.0, −6.8) | −20.5 | (−25.3, −15.7) | −11.0 | (−14.8, −7.2) | −15.1 | (−22.0, −8.2) | |
| June 2020 | −14.2 | (−24.7, −3.7) | −13.9 | (−17.4, −10.4) | −1.4 | (−4.5, 1.7) | 6.2 | (−1.9, 14.3) | |
| July 2020 | −5.5 | (−13.0, 2.0) | −23.3 | (−26.6, −20.0) | −9.1 | (−14.2, −4.1) | 5.0 | (−3.2, 13.3) | |
| Total shortfall | −10.1 | (−19.1, −1.1) | −15.5 | (−18.7, −12.3) | −8.5 | (−12.2, −4.8) | −1.4 | (−7.0, 4.2) | |
| Pentavalent 3 vaccinations | March 2020 | −9.4 | (−13.0, −5.9) | −5.6 | (−7.1, −4.0) | −7.9 | (−11.8, −4.1) | −4.2 | (−11.2, 2.8) |
| April 2021 | −27.7 | (−35.5, −19.8) | −14.8 | (−16.9, −12.6) | −19.9 | (−30.0, −9.8) | −8.3 | (−18.6, 2.0) | |
| May 2020 | −24.6 | (−31.3, −17.8) | −12.5 | (−15.0, −10.0) | −16.8 | (−23.7, −9.8) | −13.3 | (−24.0, −2.7) | |
| June 2020 | −9.2 | (−14.6, −3.8) | −3.1 | (−5.2, −1.0) | −9.9 | (−16.6, −3.1) | 0.3 | (−9.1, 9.8) | |
| July 2020 | −16.5 | (−21.6, −11.4) | −9.0 | (−11.2, −6.8) | −8.7 | (−15.6, −1.8) | −1.0 | (−11.0, 8.9) | |
| Total shortfall | −17.4 | (−22.6, −12.3) | −9.0 | (−10.7, −7.3) | −12.6 | (−19.1, −6.1) | −3.6 | (−9.8, 2.6) | |
| BCG vaccinations | March 2020 | −6.1 | (−9.7, −2.5) | 0.0 | (−1.7, 1.8) | −7.9 | (−11.9, −3.9) | 2.2 | (−7.1, 11.4) |
| April 2021 | −21.5 | (−26.8, −16.1) | −8.8 | (−10.9, −6.7) | −15.7 | (−22.2, −9.3) | −1.7 | (−14.6, 11.2) | |
| May 2020 | −15.1 | (−19.9, −10.3) | −6.4 | (−9.0, −3.9) | −10.5 | (−16.3, −4.7) | −14.8 | (−25.3, −4.4) | |
| June 2020 | −2.1 | (−6.2, 2.0) | 3.0 | (0.6, 5.4) | 1.2 | (−4.0, 6.4) | 6.8 | (−3.3, 16.9) | |
| July 2020 | −14.1 | (−19.7, −8.6) | −7.7 | (−10.2, −5.3) | −3.3 | (−9.0, 2.5) | 3.6 | (−6.4, 13.5) | |
| Total shortfall | −11.8 | (−15.4, −8.2) | −4.1 | (−5.9, −2.2) | −7.4 | (−11.9, −2.9) | −2.4 | (−8.9, 4.2) | |
| Deliveries | March 2020 | −9.1 | (−13.9, −4.3) | −5.0 | (−11.2, 1.2) | −4.6 | (−7.1, −2.0) | 5.4 | (−1.0, 11.7) |
| April 2021 | −6.4 | (−11.3, −1.5) | −6.8 | (−9.9, −3.7) | −12.1 | (−19.5, −4.8) | 5.3 | (−2.8, 13.3) | |
| May 2020 | −9.0 | (−14.1, −3.8) | −11.8 | (−15.5, −8.2) | −4.5 | (−8.6, −0.5) | 0.9 | (−7.2, 9.1) | |
| June 2020 | −8.6 | (−14.8, −2.5) | −11.7 | (−15.5, −7.9) | −0.4 | (−5.8, 5.0) | 5.0 | (−2.9, 12.8) | |
| July 2020 | −8.7 | (−14.3, −3.1) | −14.2 | (−18.9, −9.6) | −1.9 | (−6.3, 2.4) | 2.6 | (−5.1, 10.3) | |
| Total shortfall | −8.3 | (−12.8, −3.9) | −9.8 | (−13.2, −6.4) | −4.8 | (−8.2, −1.4) | 2.3 | (−3.1, 7.7) | |
| ANC1 attendance | March 2020 | −7.3 | (−12.9, −1.7) | −0.2 | (−4.3, 4.0) | −1.3 | (−6.1, 3.6) | ||
| April 2021 | −17.1 | (−21.9, −12.4) | −6.0 | (−12.8, 0.7) | −4.0 | (−11.9, 3.9) | |||
| May 2020 | −18.1 | (−24.1, −12.1) | −14.5 | (−22.5, −6.6) | −11.8 | (−21.3, −2.3) | |||
| June 2020 | 5.9 | (0.9, 10.9) | 5.2 | (−2.0, 12.3) | 3.9 | (−4.0, 11.7) | |||
| July 2020 | −17.9 | (−23.7, −12.0) | −8.0 | (−18.8, 2.9) | 0.5 | (−6.7, 7.7) | |||
| Total shortfall | −11.0 | (−15.6, −6.5) | −4.9 | (−9.5, −0.3) | −3.8 | (−8.9, 1.3) | |||
| ANC4 attendance | March 2020 | −3.0 | (−7.5, 1.5) | −13.4 | (−21.4, −5.4) | −2.2 | (−6.8, 2.5) | 14.3 | (4.7, 23.8) |
| April 2021 | −7.9 | (−12.8, −2.9) | −18.0 | (−23.4, −12.5) | −3.7 | (−9.6, 2.1) | 1.1 | (−10.0, 12.1) | |
| May 2020 | −13.9 | (−18.8, −9.0) | −28.6 | (−35.2, −21.9) | −8.5 | (−14.2, −2.9) | −6.0 | (−19.2, 7.2) | |
| June 2020 | 7.5 | (1.0, 13.9) | −8.7 | (−15.4, −2.1) | −1.2 | (−7.6, 5.2) | 17.2 | (−2.5, 36.8) | |
| July 2020 | −10.0 | (−15.1, −5.0) | −22.1 | (−28.9, −15.3) | −3.9 | (−9.6, 1.7) | 4.7 | (−12.7, 22.1) | |
| Total shortfall | −5.6 | (−10.3, −1.0) | −18.1 | (−23.4, −12.8) | −3.9 | (−8.4, 0.5) | 6.2 | (−3.1, 15.4) | |
| Postnatal care visits | March 2020 | −3.1 | (−7.6, 1.3) | −7.2 | (−20.1, 5.8) | −5.0 | (−7.7, −2.2) | −5.5 | (−19.0, 7.9) |
| April 2021 | −3.4 | (−7.6, 0.8) | −14.2 | (−20.7, −7.8) | −11.9 | (−19.0, −4.9) | −2.2 | (−16.1, 11.8) | |
| May 2020 | −5.3 | (−9.5, −1.0) | −18.7 | (−26.5, −10.9) | −6.7 | (−11.4, −2.1) | −5.8 | (−19.2, 7.6) | |
| June 2020 | −1.9 | (−6.9, 3.0) | −10.8 | (−19.0, −2.6) | −0.5 | (−6.0, 4.9) | 9.3 | (−5.1, 23.7) | |
| July 2020 | −5.0 | (−8.8, −1.2) | −17.9 | (−26.1, −9.7) | −1.1 | (−4.9, 2.6) | 1.9 | (−12.8, 16.6) | |
| Total shortfall | −3.7 | (−6.8, −0.7) | −13.6 | (−21.0, −6.3) | −5.1 | (−8.9, −1.4) | 2.6 | (−7.8, 13.0) | |
| Family planning consultations | March 2020 | −9.7 | (−18.6, −0.8) | −2.4 | (−5.8, 1.0) | −1.4 | (−10.3, 7.6) | ||
| April 2021 | −13.1 | (−23.7, −2.6) | −14.9 | (−18.4, −11.3) | −7.7 | (−15.7, 0.3) | |||
| May 2020 | −20.7 | (−29.8, −11.7) | −18.0 | (−22.8, −13.2) | −9.0 | (−15.0, −2.9) | |||
| June 2020 | −12.5 | (−23.4, −1.7) | −1.0 | (−4.3, 2.3) | 0.5 | (−10.1, 11.2) | |||
| July 2020 | −25.3 | (−45.1, −5.5) | −11.5 | (−14.7, −8.2) | −5.7 | (−13.5, 2.1) | |||
| Total shortfall | −16.5 | (−26.4, −6.6) | −9.5 | (−12.2, −6.8) | −4.6 | (−10.7, 1.5) | |||
Results of the modeled monthly changes in service volumes. The regressions are run separately for each country and indicator, accounting for secular trends and seasonality, and include facility-level fixed effects. βs are transformed into % change from expected by comparing the modeled counterfactual to the observed volume. The 95% confidence interval (95% CI) is transformed in the same manner. Standard errors are clustered at the district level. The ‘total shortfall’ rows present the total percent change in the 5-month duration between March and July 2020. Missing indicators have been excluded for poor data completeness or unavailability in the data source.
Among other services considered, child vaccination had the largest declines in several countries. As shown in Table 2, the number of children who received the third dose of the pentavalent vaccine dropped for at least 1 month in all countries apart from DRC. For the other countries, the cumulative reduction in the March–July period ranged from 2% in Cameroon to 17% in Mali. The largest disruptions were in April and May. In Mali, Nigeria and Sierra Leone, some disruptions have also continued in June and July. For Liberia and Somalia, the numbers of vaccinated children are not significantly different from the pre-COVID levels by June. However, we do not observe subsequent significant positive increases that would suggest a catch-up from the earlier vaccination reductions in five of the eight countries where the overall 5-month decline is significantly below zero. The number of BCG vaccinations administered shows a similar pattern but with smaller reductions on average, with three of seven countries reporting a significant shortfall in total BCG vaccinations delivered.
Disruptions in reproductive and maternal health services are more context-dependent than vaccination or OPD services. Significant reductions in the number of institutional deliveries were estimated for five countries. The number of deliveries reduced by 5% in Liberia in April. Malawi, Mali, Nigeria and Sierra Leone experienced larger and more persistent reductions. Significant disruptions in antenatal care were detected in seven of the countries. There were also significant monthly reductions in the number of women initiating antenatal care in six countries and the number of women attending their fourth antenatal care visit in five countries. Large and persistent reductions are estimated in Nigeria for antenatal care (ANC) initiation, with a reduction between 17% and 18% in April, May and July in first antenatal care attendance. Even larger reductions are detected in the attendance of the fourth antenatal care visit. In June, a significant and positive change is estimated for the attendance of the first antenatal care visit. A similar pattern is observed in Mali for the total number of antenatal visits. Our model estimates reductions in the number of postnatal care visits in seven countries, with statistically significant coefficients in six. Significant monthly reductions in family planning consultations are estimated in four countries. Mali experienced the largest and most persistent disruptions. The number of consultations reduced by 10–25% each month between March and July, with a cumulative reduction of 17% in the 5 months.
The results of various robustness checks are provided in the Supplementary Material. The checks presented in Supplementary Figure S2 and Supplementary Table S4 suggest data processing decisions do not drive the identified disruptions. The corrections for missing observations resulted in small changes in parameter values and significance levels. Correcting for outliers changed results in a negligible proportion of indicator–month pairs, and data entry errors influence the estimates affected by this correction. The checks presented in Supplementary Table S5 show results from alternative regression model specifications. As a first alternative, we employ a model without facility-level fixed effect but with controls for facility type and first administrative level. In a second alternative specification, we restrict the data to a balanced panel of facilities that consistently reported from January 2018 to July 2020 and apply a serial autocorrelation standard error term. While some coefficients change between the specifications, the overall findings and interpretation remain the same.
Discussion
Concerns about health systems’ ability to maintain essential health services in developing countries during the COVID-19 pandemic are justified. Accounting for pre-pandemic utilization trends, seasonality and time-invariant facility characteristics, we estimate significant reductions in critical services in the eight countries studied. The most substantial and consistent disruptions were reported for outpatient consultations and child vaccinations. Although reductions in the volume of reproductive and maternal service utilization were also detected, these disruptions are not the same across all settings. Significant declines in the number of deliveries were estimated for five out of the eight countries, and antenatal care disruptions were detected in seven countries for at least 1 month.
These findings highlight variation in the duration and types of services interrupted across the contexts studied. Outpatient consultation was the sole indicator with a reduction in all countries, suggesting that utilization of general health services was less affected by country-specific mechanisms than by widespread effects such as fear of transmission. Regarding maternal and child health specifically, there were limited disruptions in services in Cameroon, DRC and Somalia, concentrated in April and May. On the other hand, Liberia, Mali, Nigeria and Sierra Leone experienced sustained disruptions for a wider range of services. The cross-country variation in effect might be due to differences in epidemic paths (both true and perceived), the resilience and structure of health systems, prior experiences with epidemics and movement restrictions imposed to control the pandemic. Differences in indicator definition in the administrative data systems could also drive effect heterogeneity between countries.
Our findings also highlight variation across types of services. In part, the pandemic may differentially impact the demand for different types of services. In surveys with women at risk of unintended pregnancy in Burkina Faso and Kenya, a small share of the sample stated that COVID-19-related reasons affected the non-use of family planning methods (Karp et al., 2021). On the other hand, pregnant women in Ethiopia reported anxiety about COVID-19 infection and restrictions by government mitigation measures as factors that reduce utilization of antenatal care services (Hailemariam et al., 2021). The pandemic may also differentially impact the ability to deliver different services. Vaccination services, relying to a larger extent on outreach campaigns relative to other services, are likely to have been more impacted by activity restrictions introduced to mitigate the virus’s spread. The variations in disruptions across services are consistent with findings from other settings. In South Africa, for example, primary care clinics providing human immunodeficiency virus (HIV) care maintained antiretroviral therapy (ART) provision but saw reductions in HIV testing and initiation of ART (Dorward et al., 2021).
The variation in the patterns of service disruptions in the eight sub-Saharan African countries we study limits our ability to draw general lessons for the broader region. Our findings suggest that the COVID-19 pandemic impacted continuity of essential health services in all countries but that the extent and duration of the disruptions and types of services impacted were context-dependent. The results of our analysis, however, align with studies from other countries, such as Ethiopia, Kenya and South Africa, that also report nuanced changes in select service volumes (Shikuku et al., 2020; Siedner et al., 2020; Workicho et al., 2021). Our results from the first 5 months of the pandemic capture the initial picture of service utilization changes due to the COVID-19 pandemic. Although the most stringent government responses were in place during the first few months of the pandemic (Hale et al., 2021), six out of the eight countries experienced periods with higher numbers of daily new cases of COVID-19 after July 2020 (Dong et al., 2020). The stronger second wave of cases may have resulted in larger disruptions, or the relaxation of lockdown policies and movement restrictions, together with additional time to adapt service delivery, may aid health systems’ ability to maintain continuity of health services.
The use of administrative data to quantify health services disruptions during a pandemic affords timely monitoring and allows benchmarking utilization rates to several years of pre-pandemic data. However, the results should be interpreted with some caveats. First, data completeness is lower during the pandemic in some countries. Although typical delays might explain some of the reporting shortfall, we cannot rule out the pandemic affected the reporting and processing of the data by the strained health systems. We expect this effect to be limited, as the magnitude of the decline in reporting is small. Second, reporting to HMIS in sub-Saharan Africa is still frequently paper-based and contains reporting errors. We correct for probable outliers and show our data processing approaches do not drive the findings. However, we cannot rule out other types of reporting errors. Third, although these systems are intended to be comprehensive, HMIS often includes missing reports, and non-public facilities might not be required to report into the system. Although private-sector health utilization is relatively low in sub-Saharan Africa (Dennis et al., 2018), our results provide only a partial picture, particularly in contexts with multiple service delivery pathways. There might be an increasing preference for utilizing private care, informal or community-based providers less burdened by pandemic-associated care. These shifts may not be captured by the HMIS, resulting in an overestimation of the disruptions. Finally, disruptions to service delivery could also be in the form of lower quality of care, which would not be detected in HMIS data analysis.
Our findings suggest that it is critical to reinforce standard interventions for utilization gaps (e.g. outreach programs, client incentives, strengthening of the supply chain or health workforce investments) with innovative modifications that include the encouragement of catch-up visits where appropriate, investments in infection prevention and control, and context-specific messaging. These interventions will remain critical for health services that have recovered to pre-pandemic levels but have not yet rebounded to account for the total lost health system outputs. This attention is especially important for maternal and child health services, given the narrow window of opportunity to provide these services. Delayed action can lead to a higher incidence of disease and long-term health effects in the population, as seen in the higher incidence of malaria and measles following the 2013–16 Ebola epidemic (Dunbar et al., 2017; Wesseh et al., 2017).
Designing a public health response to the observed service decline requires mapping the specific causes driving changes in essential services utilization. The COVID pandemic’s scope presents added difficulties by long-lasting lockdown policies that restrict movement and magnify financial pressures, which reduce the ability to pay for medical services. The analysis presented in this study should be seen as a first step in characterizing service disruptions. Disentangling the potential casual pathways behind observed disruptions requires further contextual knowledge and additional data collection of supply and demand-side factors. Targeted facility or household surveys can indicate the primary causes of disruptions to inform public health interventions and investments and uncover pockets of disruption possibly masked by reporting aggregation. Potential instances of service disruptions should also be disaggregated to explore effect heterogeneity by specific populations, regions or types of health facilities and thus better inform a public health response.
Supplementary Material
Acknowledgements
We gratefully acknowledge the contributions of John Borrazzo, Alain-Desire Karibwami, Supriya Madhavan and Isidore Sieleunou from the GFF secretariat and GFF liaison officers Jean Christian Youmba, Marie Louise Mbula, Freddy Essimbi Onana Essomba, Mardieh Dennis, Pius Masauko Nakoma, Mamadou Namory Traoré and Umma Yaradua for facilitating data collection and interpretation. We also acknowledge the contributions of Chris Rilling for data processing. We also acknowledge the excellent support provided by Chris Rilling as a research assistant. The findings, interpretations and conclusions expressed in this paper are entirely those of the authors and do not necessarily represent the views of the World Bank, its executive directors and the governments of the countries they represent.
Endnotes
The Government Response Stringency Index is constructed from nine response indicators such as travel bans, stay-at-home orders and workplace closures. DRC, Liberia, Nigeria and Sierra Leone peak scores were 81, 88, 86 and 89 out of 100. Mali and Cameroon scored 72 and 71. Malawi and Somalia scored 64 and 60 (www.bsg.ox.ac.uk/research/research-projects/coronavirus-government-response-tracker).
Contributor Information
Gil Shapira, Development Research Group, The World Bank, 1818 H St NW, Washington, DC 20433, USA.
Tashrik Ahmed, Development Research Group, The World Bank, 1818 H St NW, Washington, DC 20433, USA.
Salomé Henriette Paulette Drouard, Development Research Group, The World Bank, 1818 H St NW, Washington, DC 20433, USA.
Pablo Amor Fernandez, Development Research Group, The World Bank, 1818 H St NW, Washington, DC 20433, USA.
Eeshani Kandpal, Development Research Group, The World Bank, 1818 H St NW, Washington, DC 20433, USA.
Charles Nzelu, Nigeria Federal Ministry of Health, Federal Secretariat Complex, Phase III, Shehu Shagari Way, Central Business District, Abuja, Nigeria.
Chea Sanford Wesseh, Liberia Ministry of Health, SKD Blvd, Liberia.
Nur Ali Mohamud, Somalia Ministry of Health, Corso Somalia, Mogadishu, Somalia.
Francis Smart, Sierra Leone Ministry of Health and Sanitation, Wilkinson Road, Freetown, Sierra Leone.
Charles Mwansambo, Malawi Ministry of Health, Capital Hill Circle, Lilongwe, Malawi.
Martina L Baye, Cameroun Ministére de la Sante Publiqué, Ave Marchand, Yaoundé, Cameroon.
Mamatou Diabate, Ministère de la Santé et de l’Hygiène Publique du Mali, Cité Administrative Bamako, Bamako BP 232, Mali.
Sylvain Yuma, Republique Democratique du Congo Ministére de la Sante, Boulevard du 30 juin #4310, Commune de la Gombe B.P. 3088 Kinshasa/Gombe, République Démocratique du Congo.
Munirat Ogunlayi, The Global Financing Facility for Women, Children, and Adolescents, 1818 H ST NW, Washington, DC, 204333, USA.
Rwema Jean De Dieu Rusatira, The Global Financing Facility for Women, Children, and Adolescents, 1818 H ST NW, Washington, DC, 204333, USA.
Tawab Hashemi, The Global Financing Facility for Women, Children, and Adolescents, 1818 H ST NW, Washington, DC, 204333, USA.
Petra Vergeer, The Global Financing Facility for Women, Children, and Adolescents, 1818 H ST NW, Washington, DC, 204333, USA.
Jed Friedman, Development Research Group, The World Bank, 1818 H St NW, Washington, DC 20433, USA.
Supplementary data
Supplementary data are available at Health Policy and Planning online.
Data availability statement
The data underlying this article were provided by the ministries of health of the eight countries participating in the analysis. The data will be shared on reasonable request to the corresponding author with permission of the eight ministries.
Funding
This work was supported by the Global Financing Facility for Women, Children, and Adolescents (GFF). This analysis is part of a broader effort by GFF to support its 36 partner countries with financial and technical assistance to protect and promote the continuation of essential health services for women, children, and adolescents during COVID-19. Staff from the GFF Secretariat were involved in the conceptualization of this project, validating the results and reviewing the final manuscript.
Ethical approval
Ethical approval for this type of study is not required by our institutes.
Conflict of interest statement
No conflict of interest.
References
- Abbas K, Simon RP, Kevin van Z. et al. 2020. Routine childhood immunisation during the COVID-19 pandemic in Africa: a benefit–risk analysis of health benefits versus excess risk of SARS-CoV-2 infection. The Lancet Global Health 8: e1264–72.doi: 10.1016/S2214-109X(20)30308-9. [DOI] [PMC free article] [PubMed] [Google Scholar]
- Buonsenso D, Bianca C, Memenatu NK, Francesco I. 2020. Child healthcare and immunizations in sub-Saharan Africa during the COVID-19 pandemic. Frontiers in Pediatrics 8: 517.doi: 10.3389/fped.2020.00517. [DOI] [PMC free article] [PubMed] [Google Scholar]
- Chandir S, Danya AS, Mariam M et al. 2020. Impact of COVID-19 pandemic response on uptake of routine immunizations in Sindh, Pakistan: an analysis of provincial electronic immunization registry data. Vaccine 38: 7146–55.doi: 10.1016/j.vaccine.2020.08.019. [DOI] [PMC free article] [PubMed] [Google Scholar]
- Chang HJ, Nicole H, Cheng-Hua L et al. 2004. The impact of the SARS epidemic on the utilization of medical services: SARS and the fear of SARS. American Journal of Public Health 94: 562–4.doi: 10.2105/AJPH.94.4.562. [DOI] [PMC free article] [PubMed] [Google Scholar]
- Dennis ML, Lenka B, Onikepe OO, Oona MRC. 2018. Meeting need vs. sharing the market: a systematic review of methods to measure the use of private sector family planning and childbirth services in sub-Saharan Africa. BMC Health Services Research 18: 1–13.doi: 10.1186/s12913-018-3514-y. [DOI] [PMC free article] [PubMed] [Google Scholar]
- Dong E, Du H, Gardner L. 2020. An interactive web-based dashboard to track COVID-19 in real time. The Lancet Infectious Diseases 20: 533–4.doi: 10.1016/S1473-3099(20)30120-1. [DOI] [PMC free article] [PubMed] [Google Scholar]
- Dorward J, Thokozani K, Kelly G et al. 2021. The impact of the COVID-19 lockdown on HIV care in 65 South African primary care clinics: an interrupted time series analysis. The Lancet HIV 8: e158–65.doi: 10.1016/s2352-3018(20)30359-3. [DOI] [PMC free article] [PubMed] [Google Scholar]
- Dunbar NK, Richards EE, Woldeyohannes D et al. 2017. Knockdown and recovery of malaria diagnosis and treatment in Liberia during and after the 2014 Ebola outbreak. Public Health Action 7: S76–81.doi: 10.5588/pha.16.0100. [DOI] [PMC free article] [PubMed] [Google Scholar]
- Fei H, Xia Y, Chen H et al. 2020. The impact of the COVID-19 epidemic on tuberculosis control in China. The Lancet Regional Health - Western Pacific 3: 100032.doi: 10.1016/j.lanwpc.2020.100032. [DOI] [PMC free article] [PubMed] [Google Scholar]
- Hailemariam S, Agegnehu W, Derese M. 2021. Exploring COVID-19 related factors influencing antenatal care services uptake: a qualitative study among women in a rural community in Southwest Ethiopia. Journal of Primary Care and Community Health 12: 2150132721996892.doi: 10.1177/2150132721996892. [DOI] [PMC free article] [PubMed] [Google Scholar]
- Hale T, Noam A, Rafael G et al. 2021. A global panel database of pandemic policies (Oxford COVID-19 Government Response Tracker). Nature Human Behaviour 5: 529–38.doi: 10.1038/s41562-021-01079-8. [DOI] [PubMed] [Google Scholar]
- Hogan AB, Britta LJ, Ellie S-S et al. 2020. Potential impact of the COVID-19 pandemic on HIV, tuberculosis, and malaria in low-income and middle-income countries: a modelling study. The Lancet Global Health 8: e1132–41.doi: 10.1016/S2214-109X(20)30288-6. [DOI] [PMC free article] [PubMed] [Google Scholar]
- Iyengar P, Kate K, Cuallah JH, Bernice D. 2015. Services for mothers and newborns during the Ebola outbreak in Liberia: the need for improvement in emergencies. PLoS Currents 7: 1–5.doi: 10.1371/currents.outbreaks.4ba318308719ac86fbef91f8e56cb66f. [DOI] [PMC free article] [PubMed] [Google Scholar]
- Jewell BL, Edinah M, John S et al. 2020. Potential effects of disruption to HIV programmes in sub-Saharan Africa caused by COVID-19: results from multiple mathematical models. The Lancet HIV 7: e629–40.doi: 10.1016/S2352-3018(20)30211-3. [DOI] [PMC free article] [PubMed] [Google Scholar]
- Jones SA, Somasundari G, Charles AA, Sarah W, Nynke RVDB 2016. “Women and babies are dying but not of Ebola”: the effect of the Ebola virus epidemic on the availability, uptake and outcomes of maternal and newborn health services in Sierra Leone. BMJ Global Health 1: e000065.doi: 10.1136/bmjgh-2016-000065. [DOI] [PMC free article] [PubMed] [Google Scholar]
- Karp C, Shannon NW, Georges G et al. 2021. Contraceptive dynamics during COVID-19 in sub-Saharan Africa: longitudinal evidence from Burkina Faso and Kenya. BMJ Sexual and Reproductive Health. 10.1136/bmjsrh-2020-200944. [DOI] [PMC free article] [PubMed] [Google Scholar]
- Lemoine M, Jin UK, Gibril N et al. 2020. Effect of the COVID-19 pandemic on viral hepatitis services in sub-Saharan Africa. The Lancet Gastroenterology and Hepatology 5: 966–7.doi: 10.1016/S2468-1253(20)30305-8. [DOI] [PMC free article] [PubMed] [Google Scholar]
- Lori JR, Sarah DR, Joseph EP et al. 2015. A case series study on the effect of Ebola on facility-based deliveries in rural Liberia. BMC Pregnancy and Childbirth 15: 1–6.doi: 10.1186/s12884-015-0694-x. [DOI] [PMC free article] [PubMed] [Google Scholar]
- Ly J, Vidiya S, Thomas G et al. 2016. Facility-based delivery during the Ebola virus disease epidemic in rural Liberia: analysis from a cross-sectional, population-based household survey. PLoS Medicine 13: e1002096.doi: 10.1371/journal.pmed.1002096. [DOI] [PMC free article] [PubMed] [Google Scholar]
- Masresha BG, Richard L Jr, Goitom W et al. 2020. The impact of a prolonged Ebola outbreak on measles elimination activities in Guinea, Liberia and Sierra Leone, 2014–2015. The Pan African Medical Journal 35: 8.doi: 10.11604/pamj.supp.2020.35.1.19059. [DOI] [PMC free article] [PubMed] [Google Scholar]
- Quaglio G, Francesca T, Livio F et al. 2019. Impact of Ebola outbreak on reproductive health services in a rural district of Sierra Leone: a prospective observational study. BMJ Open 9: e029093.doi: 10.1136/bmjopen-2019-029093. [DOI] [PMC free article] [PubMed] [Google Scholar]
- Ribacke KJB,Dell DS, Anneli E, Johan VS. 2016. Effects of the West Africa Ebola virus disease on health-care utilization - a systematic review. Frontiers in Public Health 4: 222.doi: 10.3389/FPUBH.2016.00222. [DOI] [PMC free article] [PubMed] [Google Scholar]
- Roberton T, Emily DC, Victoria BC et al. 2020. Early estimates of the indirect effects of the COVID-19 pandemic on maternal and child mortality in low-income and middle-income countries: a modelling study. The Lancet Global Health 8: e901–8.doi: 10.1016/S2214-109X(20)30229-1. [DOI] [PMC free article] [PubMed] [Google Scholar]
- Saso A,Skirrow H, Kampmann B. 2020. Impact of COVID-19 on immunization services for maternal and infant vaccines: results of a survey conducted by imprint—the immunising pregnant women and infants network. Vaccines 8: 1–15.doi: 10.3390/vaccines8030556. [DOI] [PMC free article] [PubMed] [Google Scholar]
- Sesay T, Denisiuk O, Shringarpure KK et al. 2017. Paediatric care in relation to the 2014–2015 Ebola outbreak and general reporting of deaths in Sierra Leone. Public Health Action 7: 34–9.doi: 10.5588/pha.16.0088. [DOI] [PMC free article] [PubMed] [Google Scholar]
- Sherrard-Smith E, Alexandra BH, Arran H et al. 2020. The potential public health consequences of COVID-19 on malaria in Africa. Nature Medicine 26: 1411–6.doi: 10.1038/s41591-020-1025-y. [DOI] [PMC free article] [PubMed] [Google Scholar]
- Shikuku D, Irene N, Sylvia G et al. 2020. Early indirect impact of COVID-19 pandemic on utilization and outcomes of reproductive, maternal, newborn, child and adolescent health services in Kenya. medRxiv 2020.09.09.20191247.doi: 10.1101/2020.09.09.20191247. [DOI] [PubMed] [Google Scholar]
- Siedner MJ, John DK, Mark JM et al. 2020. Access to primary healthcare during lockdown measures for COVID-19 in rural South Africa: an interrupted time series analysis. BMJ Open 10: e043763.doi: 10.1136/bmjopen-2020-043763. [DOI] [PMC free article] [PubMed] [Google Scholar]
- Siwatu GO, Amparo P-L, Kevin RM et al. 2020. Impact of COVID-19 on Nigerian Households: Baseline Results (English), Monitoring COVID-19 Impacts on Households in Nigeria. Washington, DC: World Bank.doi: 10.1596/34768. [DOI] [Google Scholar]
- Sochas L, Channon AA, Nam S. 2017. Counting indirect crisis-related deaths in the context of a low-resilience health system: the case of maternal and neonatal health during the Ebola epidemic in Sierra Leone. Health Policy and Planning 32: iii32–9.doi: 10.1093/heapol/czx108. [DOI] [PubMed] [Google Scholar]
- Wagenaar BH, Orvalho A, Jason B et al. 2018. The 2014–2015 Ebola virus disease outbreak and primary healthcare delivery in Liberia: time-series analyses for 2010–2016. PLoS Medicine 15: e1002508.doi: 10.1371/journal.pmed.1002508. [DOI] [PMC free article] [PubMed] [Google Scholar]
- Wesseh CS, Najjemba R, Edwards JK, Owiti P, Tweya H, Bhat P. 2017. Did the Ebola outbreak disrupt immunisation services? A case study from Liberia. Public Health Action 7: S82–7.doi: 10.5588/pha.16.0104. [DOI] [PMC free article] [PubMed] [Google Scholar]
- Wilhelm JA, Helleringer S. 2019. Utilization of non-Ebola health care services during Ebola outbreaks: a systematic review and meta-analysis. Journal of Global Health 9: 1.doi: 10.7189/jogh.09.010406. [DOI] [PMC free article] [PubMed] [Google Scholar]
- Workicho A, Meghan JK, Lioul B, Mebit K, Eileen K. 2021. Essential health and nutrition service provision during the COVID-19 pandemic: lessons from select Ethiopian Woredas. Current Developments in Nutrition 5: nzab024.doi: 10.1093/cdn/nzab024. [DOI] [PMC free article] [PubMed] [Google Scholar]
- World Health Organization . 2017. Data Quality Review: A Toolkit for Facility Data Quality Assessment. Module 2. Desk Review of Data Quality. Geneva. https://apps.who.int/iris/handle/10665/259225, accessed 1 June 2021. [Google Scholar]
- World Health Organization . 2020. Pulse Survey on Continuity of Essential Health Services During the COVID-19 Pandemic. https://www.who.int/publications/i/item/WHO-2019-nCoV-EHS_continuity-survey-2020.1, accessed 1 June 2021.
Associated Data
This section collects any data citations, data availability statements, or supplementary materials included in this article.
Supplementary Materials
Data Availability Statement
The data underlying this article were provided by the ministries of health of the eight countries participating in the analysis. The data will be shared on reasonable request to the corresponding author with permission of the eight ministries.