Figure 2.

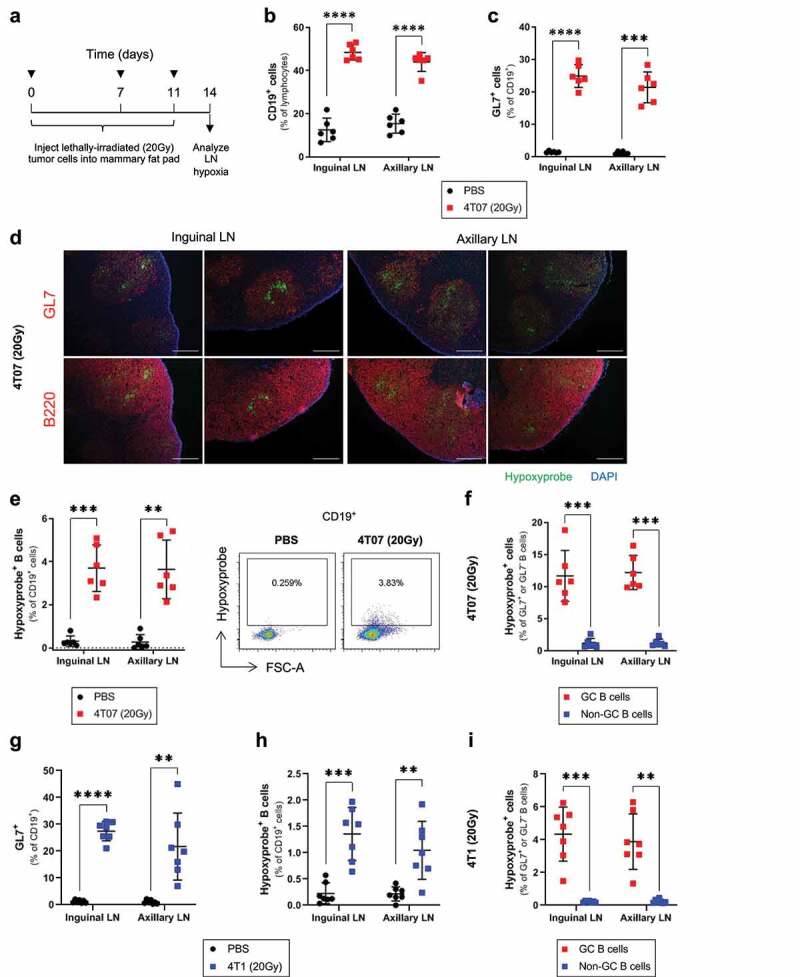
Injection of lethally irradiated tumor cells is sufficient to induce GC hypoxia
(a) Injection schedule used to expose mice to tumor cells irradiated in vitro (20 Gy). (b) Flow cytometry data evaluating the frequency of B cells (CD19+, % of lymphocytes) and (c) GC (GL7+) B cells (% of CD19+) in inguinal and axillary LNs of mice injected with lethally irradiated 4T07 tumor cells, or PBS controls; n = 6/group. (d) Immunofluorescence microscopy on sections of frozen inguinal and axillary LNs of mice injected with lethally irradiated 4T07 cells, and stained for GCs (GL7), B cells (B220), hypoxia (Hypoxyprobe), and nuclear counterstain (DAPI). Scale bar = 100 μm. (e) Frequency of Hypoxyprobe+ B cells (% of CD19+) in inguinal and axillary LNs draining lethally irradiated 4T07 tumor cells, or PBS controls (n = 6/group). (f) Frequency of Hypoxyprobe+ cells in the GC (CD19+GL7+) and non-GC (CD19+GL7−) B cells of LNs draining lethally irradiated 4T07 tumors (n = 6/group). (g) Frequency of GC (GL7+) B cells (% of CD19+) and (h) Hypoxyprobe+ B cells (% of CD19+) in inguinal and axillary LNs of mice injected with lethally irradiated 4T1 tumor cells, or PBS controls; n = 7/group. (i) Frequency of Hypoxyprobe+ cells in the GC (CD19+GL7+) and non-GC (CD19+GL7−) B cells of LNs draining lethally irradiated 4T1 tumors (n = 7/group). Two-tailed Student’s t-test was used to assess statistical significance between groups in (B), (C), (E), (G), and (H) with Welch’s correction applied to groups with unequal variances. Paired t-test was used in (F) and (I). Data are mean ± SD.
