ABSTRACT
The role of lncRNA HCP5 in esophageal squamous cell carcinoma (ESCC) remains unknown despite its involvement in different malignancies. MTT assay, EdU assay, TUNEL assay, transwell assay, and sphere formation assay were conducted to reveal ESCC cell viability, proliferation, apoptosis, migration, invasion, and stemness characteristics. FISH and subcellular fraction assays were performed to reveal the subcellular location of HCP5 in ESCC cells. Luciferase reporter assay and RIP assay were conducted to explore the downstream axis of HCP5. Our findings revealed that HCP5 expression was at a higher level in ESCC tissues and cells compared to that in control tissues and cells. Additionally, HCP5 promoted ESCC cellular activities by promoting proliferation, migration, invasion ability and stemness characteristics of ESCC cells as well as suppressing cell apoptosis. Furthermore, we found that HCP5 bound with miR-139-5p to upregulate PDE4A via the competing endogenous RNA network in ESCC cells. Importantly, HCP5 was discovered to stimulate the PI3K/AKT/mTOR signaling by regulating the downstream target genes. Finally, rescue assays indicated that HCP5 promoted ESCC cell growth by activating the PDE4A-medaited PI3K/AKT/mTOR pathway. HCP5 promotes ESCC cellular development by modulating the miR-139-5p/PDE4A pathway and stimulating the PI3K/AKT/mTOR signaling pathway, which may be conducive for the improvement of ESCC treatment.
KEYWORDS: HCP5, miR-139-5p, PDE4A, ESCC, proliferation, stemness characteristics
Introduction
As a main subtype of esophageal cancer, esophageal squamous cell carcinoma (ESCC) is one of the most prevalent cancers and is the primary cause of cancer-related death globally characterized by high aggressiveness and dismal prognosis [1,2]. In recent decades, the applications of new technologies and neoadjuvant therapy improve the survival of patients with ESCC. Esophagectomy is commonly used for treatment of advanced ESCC, and the 5-year survival rates of ESCC patients remain unfavorable due to its postoperative relapse [3]. Thus, to explore the biomarkers and molecular regulatory mechanisms underlying ESCC is crucially important for ESCC diagnosis and treatment.
Long noncoding RNAs (lncRNAs) are longer than 200 nucleotides in length with no protein coding capacity [4]. They act as essential players in the pathological progression of ESCC [5]. For instance, FAM83H-AS1 promotes the development of triple-negative breast cancer via the upregulation of MTDH [6]. LncRNA PVT1 promotes colorectal cancer cell malignant behaviors such as proliferation and invasion via miR-214-3p downregulation [7]. LncRNA HAND2-AS1 inhibits the proliferation, migration of ESCC cells by sponging miR-21 [8]. As a tumor promoter, lncRNA histocompatibility leukocyte antigen complex P5 (HCP5) contributes to anaplastic thyroid cancer progression by regulating miR-128-3p [9]. HCP5 facilitates prostate cancer cell growth by interacting with miR-4656 to elevate CEMIP expression levels [10]. HCP5 modulates the miR-139-5p/ZEB1 axis to promote the epithelial–mesenchymal transition process in colorectal cancer [11]. Through GEPIA website, we found that HCP5 exhibited a higher level in esophageal carcinoma tissues compared to that in nontumor tissues, while the underlying mechanism of HCP5 in ESCC remains unclear.
The purpose of our work was to probe into the specific function and the underlying mechanism of HCP5 in ESCC development. HCP5 was hypothesized to be a ceRNA and its effects in regulating ESCC cellular processes were explored, which may expand the knowledge in ESCC pathogenesis.
Methods
Tissue collection and cell culture
Sixty-two paired ESCC tissues and adjacent non-tumor tissues were collected from 62 ESCC patients at the Harbin Medical University Cancer Hospital (Heilongjiang, China). Before surgery, no patients received anti-tumor therapies and all patients have signed the written informed consents. The study was approved by the Ethics Committee of Harbin Medical University Cancer Hospital. ESCC tissue samples were immediately frozen in liquid nitrogen and preserved at −80°C after collection. The normal esophageal epithelial cell-line HEEpiC and four ESCC cell lines (KYSE30, TE1, EC9706, EC109) were purchased from Chinese Academy of Sciences Cell Bank (Shanghai, China) and incubated in DMEM (Gibco, Rockville, MD) with 10% fetal bovine serum (FBS; Invitrogen) in humidified conditions at 37°C with 5% CO2. In addition, the PI3K activator, 740 Y-P (50 μg/mL), which was commercially obtained from TocrisBioscience (Ellisville, MO, USA), was further used to treat the transfected KYSE30 cell lines.
Cell transfection
sh-HCP5#1 or sh-HCP5#2 was transfected into KYSE30 and EC109 cells to knock down HCP5 with sh-NC as a negative control. PDE4A or HCP5 was overexpressed by pcDNA3.1/PDE4A or pcDNA3.1/HCP5 with empty pcDNA3.1 vector as a negative control. MiR-139-5p mimics or inhibitor was synthesized for overexpression or downregulation of miR-139-5p and NC mimics/inhibitor was used as a negative control. All vectors were provided by Invitrogen company and then transfected into ESCC cells by Lipofectamine 2000 (Invitrogen) for 48 hours.
Quantitative real-time polymerase chain reaction (qRT-PCR)
The RNA in ESCC cells or tissues was extracted by TRIzol reagent (Invitrogen). The RevertAid First Strand cDNA Synthesis Kit (Thermo Fisher) or PureLink™ miRNA Isolation Kit (Invitrogen) were used to synthesize complementary DNAs. Later, qRT-PCR was conducted using SYBR Premix DimerEraser (TaKaRa, Komatsu, Japan) on the ABI PRISM 7300 Sequence Detection system (Applied Biosystems, Foster City, CA, USA). The 2−ΔΔCt method was applied to calculate gene expression normalized to GAPDH and U6. The primer sequences are as follows:
HCP5:
F: 5ʹ-GACTGAGATGCAAGTGTGC-3ʹ,
R: 5ʹ-CAAAGCAGGACCATTCCTG-3ʹ;
MiR-139-5p:
F: 5ʹ-TCTACAGTGCACGTGTCTCCAG-3ʹ,
R: 5ʹ-CTCTACAGCTATATTGCCAGCCAC-3ʹ;
PDE4A:
F: 5ʹ-CAACACCAATTCGGAGCTG-3ʹ,
R: 5ʹ-AGATGTCGCAGTTGTCCTC-3ʹ;
GAPDH:
F: 5ʹ-TCATTTCCTGGTATGACAACGA-3ʹ,
R: 5ʹ-GTCTTACTCCTTGGAGGCC-3ʹ;
U6:
F: 5ʹ-TGCTATCACTTCAGCAGCA-3ʹ,
R: 5ʹ-GAGGTCATGCTAATCTTCTCTG-3ʹ.
Western blot analysis
RIPA lysis buffer was used to isolate total proteins from KYSE30 and EC109 cells. Next, a BCA Protein Assay Kit (Thermo Fisher) was used for protein quantification. Subsequently, the proteins were loaded on 10% sodium dodecyl sulfate polyacrylamide gel electrophoresis gel and subsequently transferred onto polyvinylidene fluoride membranes (Millipore, USA). After being blocked with 5% defatted milk for 1 hour at ambient temperature, the membranes were incubated with the primary antibodies purchased from Abcam company (Shanghai, China) at 4°C overnight with GAPDH as an internal control. Subsequently, these membranes were incubated with the secondary antibodies at 37°C for 1 hour. Thereafter, the enhanced chemiluminescence reagents (Millipore, Plano, TX, USA) were used for visualization of the protein bands which were quantified by Bio-Rad ChemiDoc XRS+ System.
3-(4,5)-dimethylthiahiazo(−2)-3,5-diphenyl tetrazolium bromide (MTT) assay
The ESCC cells after indicated transfection were cultured in 96-well plates. After incubation for 0, 24, 48 and 72 hours, each well was added with 20 μL of MTT solution (Dojindo, Japan). Four hours later, DMSO (Solarbio, 200 μL) was used to dissolve formazan crystal, and absorbance of ESCC cells at 490 nm was determined with a microplate reader (Thermo Fisher).
5-ethynyl-2ʹ-deoxyuridine (EdU) assay
An EdU Detection Kit (Ribobio, Guangzhou, China) was used for cell proliferation analysis. The cells were cultivated in 96-well plates for 48 hours, and then incubated with 50 μM EdU labeling medium for 2 hours under 37°C. After being treated with 4% paraformaldehyde and 0.5% Triton X-100, the ESCC cells were dyed with 100 μL of DAPI solution (Beyotime) for 30 minutes at room temperature and then observed under an FSX100 fluorescence microscope (Olympus, Beijing, China).
Terminal deoxynucleotidyl transferase-mediated dUTP-biotin nick end labeling (TUNEL) assay
Cell apoptosis was evaluated with an in situ Apoptosis Detection Kit (Takara, Dalian, China). The cells were fixed by paraformaldehyde, permeabilized by Triton X-100 and incubated for 1 hour with TUNEL reaction mixture (Takara). The cell nuclei were stained by DAPI (Beyotime). Positively stained cells were visualized and counted with an Olympus FSX100 fluorescence microscope.
Transwell assays
The ESCC cells were incubated in the upper chambers (Millipore) which were supplemented with RPMI 1640 medium (serum-free). The lower chambers were treated with RPMI 1640 medium with 10% FBS. After 48 hours, the ESCC cells invaded into the lower chambers were fixated with formaldehyde and then dyed using crystal violet. An Olympus FSX100 fluorescence microscope was used to count the invaded cells in five randomly chosen visual fields. The cell invasion assay was conducted in similar steps except that the upper chambers were precoated with Matrigel (Corning Inc).
Luciferase reporter assay
The HCP5-Wt/Mut or PDE4A-Wt/Mut vectors (Genechem, Shanghai, China) were constructed by subcloning the wide type or mutant-binding sequence of HCP5 or PDE4A on miR-139-5p into pmirGLO reporter plasmid. These plasmids were cotransfected with miR-139-5p mimics and its negative control NC mimics into KYSE30 and EC109 cells using Lipofectamine 2000. Two days later, the luciferase activities of these reporter plasmids were accessed using a Luciferase Reporter Assay System (Promega, USA).
RNA immunoprecipitation (RIP) assay
RIP assay was conducted with an EZ-Magna RIP Kit (Millipore). The ESCC cells were lyzed in RIPA lysis buffer. The anti-Ago2 antibody and anti-IgG antibody (negative control) were used for RIP assay. Next, RIPA buffer was added to the lysates of ESCC cells supplemented with antibody-conjugated magnetic beads as previously described [12]. Finally, qRT-PCR was conducted to assess expression of immunoprecipitated RNAs.
Fluorescence in situ hybridization (FISH) assay
The HCP5 probe was synthesized by RiboBio. The 4% paraformaldehyde was used to fix the ESCC cells for 15 minutes followed by treatment of 20 μg/mL protease K. After being hybridized in 5 ng/uL hybridization solution (RiboBio) containing HCP5 probe at 37°C overnight, cells were blocked by bovine serum albumin. The nuclei were then stained with DAPI (Sigma-Aldrich) for 8 min. The Olympus fluorescence microscope was used for capture of the images.
Subcellular fraction assay
Nuclear and cytoplasmatic fractions of KYSE30 and EC109 cells were extracted using a PARIS Kit (Ambion, USA) according to the manufacturer’s instructions. Nuclear and cytosolic HCP5 expression was detected by qRT-PCR with GAPDH as a cytoplasmatic control and U6 as a nuclear control.
Sphere formation assay
The ESCC cells were cultured in plates of ultra-low adhesion (Corning, USA) with serum-free DMEM/F12 (Invitrogen) containing 20 μg/L bFGF (Invitrogen), 20 μg/L EGF (Invitrogen) and 2% B27 (Invitrogen). Two weeks later, spheres with diameter over 100 μm were photographed and counted.
Statistical analysis
The results in this study were exhibited as the mean ± standard deviation. The GraphPad Prism 7 software (GraphPad Software, Inc.) was used for statistical analysis. Student’s t test was used to compare the differences between two groups and one-way ANOVA was applied to evaluate difference among multiple groups. The gene expression correlation was accessed using Pearson’s correlation analysis. Each assay was performed in triplicates. A value of p < 0.05 was regarded as statistically significant.
Results
HCP5 expression is distinctly elevated in ESCC tissues and cells
Based on GEPIA (http://gepia2.cancer-pku.cn/#index), the boxplot revealed the significant upregulation of HCP5 in 182 esophageal carcinoma tissues compared to that in 286 normal tissues (Figure 1(a)). Then, qRT-PCR analysis was performed to detect the levels of HCP5 in ESCC tissues and cell lines. As was revealed, HCP5 was expressed at a higher level in 62 ESCC tissues than in 62 corresponding adjacent nontumor tissues (Figure 1(b)). HCP5 expression was higher in ESCC cell lines (KYSE30, EC109, EC9706, and TE1) than in normal esophageal epithelial cell line HEEpiC (Figure 1(c)).
Figure 1.
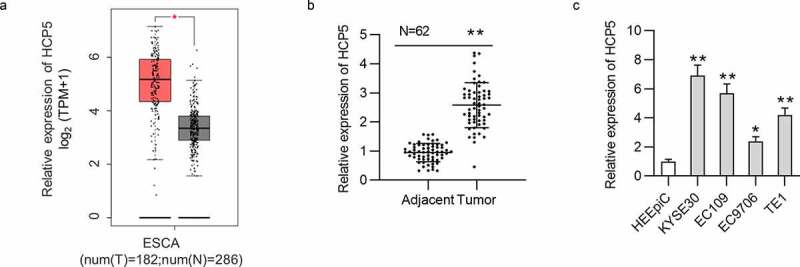
The upregulation of HCP5 in ESCC tissues and cell lines
(a) GEPIA website was searched for exploring the expression profile of HCP5 in 182 esophageal carcinoma tissues compared to that in 286 normal tissues. (b) HCP5 expression in 62 paired ESCC tissues and adjacent noncancerous tissues was detected by qRT-PCR. (c) HCP5 expression in ESCC cells (KYSE30, EC9706, EC109, TE1) and normal esophageal epithelial cell line HEEpiC was detected by qRT-PCR. *p < 0.05, **p < 0.01.
HCP5 promotes ESCC cell proliferation, invasion, and stemness characteristics
The functional role of HCP5 in KYSE30 and EC109 cells was explored. Before conducting loss-of-function assays, sh-HCP5#1 and sh-HCP5#2 plasmids were applied to knock down the expression of HCP5 in KYSE30 and EC109 cells. As a result, HCP5 expression was significantly downregulated by sh-HCP5#1/2 and sh-HCP5#2, and sh-HCP5#1 showing better transfection efficiency was used for further assays (Figure 2(a)). Cell proliferation capacity was decreased after silencing of HCP5 in KYSE30 and EC109 cells, as revealed by CCK8 assay (Figure 2(b)). The reduced EdU-positive cells also suggested that HCP5 knockdown inhibited cell proliferation in ESCC (Figure 2(c); Supplementary Figure 1(a)). Cell apoptosis was increased upon sh-HCP5#1 transfection into KYSE30 and EC109 cells (Figure 2(d); Supplementary Figure 1(b)). Moreover, downregulation of HCP5 inhibited migration and invasion of KYSE30 and EC109 cells (Figure 2(e,f); Supplementary Figure 1(c)). Results of sphere formation assay showed reduction in sphere number in sh-HCP5#1-transfected KYSE30 and EC109 cells, indicating that ESCC cell stemness characteristics were suppressed by HCP5 deficiency (Figure 2(g); Supplementary Figure 1(d)). Consistently, the levels of stemness biomarkers (Nanog, Sox2 and Oct4) were significantly inhibited by HCP5 silencing in KYSE30 and EC109 cells (Figure 2(h); Supplementary Figure 1(e)).
Figure 2.
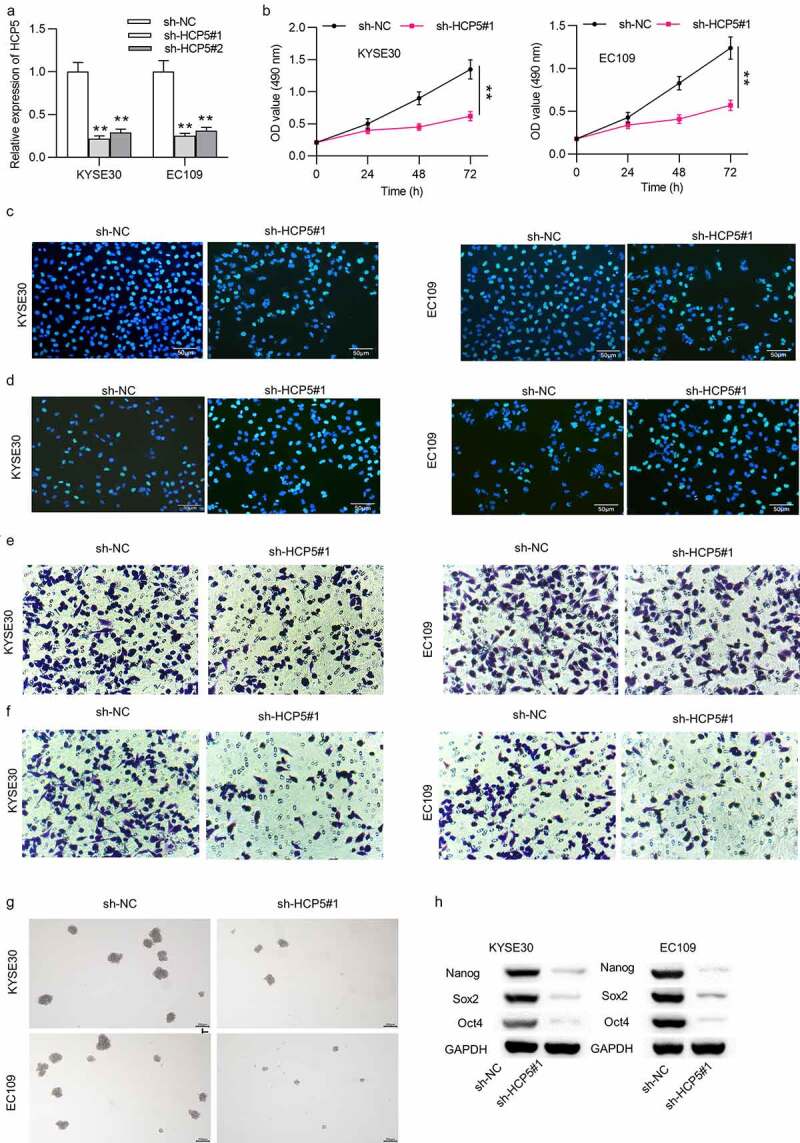
Silencing of HCP5 inhibits ESCC cell viability, proliferation, migration, invasion and stemness characteristics
(a) The efficiency of HCP5 knockdown in KYSE30 and EC109 cells by transfection of sh-HCP5#1/2 was accessed using qRT-PCR analysis. (b,c) Viability and proliferation of KYSE30 and EC109 cells transfected with sh-NC and sh-HCP5#1 were evaluated by MTT and EdU assays. (d) Apoptosis rate of KYSE30 and EC109 cells transfected with sh-NC and sh-HCP5#1 was measured by TUNEL assay. (e,f) Number of migrative and invasive KYSE30 and EC109 cells transfected with sh-NC and sh-HCP5#1 was assessed with Transwell assays. (g) Stemness characteristics of KYSE30 and EC109 cells after transfection of sh-NC and sh-HCP5#1 were investigated with sphere formation assay by determining number of formed spheres (per 1000 cells). (h) The expression levels of cell stemness-associated proteins (Nanog, Sox2 and Oct4) in KYSE30 and EC109 cells after transfection of sh-NC and sh-HCP5#1 were detected via western blot. **p < 0.01.
HCP5 interacts with miR-139-5p in ESCC cells
FISH and subcellular fraction assays indicated the cytoplasmic distribution of HCP5 in ESCC cells (Figure 3(a,b)). Therefore, we hypothesized that HCP5 might modulate the progression of ESCC by functioning as a ceRNA. On the starBase (http://starbase.sysu.edu.cn/), three miRNAs were found to possess binding site with HCP5 under the indicated screening condition (Degradome data ≥ 1, Pan-Cancer ≥ 6) (Figure 3(c)). After silencing HCP5 in ESCC cells, the expression of miR-139-5p was increased, while expression of other miRNAs exhibited no significant changes (Figure 3(d)). Therefore, miR-139-5p was used in the following assays. MiR-139-5p expression was increased by transfection of miR-139-5p mimics into ESCC cells (Figure 3(e)). Subsequently, the putative binding sequence of miR-139-5p on HCP5 was predicted (Figure 3(f)). Reduction in the luciferase activities of wild-type HCP5 reporters was observed while that of HCP5-Mut reporters showed no significant change in ESCC cells after miR-139-5p overexpression, indicating the direct interaction of HCP5 with miR-139-5p (Figure 3(g)). Additionally, RIP assay using anti-Ago2 was conducted. The effectiveness of anti-Ago2 has been verified by the western blotting (Figure 3(h)). MiR-139-5p and HCP5 enrichment in the anti-Ago2 group was detected by the RIP assay, suggesting that miR-139-5p and HCP5 coexisted in RNA-induced silencing complexes (RISCs) (Figure 3(i)). Relative enrichment of HCP5 in the complex of anti-Ago2 in cells transfected with miR-139-5p mimics was higher than that in cells transfected with NC mimics (Figure 3(j,k)). Next, the miR-139-5p expression was downregulated in ESCC tissues (Figure 3(l)). A negative expression correlation between miR-139-5p and HCP5 was found (Figure 3(m)). Additionally, miR-139-5p expression was lower in ESCC cell lines than in HEEpiC cell lines (Figure 3(n)).
Figure 3.
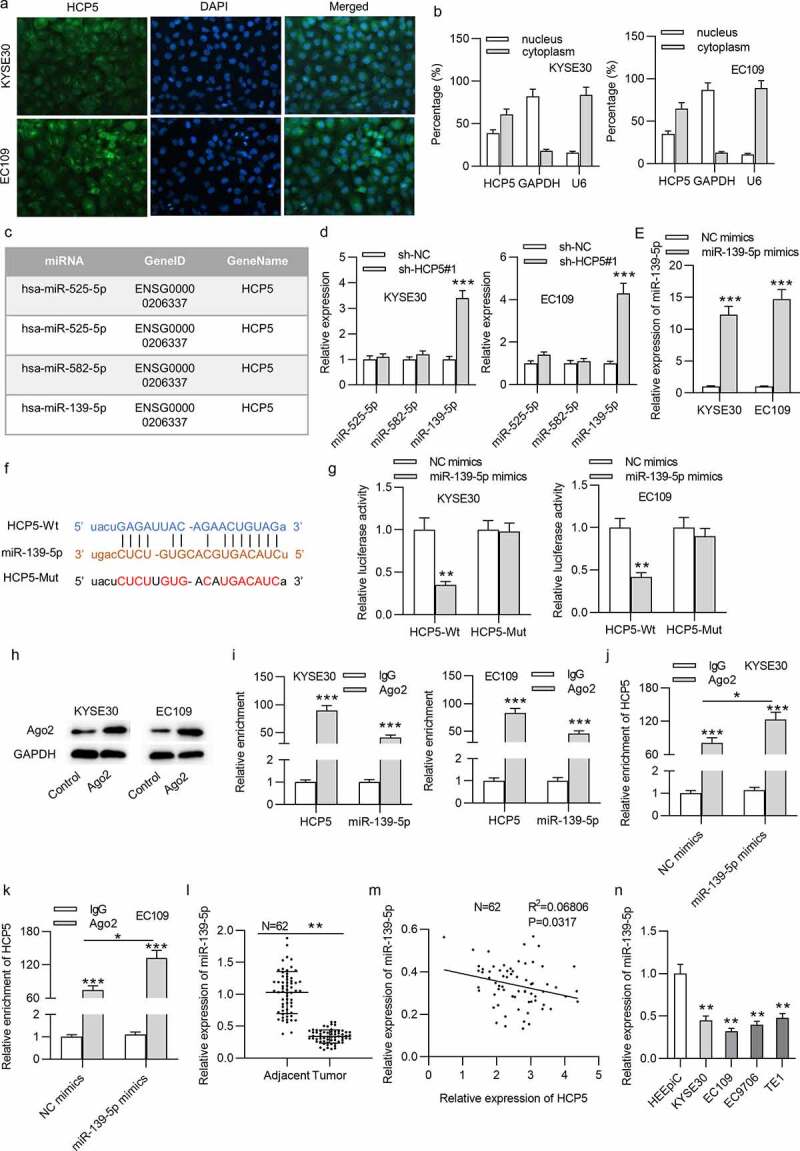
HCP5 interacts with miR-139-5p in KYSE30 and EC109 cells
(a,b) The cellular distribution of HCP5 in KYSE30 and EC109 cells was confirmed by FISH and subcellular fraction assays. (c) HCP5-binding miRNAs were predicted by starBase. (d) The expression levels of predicted miRNAs in sh-HCP5#1-treated KYSE30 and EC109 cells were detected by qRT-PCR. (e) The efficiency of miR-139-5p overexpression in KYSE30 and EC109 cells was tested with qRT-PCR. (f) The binding site of HCP5 and miR-139-5p was predicted from the starBase online database. (g) Relative luciferase activities of HCP5-Wt and HCP5-Mut plasmids in KYSE30 and EC109 were evaluated by luciferase reporter assay. (h) The effectiveness of anti-Ago2 has been verified by the western blotting. (i) RIP assay was performed to reveal the relative enrichment of miR-139-5p and HCP5 in Ago2-precipitated products in KYSE30 and EC109 cells. (j,k) RIP assay was performed to reveal the relative enrichment of HCP5 in Ago2-precipitated products in KYSE30 and EC109 cells transfected with NC mimics and miR-139-5p mimics. (l) MiR-139-5p expression in 62 paired ESCC tissues and corresponding nontumor tissues was detected by qRT-PCR. (m) Expression correlation of HCP5 and miR-139-5p in 62 ESCC tissues was analyzed by Pearson’s correlation analysis. (n) MiR-139-5p expression in ESCC cells (KYSE30, EC9706, EC109, TE1) and normal esophageal epithelial cell line HEEpiC was detected by qRT-PCR. *p < 0.05, **p < 0.01, ***p < 0.001.
PDE4A is a downstream target gene of miR-139-5p in ESCC
We further probed into the downstream targets of miR-139-5p in ESCC cells. As shown in Figure 4(a), based on RNA22, PicTar and TargetScan databases, five mRNAs (AP3M1, NUFIP2, PDE4A, SEPT11 and FBN2) were predicted as putative targets of miR-139-5p. Among the 5 mRNAs, only PDE4A showed decreased expression in KYSE30 and EC109 cells transfected with miR-139-5p mimics (Figure 4(b)). Further, qRT-PCR analysis verified the higher PDE4A expression in ESCC tissues and cells than in control tissues and cells (Figure 4(c)). According to the prediction by the starBase, the binding site between miR-139-5p and PDE4A was obtained (Figure 4(d)). Luciferase reporter assay revealed the reduction in luciferase activity of PDE4A-Wt reporters caused by miR-139-5p mimics, which indicated the binding of PDE4A and miR-139-5p (Figure 4(e)). Based on results of RIP assay, PDE4A and miR-139-5p were enriched in the complex of anti-Ago2, which indicated that PDE4A and miR-139-5p coexisted in RNA induced silencing complex (Figure 4(f)). Relative enrichment of PDE4A in the complex of anti-Ago2 in cells transfected with miR-139-5p mimics was higher than that in cells transfected with NC mimics (Figure 4(g)). For further analysis, the expression of miR-139-5p was decreased in KYSE30 and EC109 cells by transfection with miR-139-5p inhibitor (Figure 4(h)). Moreover, mRNA and protein expression levels of PDE4A were decreased by HCP5 knockdown, which were rescued by silenced miR-139-5p (Figure 4(i,j)). In addition, the expression correlation of miR-139-5p and PDE4A in ESCC tissues is not significant; expression of PDE4A was positively correlated with that of HCP5 in ESCC tissues, as shown in Figure 4(k). Moreover, we identified that overexpression of HCP5 and PDE4A promoted cell viability, proliferation, migration, invasion, and stem characteristics of KYSE30 and EC109 cells (Figures 5 and 6).
Figure 4.
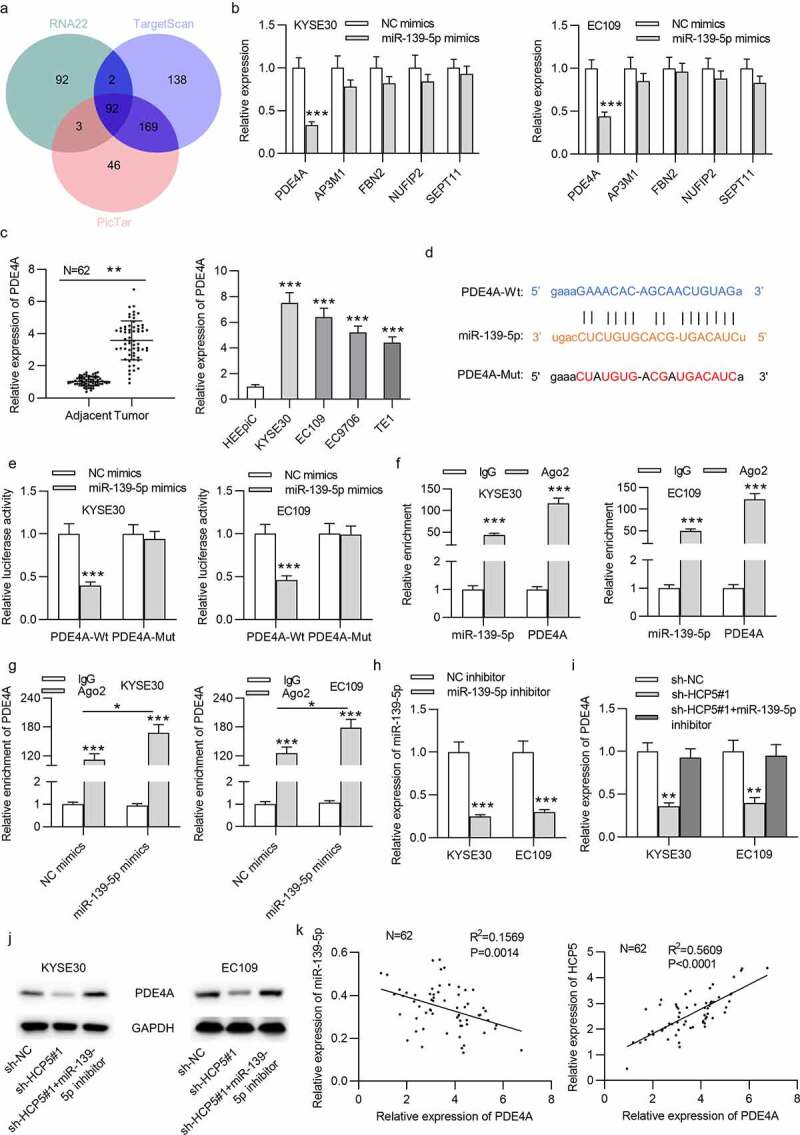
PDE4A is a downstream target gene of miR-139-5p in ESCC
(a) The possible mRNAs that possess binding site with miR-139-5p were searched from the starBase. (b) The mRNA levels of PDE4A, AP3M1, FBN2, NUFIP2, SEPT11 in miR-139-5p mimics-transfected cells were accessed by qRT-PCR. (c) The PDE4A expression in ESCC tissues and cells compared to that in control tissues and cells was detected by qRT-PCR. (d) The binding sequence between PDE4A and miR-139-5p was predicted from the StarBase website. (e) Relative luciferase activities of PDE4A-Wt and PDE4A-Mut plasmids in KYSE30 and EC109 cells were detected by luciferase reporter assay. (f) Enrichment of miR-139-5p and PDE4A in KYSE30 and EC109 cells of the Ago2 or IgG group was confirmed by RIP assay. (g) Enrichment of PDE4A in Ago2-precipitated products in KYSE30 and EC109 cells transfected with NC mimics and miR-139-5p mimics was detected by RIP assay. (h) MiR-139-5p levels in KYSE30 and EC109 cells post transfection of miR-139-5p inhibitor were testified with qRT-PCR (i,j) The PDE4A mRNA and protein levels in KYSE30 and EC109 cells after transfection of sh-NC, sh-HCP5#1, or cotransfection of sh-HCP5#1+ miR-139-5p inhibitor were measured by qRT-PCR and western blot. (k) The expression correlation between PDE4A and miR-139-5p or HCP5 in 62 ESCC tissues was analyzed via Pearson’s correlation analysis. *p < 0.05, **p < 0.01, ***p < 0.001.
Figure 5.
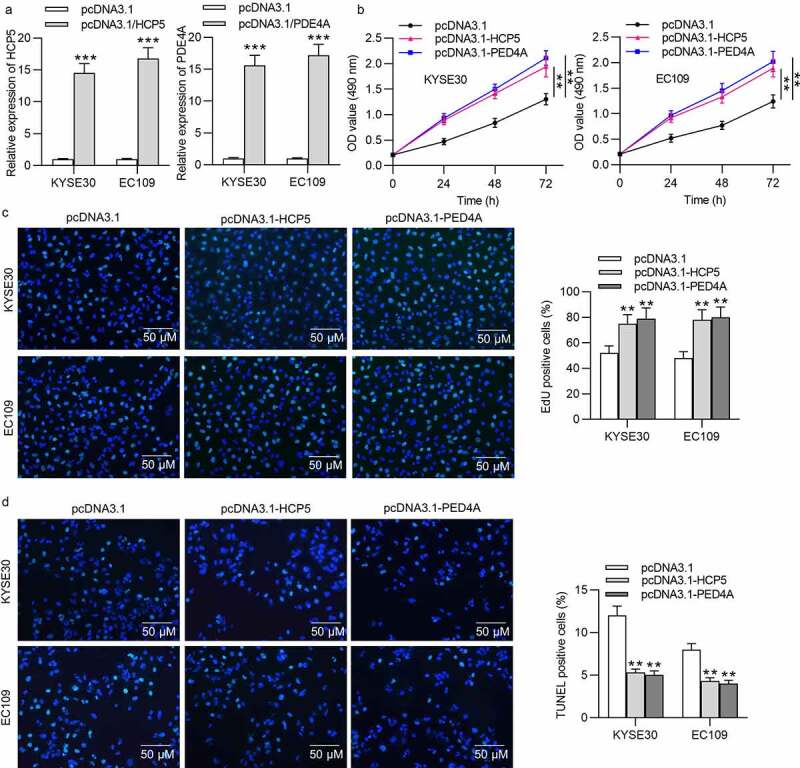
HCP5 or PDE4A promotes ESCC cell viability and proliferation
(a) The efficiency of HCP5 overexpression or PDE4A overexpression in KYSE30 and EC109 cells by transfection of pcDNA3.1-HCP5 or pcDNA3.1-PDE4A was accessed using qRT-PCR analysis. (b,c) Viability and proliferation of KYSE30 and EC109 cells transfected with empty pcDNA3.1, pcDNA3.1-HCP5 or pcDNA3.1-PDE4A were evaluated by MTT and EdU assays. (d) Apoptosis rate of KYSE30 and EC109 cells transfected with empty pcDNA3.1, pcDNA3.1-HCP5 or pcDNA3.1-PDE4A was measured by TUNEL assay.
Figure 6.
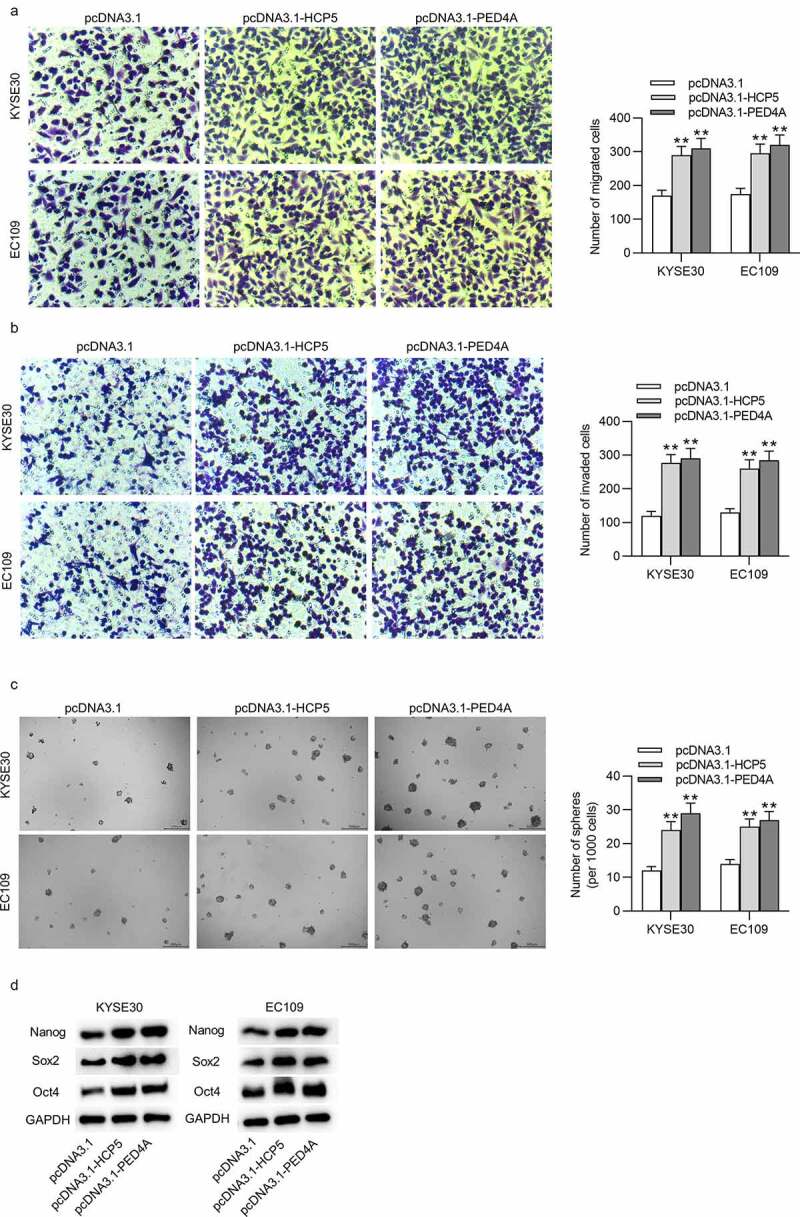
HCP5 or PDE4A promotes ESCC cell migration, invasion and stemness characteristics
(a,b) Number of migrative and invasive KYSE30 and EC109 cells transfected with empty pcDNA3.1, pcDNA3.1-HCP5 or pcDNA3.1-PDE4A was assessed with Transwell assays. (c) Stemness characteristics of KYSE30 and EC109 cells after transfection of empty pcDNA3.1, pcDNA3.1-HCP5 or pcDNA3.1-PDE4A were investigated with sphere formation assay by determining number of formed spheres (per 1000 cells). (d) The expression levels of cell stemness-associated proteins (Nanog, Sox2 and Oct4) in KYSE30 and EC109 cells after transfection of empty pcDNA3.1, pcDNA3.1-HCP5 or pcDNA3.1-PDE4A were detected via western blot. **p < 0.01.
HCP5 stimulates the PI3K/AKT/mTOR signaling via the miR-139-5p/PDE4A pathway
Previous studies suggested that the activation of PI3K/AKT/mTOR pathway facilitates ESCC progression [13], and HCP5 was discovered to activate the PI3K/AKT pathway in colon cancer [14]. Therefore, we explored whether HCP5 activates the PI3K/AKT/mTOR signaling pathway by modulating the miR-139-5p/PDE4A pathway. Western blot results revealed that phosphorylated levels of PI3K, AKT and mTOR were significantly increased in pcDNA3.1/HCP5-transfetced KYSE30 and EC109 cells (Figure 7(a,b)). Subsequently, we observed that expression of p-PI3K, p-AKT and p-mTOR was all reduced by silenced HCP5, and this effect was further counteracted by miR-139-5p inhibition or PDE4A overexpression (Figure 7(c,d)).
Figure 7.
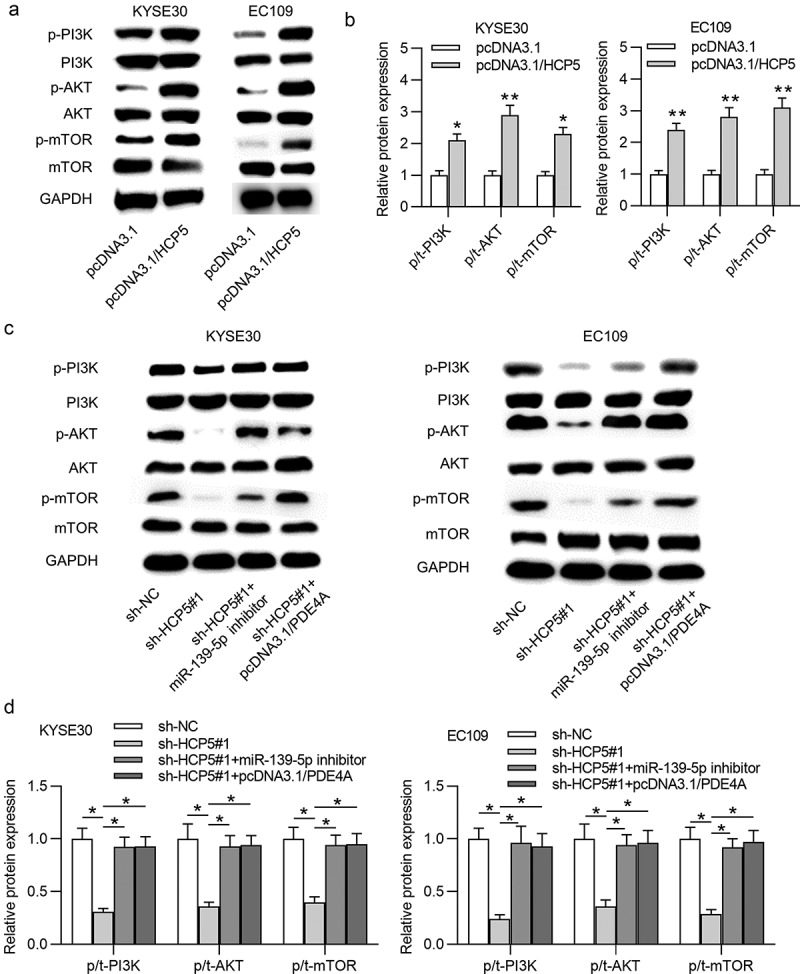
HCP5 activates the PI3K/AKT/mTOR signaling pathway
(a,b) Levels of PI3K, AKT, mTOR, p-PI3K, p-AKT, p-mTOR proteins in KYSE30 and EC109 cells post transfection of pcDNA3.1 and pcDNA3.1/HCP5 were evaluated by western blot. (c,d) The expression levels of PI3K, AKT, mTOR, p-PI3K, p-AKT, p-mTOR proteins in KYSE30 and EC109 cells by the following transfections: i. sh-NC, ii. sh-HCP5#1, iii. sh-HCP5#1+ miR-139-5p inhibitor, iv. sh-HCP5#1+ pcDNA3.1/PDE4A were evaluated by western blot. *p < 0.05, **p < 0.01.
HCP5 accelerates ESCC progression by the miR-139-5p/PDE4A axis
To certify whether HCP5 activates the PI3K/AKT/mTOR pathway to drive ESCC cellular processes via regulating the miR-139-5p/PDE4A axis, following rescue experiments were performed using pcDNA3.1/PDE4A vector and 740 Y-P (PI3K activator). As shown, treatment of pcDNA3.1/PDE4A or 740 Y-P reversed the HCP5 knockdown-mediated inhibition on ESCC cell proliferation (Figure 8(a,b); Supplementary Figure 2(a)). TUNEL assay showed that the increased cell apoptosis induced by downregulation of HCP5 was rescued by upregulation of PDE4A or 740 Y-P in ESCC (Figure 8(c); Supplementary Figure 2(b)). Further, pcDNA3.1/PDE4A or 740 Y-P countervailed the inhibitory effect of HCP5 silencing on KYSE30 cell migrative and invasive abilities (Figure 8(d,e); Supplementary Figure 2(c,d)). Moreover, HCP5 depletion-induced suppression on cell stemness and its relevant protein levels was counteracted by PDE4A enhancement or 740 Y-P treatment in ESCC (Figure 8(f,g); Supplementary Figure 2(e)).
Figure 8.
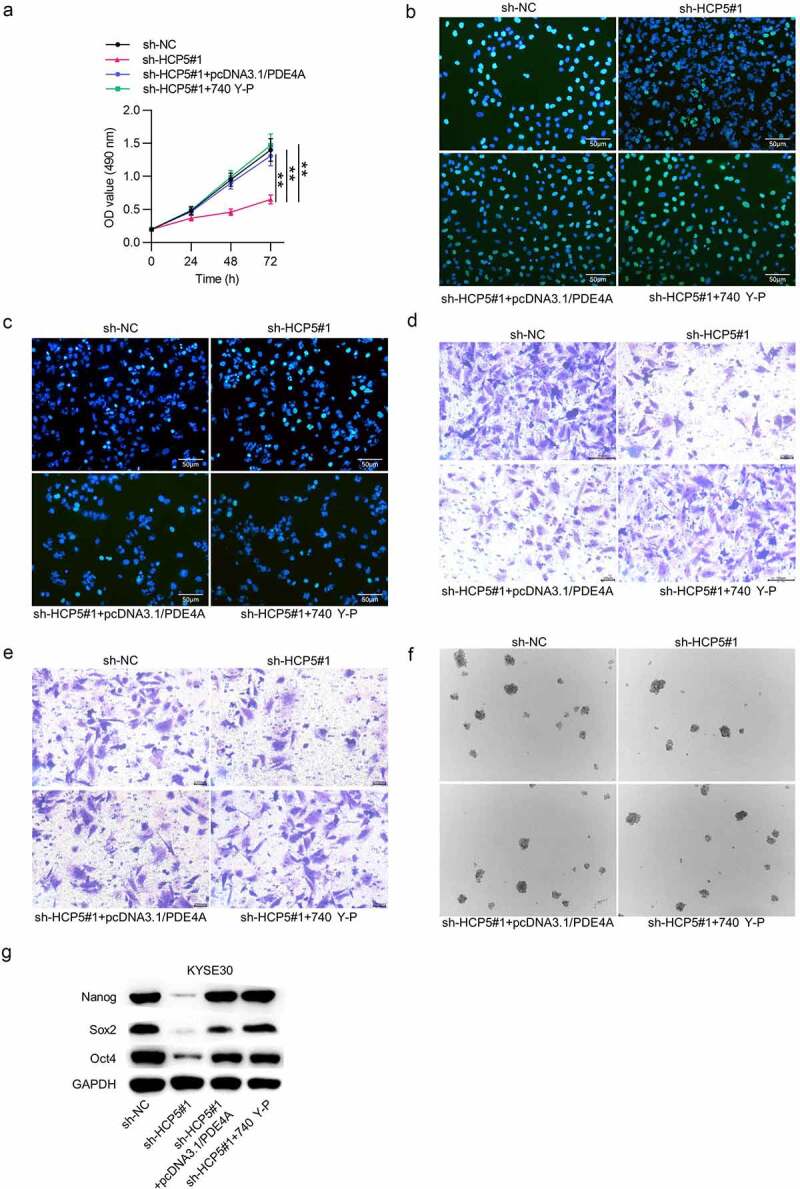
HCP5 facilitates ESCC cell malignant behaviors via the miR-139-5p/PDE4A and PI3K/AKT/mTOR signaling pathways
(a–c) MTT and EdU assays were employed to detect KYSE30 cell viability and proliferation under different treatments: i. sh-NC, ii. sh-HCP5#1, iii. sh-HCP5#1+ pcDNA3.1/PDE4A, iv. sh-HCP5#1 + 740 Y-P. (d) TUNEL assay was adopted to assess KYSE30 cell apoptosis in each group: i. sh-NC, ii. sh-HCP5#1, iii. sh-HCP5#1+ pcDNA3.1/PDE4A, iv. sh-HCP5#1 + 740 Y-P. (e,f) The migrative and invasive abilities of KYSE30 cells under different treatments: i. sh-NC, ii. sh-HCP5#1, iii. sh-HCP5#1+ pcDNA3.1/PDE4A, iv. sh-HCP5#1 + 740 Y-P were examined with Transwell assays. (g) KYSE30 cell stemness characteristics in each group: i. sh-NC, ii. sh-HCP5#1, iii. sh-HCP5#1+ pcDNA3.1/PDE4A, iv. sh-HCP5#1 + 740 Y-P were accessed by sphere formation assay. (h) The expression levels of stemness-related proteins (Nanog, Sox2 and Oct4) in KYSE30 cells under different treatments: i. sh-NC, ii. sh-HCP5#1, iii. sh-HCP5#1+ pcDNA3.1/PDE4A, iv. sh-HCP5#1 + 740 Y-P were evaluated by western blot. **p < 0.01, ***p < 0.001.
Discussion
As previously suggested, HCP5 exerts its carcinogenic effect in various cancers, such as anaplastic thyroid cancer, prostate cancer and colorectal cancer [9,10,14]. Nevertheless, whether HCP5 exerts the same impact on ESCC progression and how it works remain unclear. Our present study elucidated that HCP5 was significantly upregulated in ESCC tissues and cell lines. HCP5 promoted ESCC cellular development by regulating cell malignant behaviors such as proliferation, migration, invasion, and stemness characteristics, which suggested the tumor-promotive role of HCP5 in ESCC.
By serving as competing endogenous RNA (ceRNA), lncRNAs can upregulate mRNA expression via binding with miRNAs [15]. We identified that miR-139-5p can bind to HCP5 in ESCC cells. Expression of miR-139-5p was lower in ESCC tissues and cells than that in control tissues and cells. As a tumor suppressor, miR-139-5p suppresses colon cancer cell stemness properties as well as inhibit cancer cell migration by decreasing E2-2 expression [16]. MiR-139-5p knockdown promotes development of prostate cancer by SOX5 [17]. MiR-139-5p suppresses the cell growth and migration by targeting HOXA10 in endometrial cancer [18]. MiR-139-5p has also been identified as a member of another ceRNA axis composed of circ_0052867 and RAP1B in ESCC cells [19]. The present study revealed that HCP5 bound with miR-139-5p to suppress its expression. Inhibition of miR-139-5p rescued the inhibitory effects of silenced HCP5 on ESCC cell viability, proliferation, migration, invasion, and stemness characteristics.
MiRNAs can target 3ʹUTR of mRNAs, resulting in mRNA degradation or translational repression in malignant tumors [20]. In our study, it was demonstrated that PDE4A was a target of miR-139-5p in ESCC cells. As previous studies reported, PDE4A facilitates the epithelial-mesenchymal transition process to promote metastasis of hepatocellular carcinoma [21]. PDE4A contributes to cell growth and angiogenesis via the HIF signaling pathway in lung cancer [22]. PDE4A influences the development of breast cancer [23]. Herein, we found that PDE4A was upregulated in ESCC tissues and cells. HCP5 positively regulated PDE4A expression via binding with miR-139-5p in ESCC cells. PDE4A contributed to ESCC cell viability, proliferation, migration, invasion, and stemness characteristics. Interestingly, there is a significantly positive expression correlation between HCP5 and PDE4A in 62 clinical ESCC tissues.
Increasing studies suggested that lncRNAs are key actors in carcinogenesis via regulating the PI3K/AKT/mTOR pathway [24,25]. For instance, HOXB-AS3 promotes cell growth, migration in lung carcinoma by activating the PI3K/AKT pathway [26]. LncRNA RP1-93H18.6 promotes cervical cancer progression by activating the PI3K/AKT pathway [27]. LncRNA FOXD2-AS1 facilitates glioma development by the miR-185-5P/HMGA2 axis and the PI3K/AKT pathway [28]. The present study showed that PDE4A stimulated the PI3K/AKT/mTOR pathway, as evidenced by increased p-PI3K, p-AKT, and p-mTOR protein levels. HCP5 deficiency inhibited the PI3K/AKT/mTOR pathway by the miR-139-5p/PDE4A axis. Finally, it was validated that the anti-tumor effects exerted by silenced HCP5 on cell malignant behaviors such as proliferation, stemness, apoptosis, migration, and invasion of ESCC cells were rescued by PDE4A overexpression or 740 Y-P treatment.
In conclusion, the paper disclosed that the HCP5/miR-139-5p/PDE4A axis promotes ESCC cell viability, proliferation, migration, invasion, and stemness characteristics via stimulating the PI3K/AKT/mTOR pathway, which may contribute to the diagnostic and therapeutic methods of ESCC.
Supplementary Material
Funding Statement
This work was supported by National Cancer Center Fund Project [No.NCC201808B015] and Harbin Medical University Cancer Hospital Haiyan scientific research fund (No. JJMS2021-21).
Disclosure statement
Conflict of interest relevant to this article was not reported.
Supplementary material
Supplemental data for this article can be accessed here.
References
- [1].GongSun X, Zhao Y, Jiang B, et al. Inhibition of MUC1-C regulates metabolism by AKT pathway in esophageal squamous cell carcinoma. J Cell Physiol. 2019. July;234(7):12019–12028. [DOI] [PMC free article] [PubMed] [Google Scholar]
- [2].Yin Y, Du L, Li X, et al. miR-133a-3p suppresses cell proliferation, migration, and invasion and promotes apoptosis in esophageal squamous cell carcinoma. J Cell Physiol. 2019. Aug;234(8):12757–12770. [DOI] [PubMed] [Google Scholar]
- [3].Xu C, Guo Y, Liu H, et al. TUG1 confers cisplatin resistance in esophageal squamous cell carcinoma by epigenetically suppressing PDCD4 expression via EZH2. Cell Biosci. 2018;8:61. [DOI] [PMC free article] [PubMed] [Google Scholar]
- [4].Wang D, Hu Y.. Long non-coding RNA PVT1 competitively binds MicroRNA-424-5p to regulate CARM1 in radiosensitivity of non-small-cell lung cancer. Mol Ther Nucleic Acids. 2019. June 7;16:130–140. [DOI] [PMC free article] [PubMed] [Google Scholar] [Retracted]
- [5].Wang L, Meng D, Wang Y, et al. Long non-coding RNA LINC01296 promotes esophageal squamous cell carcinoma cell proliferation and invasion by epigenetic suppression of KLF2. Am J Cancer Res. 2018;8(10):2020–2029. [PMC free article] [PubMed] [Google Scholar]
- [6].Han C, Fu Y, Zeng N, et al. LncRNA FAM83H-AS1 promotes triple-negative breast cancer progression by regulating the miR-136-5p/metadherin axis. Aging (Albany NY). 2020. Feb 17;12(4):3594–3616. [DOI] [PMC free article] [PubMed] [Google Scholar]
- [7].Shang AQ, Wang WW, Yang YB, et al. Knockdown of long noncoding RNA PVT1 suppresses cell proliferation and invasion of colorectal cancer via upregulation of microRNA-214-3p. Am J Physiol Gastrointest Liver Physiol. 2019. Aug 1;317(2):G222–g232. [DOI] [PubMed] [Google Scholar]
- [8].Yan Y, Li S, Wang S, et al. Long noncoding RNA HAND2-AS1 inhibits cancer cell proliferation, migration, and invasion in esophagus squamous cell carcinoma by regulating microRNA-21. J Cell Biochem. 2019. June;120(6):9564–9571. [DOI] [PubMed] [Google Scholar]
- [9].Chen J, Zhao D, Meng Q. Knockdown of HCP5 exerts tumor-suppressive functions by up-regulating tumor suppressor miR-128-3p in anaplastic thyroid cancer. Biomed Pharmacother. 2019. Aug;116:108966. [DOI] [PubMed] [Google Scholar]
- [10].Hu R, Lu Z. Long noncoding RNA HCP5 promotes prostate cancer cell proliferation by acting as the sponge of miR4656 to modulate CEMIP expression. Oncol Rep. 2020. Jan;43(1):328–336. [DOI] [PubMed] [Google Scholar]
- [11].Yang C, Sun J, Liu W, et al. Long noncoding RNA HCP5 contributes to epithelial-mesenchymal transition in colorectal cancer through ZEB1 activation and interacting with miR-139-5p. Am J Transl Res. 2019;11(2):953–963. [PMC free article] [PubMed] [Google Scholar]
- [12].Wang Y, Liu Z, Yao B, et al. Long non-coding RNA CASC2 suppresses epithelial-mesenchymal transition of hepatocellular carcinoma cells through CASC2/miR-367/FBXW7 axis. Mol Cancer. 2017. July 17;16(1):123. [DOI] [PMC free article] [PubMed] [Google Scholar]
- [13].Cao J, Lv W, Wang L, et al. Ricolinostat (ACY-1215) suppresses proliferation and promotes apoptosis in esophageal squamous cell carcinoma via miR-30d/PI3K/AKT/mTOR and ERK pathways. Cell Death Dis. 2018. July 26;9(8):817. [DOI] [PMC free article] [PubMed] [Google Scholar]
- [14].Yun WK, Hu YM, Zhao CB, et al. HCP5 promotes colon cancer development by activating AP1G1 via PI3K/AKT pathway. Eur Rev Med Pharmacol Sci. 2019. Apr;23(7):2786–2793. [DOI] [PubMed] [Google Scholar]
- [15].Tay Y, Rinn J, Pandolfi PP. The multilayered complexity of ceRNA crosstalk and competition. Nature. 2014. Jan 16;505(7483):344–352. [DOI] [PMC free article] [PubMed] [Google Scholar]
- [16].Huang Z, Chen W, Du Y, et al. Serum miR-16 as a potential biomarker for human cancer diagnosis: results from a large-scale population. J Cancer Res Clin Oncol. 2019. Mar;145(3):787–796. [DOI] [PubMed] [Google Scholar]
- [17].Yang B, Zhang W, Sun D, et al. Downregulation of miR-139-5p promotes prostate cancer progression through regulation of SOX5. Biomed Pharmacother. 2019. Jan;109:2128–2135. [DOI] [PubMed] [Google Scholar]
- [18].Xu ZH, Yao TZ, Liu W. miR-378a-3p sensitizes ovarian cancer cells to cisplatin through targeting MAPK1/GRB2. Biomed Pharmacother. 2018. Nov;107:1410–1417. [DOI] [PubMed] [Google Scholar]
- [19].Wang Z, Li H, Li F, et al. Bioinformatics-based identification of a circRNA-miRNA-mRNA axis in esophageal squamous cell carcinomas. J Oncol. 2020;2020:8813800. [DOI] [PMC free article] [PubMed] [Google Scholar]
- [20].Kong YW, Ferland-McCollough D, Jackson TJ, et al. microRNAs in cancer management. Lancet Oncol. 2012. June;13(6):e249–58. [DOI] [PubMed] [Google Scholar]
- [21].Peng Y, Li Y, Tian Y, et al. PDE4a predicts poor prognosis and promotes metastasis by inducing epithelial-mesenchymal transition in hepatocellular carcinoma. J Cancer. 2018;9(13):2389–2396. [DOI] [PMC free article] [PubMed] [Google Scholar]
- [22].Pullamsetti SS, Banat GA, Schmall A, et al. Phosphodiesterase-4 promotes proliferation and angiogenesis of lung cancer by crosstalk with HIF. Oncogene. 2013. Feb 28;32(9):1121–1134. [DOI] [PubMed] [Google Scholar]
- [23].Wittliff JL, Sereff SB, Daniels MW. Expression of genes for methylxanthine pathway-associated enzymes accompanied by sex steroid receptor status impacts breast carcinoma progression. Horm Cancer. 2017. Dec;8(5–6):298–313. [DOI] [PMC free article] [PubMed] [Google Scholar]
- [24].Lee KT-W, Gopalan V, Lam AK-Y. Roles of long-non-coding RNAs in cancer therapy through the PI3K/Akt signalling pathway. Histol Histopathol. 2019;34(6):593–609. [DOI] [PubMed] [Google Scholar]
- [25].Sun R, Sun X, Liu H, et al. Knockdown of lncRNA TDRG1 inhibits tumorigenesis in endometrial carcinoma through the PI3K/AKT/mTOR pathway. Onco Targets Ther. 2019;12:10863–10872. [DOI] [PMC free article] [PubMed] [Google Scholar]
- [26].Jiang W, Kai J, Li D, et al. lncRNA HOXB-AS3 exacerbates proliferation, migration, and invasion of lung cancer via activating the PI3K-AKT pathway. J Cell Physiol. 2020;235:7194–7203. [DOI] [PubMed] [Google Scholar]
- [27].Wang Q, Yan S-P, Chu D-X, et al. Silencing of long non-coding RNA RP1-93H18.6 acts as a tumor suppressor in cervical cancer through the blockade of the PI3K/Akt axis. Mol Ther Nucleic Acids. 2019;19:304–317. [DOI] [PMC free article] [PubMed] [Google Scholar] [Retracted]
- [28].Ni W, Xia Y, Bi Y, et al. FoxD2-AS1 promotes glioma progression by regulating miR-185-5P/HMGA2 axis and PI3K/AKT signaling pathway. Aging (Albany NY). 2019;11(5):1427–1439. [DOI] [PMC free article] [PubMed] [Google Scholar] [Retracted]
Associated Data
This section collects any data citations, data availability statements, or supplementary materials included in this article.


