

Abstract
Fine‐tuned dissolution of pluripotency is critical for proper cell differentiation. Here we show that the mesodermal transcription factor, T, globally affects the properties of pluripotency through binding to Oct4 and to the loci of other pluripotency regulators. Strikingly, lower T levels coordinately affect naïve pluripotency, thereby directly activating the germ cell differentiation program, in contrast to the induction of germ cell fate of primed models. Contrary to the effect of lower T levels, higher T levels more severely affect the pluripotency state, concomitantly enhancing the somatic differentiation program and repressing the germ cell differentiation program. Consistent with such in vitro findings, nascent germ cells in vivo are detected in the region of lower T levels at the posterior primitive streak. Furthermore, T and core pluripotency regulators co‐localize at the loci of multiple germ cell determinants responsible for germ cell development. In conclusion, our findings indicate that residual pluripotency establishes the earliest and fundamental regulatory mechanism for inductive germline segregation from somatic lineages.
Keywords: cell fate determination, germ cells, mesoderm, pluripotency, T(Brachyury)
Subject Categories: Chromatin, Epigenetics, Genomics & Functional Genomics; Development & Differentiation; Regenerative Medicine
The mesodermal transcription factor T/Brachyury disrupts defined pluripotency and establishes a specific finely tuned pluripotency state as the earliest regulatory mechanism for inductive germline segregation from somatic lineages.

Introduction
Pluripotency ensures the cellular plasticity for the organized and coordinated process of differentiation to create all the specified cell lineages in the developing embryo. In mammals, this marked cellular property, also known as naïve pluripotency, is formed in the epiblast of the pre‐implantation blastocyst. From this transient pluripotent epiblast, a stable state of pluripotency can be derived in the form of self‐renewing ESCs (Evans & Kaufman, 1981; Martin, 1981), which have similar characteristics to pre‐implantation epiblast cells such as the expression of core pluripotency factors (OCT4, SOX2, and NANOG) and ability for chimeric contribution. The epiblast cells lose naïve pluripotency after implantation; however, some pluripotency regulators are continuously expressed and co‐activated with the lineage regulators at post‐implantation/gastrulation stages. From the post‐implantation epiblast, another form of pluripotent stem cells, termed epiblast stem cells (EpiSCs), are induced (Brons et al, 2007; Tesar et al, 2007). Although EpiSCs show some features of pluripotency, such as expression of core pluripotency factors and teratoma formation, they exhibit less or no ability for chimera contribution (Brons et al, 2007; Tesar et al, 2007) and reduced expression of auxiliary pluripotency factors, such as Klf4 and Tbx3 (Tesar et al, 2007; Guo et al, 2009), suggesting that they represent a developmentally more advanced (or often called “primed”) state than naïve pluripotent ESCs. Other studies have shown, however, that EpiSCs can be reprogrammed or reverted to a naïve ESC‐like state with chimeric ability by transcription factor overexpression (Guo et al, 2009; Silva et al, 2009; Guo & Smith, 2010) or via switching to stringent mESC culture conditions (Bao et al, 2009; Hanna et al, 2009; Greber et al, 2010).
Interestingly, one of our studies has shown that the ability for EpiSC reversion is negatively correlated with the expression of genes related to mesendoderm differentiation—i.e., mesendodermal marker gene‐expressing EpiSC lines could not be efficiently reverted to a naïve mESC‐like state. The study also showed that overexpression of the classical mesodermal factor T/Brachyury (Herrmann et al, 1990) prohibits the reprogramming of EpiSCs to a naïve ESC‐like state (Bernemann et al, 2011). However, the mechanistic link between reversion efficiency and the expression of mesendodermal genes in EpiSCs has not been clarified.
In an in vivo developmental context, T is required for the proper formation of precursors of mesodermal lineages such as primitive streak, posterior mesoderm, and allantois (Chesley, 1935; Gluecksohn‐Schoenheimer, 1938, 1944; Showell et al, 2004). Although the accumulated genetic studies strongly suggest that T has a key role in the fate decision to both germline and somatic lineages from the precursor state (Abe et al, 2000; Showell et al, 2004; Inman & Downs, 2006; Aramaki et al, 2013), the mechanism by which T activates this versatile differentiation program remains to be elucidated.
Using EpiSC and ESC systems, we examined the impact of T on naïve pluripotency. Through this work, we propose that there is a coordinately affected pluripotency state that accounts for the initial mechanism of germline segregation from somatic lineages.
Results
T affects the induction and maintenance of naïve pluripotency
To investigate the negative impact of T (Bernemann et al, 2011) on reprogramming at the molecular level, we established T‐inducible EpiSCs (Fig EV1A). Male EpiSCs, termed E3 and previously described by our group, contain the GOF18 (genomic Oct4 fragment, 18 kb)‐reporter system expressing GFP (Greber et al, 2010). With this reporter E3 EpiSCs, we had defined a distinct GFP‐positive cell subpopulation that could be more readily reprogrammed to a naïve state than the major population of GFP‐negative cells (Han et al, 2010) (Figs 1A and EV1B). Consistent with our previous observation, T induction by doxycycline (Dox) and dexamethasone (Dex) noticeably was found to affect the reversion of both Oct4‐GFP‐positive and Oct4‐GFP‐negative E3 EpiSCs (Figs 1B and EV1B).
Figure EV1. T affects the induction and maintenance of naïve pluripotency.

- Left: Scheme for the PiggyBac‐based vectors with Tet‐responsive promoters to induce V5‐tagged T in E3 EpiSCs (E3: T‐GR lines). Right: Western blot of T‐V5‐GR in E3: T‐GR lines stimulated as indicated for 24 h. GAPDH was used as a loading control.
- The number of resultant AP‐positive colonies and GFP‐positive cells induced from E3: T‐GR clone#1 (Fig 1B) and another independent clone#2.
- Top: Western blot of T in WT and T‐KO E3 EpiSCs cultured in 2iLIF for 3 days. GAPDH was used as a loading control. Middle: Macroscopic view of AP‐stained dishes on day 5 to evaluate the reversion of E3 EpiSCs from WT (left) and T‐KO EpiSCs (right). Bottom: Quantification of reversion efficiency based on the number of AP‐positive colony (red) and GFP‐positive cell (blue).
- FACS analysis of representative chimeric embryos.
- Quantification of the level of the indicated proteins by ImageJ based on the blot data (Fig 1D) in eight independent naïve pluripotent stem cell models (GOF‐positive E3 EpiSCs [E3G], reverted E3 EpiSCs [rE3], and 2iLIF ESCs).
- Expression of the indicated genes measured by qPCR in T‐inducible PSCs (Fig 1C and D) stimulated as indicated for 24 h. The ∆Ct values from the average Ct values of Arbp and Ppia are shown (log2 scale, the mean value of two independent experiments with two technical replicates).
Source data are available online for this figure.
Figure 1. T affects the induction and maintenance of naïve pluripotency.

- FACS analysis of the E3: T‐GR line and scheme for the evaluation of reversion efficiency.
- Reversion of E3 EpiSCs from GFP‐positive (left) and GFP‐negative EpiSCs (right). Macroscopic view of AP‐stained dishes on day 5 (top). Quantification of reversion efficiency based on the number of AP‐positive colony (middle) and GFP‐positive cell (bottom).
- Top left: Scheme for the chimera contribution assay. Bottom left: Representative brightfield/mCherry images from chimeras at E7.5. Scale bar: 100 µm. Right: Percentage of mCherry‐positive cells in chimeric embryos measured by FACS. Blue circles and red circles represent the percentage of mCherry‐positive cells derived from control and T‐induced PSCs (GOF‐positive E3 EpiSCs [E3G], reverted E3 EpiSCs [rE3], and 2iLIF ESCs), respectively.
- Western blot of the indicated proteins in T‐inducible PSCs stimulated as indicated for 24 h. GAPDH was used as a loading control.
Source data are available online for this figure.
Endogenous T becomes upregulated during the reversion process from EpiSCs to an ESC‐like state (Greber et al, 2010). Consistent with results above, T‐knockout E3 EpiSC clones showed a higher reversion efficiency compared to the wild‐type clones (Fig EV1C).
Besides its high reprogramming ability, the GFP‐positive subpopulation of E3 EpiSCs has the capability for chimeric contribution. However, T induction drastically affects the chimeric ability of GFP‐positive E3 EpiSCs labeled with CAG‐mCherry as well as other naïve pluripotent stem cell (PSC) models such as reverted E3 EpiSCs (rE3) and ESCs cultured in the 2iLIF condition (2iLIF ESCs) (Figs 1C and EV1D). Thus, these findings indicate that T affects the induction and maintenance of naïve pluripotency.
T suppresses pluripotency regulators in the process of disrupting naïve pluripotency
In this context, we observed a downregulation of representative pluripotency regulators in several clones of PSCs (Figs 1D and EV1E and F). The negative effect was conspicuous in higher T‐activated PSC clones, whereas the effect was small or not clearly visible in the lower T‐activated clones. Intriguingly, the expression level of Klf4 (Guo et al, 2009), a reversion inducer, was most susceptible to T induction.
To scrutinize the correlation between the level of induced T and its effect on pluripotency factors, we established T‐inducible 2iLIF ESCs (OCT4‐YFP ESCs (Toyooka et al, 2008) and Oct4‐GFP ESCs (Yeom et al, 1996)) (Fig 2A). FACS and the following analyses clearly showed that OCT4 and other pluripotency regulators were affected by T induction in a dose‐dependent manner (Figs 2A and B, and EV2A, Appendix Fig S1A and B). This noticeable negative effect on OCT4 was also caused by CDX2, a trophectodermal lineage regulator that induces the in vitro differentiation of ES cells (Niwa et al, 2005), but not by some other differentiation‐inducing factors previously examined (Fujikura et al, 2002; Niwa et al, 2005) (Appendix Fig S1C), suggesting that specific regulators exert a robust inhibitory effect on pluripotency regulators.
Figure 2. T suppresses pluripotency regulators in the process of disrupting naïve pluripotency.

- Top: Scheme for the PiggyBac‐based vectors to induce the T‐V5‐GR‐2A‐H2BmCherry protein in OCT4‐YFP ESCs. Bottom: FACS analysis of the induced T fusion protein and the OCT4‐YFP protein.
- Western blot of the indicated proteins in sorted T‐induced ESCs (Oct4‐GFP ESCs [left] and OCT4‐YFP ESCs [right]). GAPDH was used as a loading control.
- PCA of global gene expression in the four distinct T‐induced cell populations as shown in (A).
Source data are available online for this figure.
Figure EV2. T suppresses pluripotency regulators in the process of disrupting naïve pluripotency.

- Q‐PCR analysis of the expression levels of Oct4, Sox2, Nanog, and Klf4 in the indicated FACS‐sorted cell fractions. FACS‐sorted cell fractions indicated in Fig 2A were subjected to RT–PCR analysis. The ∆Ct values from the average Ct values of Arbp and Ppia are shown (log2 scale, the mean value of two independent experiments with two technical replicates).
- MA plots displaying differentially expressed (DE) genes (fold‐change > 1; P < 0.1) between indicated samples as shown in Fig 2A–C. No DEGs with P adj < 0.1 were shown. The analysis was performed using DESeq2 package.
- Unsupervised hierarchical clustering (correlation‐based distance) and heatmap derived from mean‐centered expression values (log2 scale) of top 3000 DEGs obtained from RNA‐seq. Key pluripotency regulators are indicated. See also Dataset EV1.
RNA‐seq revealed that many auxiliary pluripotency regulators such as Klf4 and Esrrb1 as well as core pluripotency factors are also affected, and the transcriptional profile of the naïve pluripotency state was comprehensively disrupted by T induction in a dose‐dependent manner (Figs 2C and D, and EV2B and C, Dataset EV1).
T directly regulates pluripotency factors
To garner insight into the mechanism by which T disrupts pluripotency, we performed T chromatin immunoprecipitation followed by sequencing (ChIP‐seq) in the context of pluripotency disruption. T peaks are annotated in the genomic loci including the previously identified T‐target enhancer or promoter loci (Lolas et al, 2014) (Fig EV3, EV4, EV5), and our motif analysis revealed that enriched known motifs and de novo developed motifs derived from our T‐peak data are well matched to the previously determined binding motifs of T‐box protein including T (Fig EV3D). Strikingly, peak‐calling analysis and the following visual checking of the ChIP‐seq track identified the T‐binding peaks located in the loci of several pluripotency regulators including the Oct4 distal enhancer (DE) and Nanog and Klf4 putative enhancers (Figs 3A and EV3E, Dataset EV2). The luciferase assay revealed that these T‐binding elements mediate clear transcriptional repression in a T‐dose‐dependent fashion (Fig 3B). T‐dependent downregulation of Oct4 DE activity was also confirmed by the decrease in Oct4∆PE (proximal enhancer)‐GFP reporter activity (Yeom et al, 1996) (Fig EV3F). The T‐dependent downregulation level of transcriptional activity of these specific enhancer loci was not always consistent with that of endogenous expression of pluripotency factors. For example, although all the three luciferase reporters were repressed by low T induction, the examined endogenous pluripotency factors other than Klf4 were not appreciably affected under this condition (Figs 2B and C, EV2A and 3B). We speculate that this is because endogenous gene expression is affected not only by a single enhancer site, but is rather a cumulative consequence caused by multiple factors such as other regulatory loci.
Figure EV3. T directly regulates pluripotency factors.

- Genomic distribution of T peaks annotated by HOMER in T‐induced ESCs stimulated by Dox plus Dex for 24 h. “TSS” is defined from −1 kb to +100 bp. “TTS” is defined from −100 bp to +1 kb. See also Dataset EV2.
- ChIP‐seq tracks of T (in red; input is in blue) around the known T‐target gene loci: Mesp, Mesp2 (28 kb), and Foxa2 (20 kb).
- Gene expression level (RNA‐seq signal intensity [log2 scale]) of the known T‐target genes indicated in (B) (two independent experiments).
- Motif analysis with T‐ChIP‐seq data by HOMER. Shown motifs are the top three known and de novo motifs enriched in data sets of T peaks.
- ChIP‐seq tracks of T (in red; input is in blue) around the Nanog (10 kb), Klf4 (20 kb), Klf9 (120 kb), and Nr5a2 (190 kb). T‐binding peaks indicated by arrowheads were also confirmed by ChIP‐qPCR (Fig 3A). Note that T‐binding elements (TBEs) in Nanog and Klf4 (arrowheads) are used for the luciferase reporter assay shown in Fig 3B.
- FACS analysis of the induced T fusion protein and Oct4∆PE‐GFP reporter in ESCs bearing luciferase reporter regulated by the DE stimulated by Dox plus Dex for 24 h.
- Left: FACS analysis of the induced T fusion protein and OCT4‐YFP protein reporter in ESCs stimulated by Dox plus Dex for 3 h. Middle: qPCR analysis of the expression levels of Oct4, Sox2, and Nanog in the indicated FACS‐sorted cell fractions (left). The ∆Ct values from the average Ct values of Arbp and Ppia are shown with SDs (n = 3) (log2 scale, the mean value of three independent experiments with two technical replicates). Right: ChIP‐qPCR for the enrichment of the indicated factors on the Oct4 distal enhancer locus in different T‐dose fractions (left). The enrichment is indicated by the percent input with SDs (the mean value of three independent experiments with two technical replicates). P values were calculated by two‐tailed unpaired t‐test.
- Left: Scheme for evaluation of the T‐dependent disruption of pluripotency by comparing with the known Oct4 deletion‐mediated disruption pathway of pluripotency. Right: Scheme for the RNA‐seq.
Figure EV4. T activates the germ cell differentiation program in parallel with the disruption of naïve pluripotency.
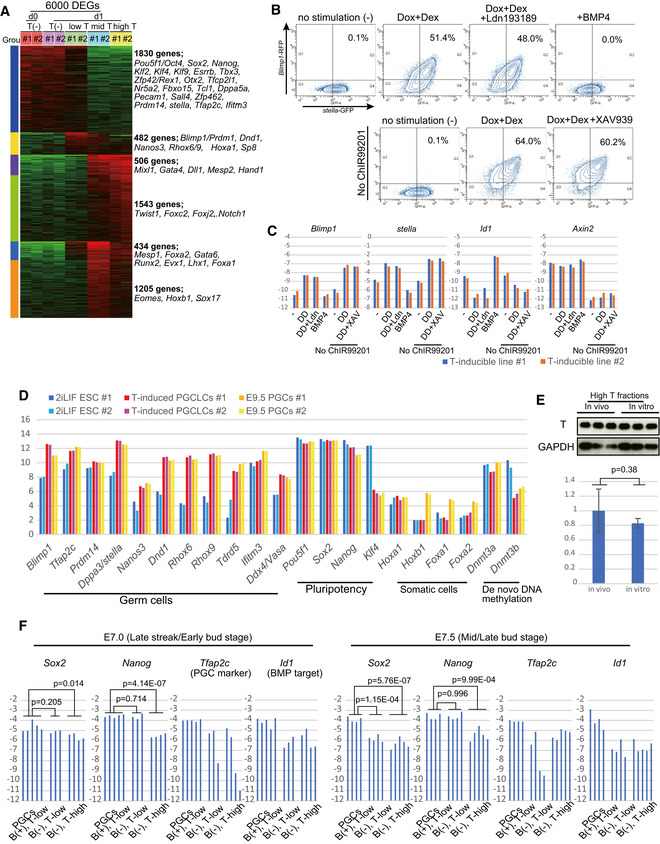
- FACS analysis of Blimp1‐RFP reporter and stella‐GFP reporter (BRSG) in T‐inducible BRSG ESCs stimulated as indicated for 8 h.
- qPCR analysis of the expression levels of indicated genes in T‐induced 2iLIF ESCs (B). The ∆Ct values from the average Ct values of Arbp and Ppia are shown (log2 scale, the mean value of two independent experiments with two technical replicates).
- Expression level/RNA‐seq signal intensity (log2 scale) of key germ cell determinants, key pluripotency genes, key somatic determinants, and genes related to de novo DNA methylation in naïve ESCs, T‐PGCLCs, and E9.5 mouse PGCs (two independent experiments).
- Top: Western blot of FACS‐sorted cell fractions with high T level derived from gastrulating embryos in vivo (Fig 4E) and T‐induced ESCs in vitro (Appendix Fig S1C). Endogenous T (in vivo) and exogenous T induced by Tet‐on inducible overexpression system were detected. GAPDH was used as a loading control. Bottom: Quantification of the level of the T protein by ImageJ based on the blot data (top). The mean values of three independent experiments are shown with SDs. P values were calculated by two‐tailed unpaired t‐test.
- Expression of the indicated genes measured by qPCR in FACS‐sorted cells (Fig 4E) derived from embryos at different developmental stages (E7.0–7.5). Ten FACS‐sorted cells in different cell fractions (Fig 4E) were used for each individual qPCR analysis with two technical replicates. The ∆Ct values from the average Ct values of Arbp and Ppia are shown (n ≥ 3, log2 scale). P values were calculated by two‐tailed unpaired t‐test.
Source data are available online for this figure.
Figure EV5. Coordinated regulatory mechanism of T and residual pluripotency factors is critical for a germ cell differentiation program.

- Heatmap of selected key germ cell determinants (top), key somatic mesoderm determinants (middle), and key pluripotency genes (bottom) in FACS‐sorted cell fractions/four different T‐dose fractions of T‐induced OCT4‐YFP ESCs (left) (Fig 2A–C) and low T‐inducible ZHBTc4 ESCs stimulated as indicated (right) (Figs 3C and EV3G).
- Venn diagrams showing the overlap between T peaks and the indicated core pluripotency factor peaks examined by HOMER. The number of overlapping peaks and detected key germ cell determinants are described below each Venn diagram. See also Dataset EV2 for all the detected colocalized loci of T and core pluripotency factors.
- ChIP‐seq tracks of T (in red; input is in blue) and core pluripotency factors (OCT4, SOX2, and NANOG) (in green) around the stella/Dppa3 (25 kb) and Dnd1 (10 kb).
- ChIP‐qPCR for the enrichment of T on indicated gene loci around Blimp1 and Prdm14 in different T‐dose fractions (left). The enrichment is indicated by the percent input with SDs (three independent experiments with two technical replicates).
Figure 3. T directly regulates pluripotency factors.

- Left: ChIP‐seq tracks of T (in red; input is in blue) around the Oct4 (7.5 kb). DE, distal enhancer; PE, proximal enhancer. The T‐binding peak around the Oct4 DE is indicated (arrowhead). Right: ChIP‐qPCR for the enrichment of T on the DE and the regions indicated in Fig EV3E. NC, negative control (the locus without T binding). The enrichment is indicated by the percent input with SDs (three independent experiments with two technical replicates).
- Luciferase assay with T‐binding elements (TBEs) around the indicated loci as shown in (A) and Fig EV3E. Relative luciferase activities of sorted cell fractions are shown with SDs. (three independent experiments with two technical replicates).
- Left: PCA of global gene expression in low T‐inducible ZHBTc4 ESCs stimulated as indicated in Fig EV3G. Right: Heatmap of selected key pluripotency genes derived from mean‐centered expression values (log2 scale).
- Top: Venn diagrams showing the overlap between down‐ and upregulated DEGs induced by both high T induction and Oct4 deletion in low T‐activated condition (fold‐change > 1; P < 0.1 by DESeq2). Bottom: Ontology terms enriched in overlapped DEGs. See also Dataset EV3.
Although many previous studies have shown that T acts as a transcriptional activator but not a repressor (Showell et al, 2004), our result clearly indicates that T has a repressive effect on pluripotency genes. Therefore, we next examined the mechanism of T‐dependent repression of pluripotency genes. As we found that T colocalized with pluripotency factors in several loci, such as distal enhancer of Oct4, we therefore speculated that T affects the binding of pre‐existing pluripotency activators in such regulatory elements. To validate this, we examined whether T induction inhibits the binding of pluripotency factors. At 3hr after T induction in ESCs, expression of endogenous OCT4 and other pluripotency activators was unaffected despite T induction at the low to intermediate levels (Fig EV3G). However, binding of OCT4, SOX2, and NANOG to the distal enhancer of Oct4 was downregulated in a T‐dose‐dependent manner (Fig EV3G). Therefore, it is suggested that in the naïve pluripotency context, where transcriptional activation of pluripotency genes is already highly activated (or presumably saturated), the repressive effect of T can be more dominant rather than its canonical activation effect, leading to the repressor‐like behavior of T.
As shown above, high T induction resulted in a severely disrupted pluripotency state, whereas low T level had a limited negative effect on the transcriptional profile of the pluripotency state (“residual pluripotency” with no obvious decrease in core pluripotency factors but without the chimeric ability) (Fig EV3H). As our ChIP‐seq analysis and luciferase assay above have shown that T directly represses Oct4 and other key pluripotency factors, we next examined to what extent the noticeable inhibitory effect on pluripotency caused by T transcriptionally overlaps with the known pathway of pluripotency disruption induced by Oct4 deletion.
For this purpose, we established the low T‐inducible ZHBTc4 ESC line (Niwa et al, 2000) in which Oct4 expression can be repressed by stimulation with Dox in the low T‐activated condition (Fig EV3H, Appendix Fig S2A). RNA‐seq in this context revealed that the low T level clearly affected the characteristics of naïve pluripotency and repressed some of the ancillary pluripotency factors such as Klf4, which was further pronounced by Oct4 deletion with Dox stimulation (Fig 3C), as in the case of the state transition from low T to high T (Fig 2D). We found that a certain cluster of genes are commonly regulated in these distinct conditions (Fig 3D), suggesting that the T‐dependent inhibitory effect on pluripotency is partly mediated by the repression of Oct4. Indeed, Oct4 and its target pluripotency regulators were selected in the commonly downregulated genes, and the functional enrichment analysis for these genes revealed that they are annotated to terms such as “stem cell population maintenance” (Fig 3D, Appendix Fig S2B, Dataset EV3). On the other hand, many genes related to mesodermal differentiation were selected in the commonly upregulated genes, which are consistently annotated to the terms such as “skeletal morphogenesis”, suggesting that the T‐dependent mesoderm differentiation program is activated in both conditions (Fig 3D, Appendix Fig S2B, Dataset EV3).
T activates the germ cell differentiation program in parallel with the disruption of naïve pluripotency
In the process of examining the pluripotency disruption induced by T, we observed the activation of T‐target genes associated with differentiation and concomitant T binding to their promoter or enhancer loci (Fig EV3, EV4, EV5). To further explore the differentiation program activated during this process, we re‐examined our RNA‐seq data by applying them into the k‐means clustering specifically to evaluate the dose‐dependent effect on key differentiation factors (Figs 4A and EV4A, Dataset EV1); this was suggested by the T‐mediated negative effect on pluripotency regulators in a dose‐dependent manner (Fig 2). As T is required for the development of both germ cell and somatic cell lineages (Abe et al, 2000; Showell et al, 2004; Inman & Downs, 2006; Aramaki et al, 2013), we sought and identified key factors associated with these specific developmental processes in the classified groups of genes (Figs 4A and EV4A). Strikingly, in this classification, pluripotency regulators and germ cell determinants are generally in the same or neighboring cluster, in which the activation of clustered genes was highest in the lower T‐activated condition but was repressed in the higher T condition. On the other hand, many key somatic genes are located in other groups, in which the activation of clustered genes is highest in higher T‐activated conditions.
Figure 4. T activates the germ cell differentiation program in parallel with the disruption of naïve pluripotency.

- FACS analysis of the induced fusion protein (T‐V5‐GR‐2A‐H2BGFP) and Blimp1‐RFP reporter. Right: Measurements of Blimp1‐RFP expression in three different cell fractions are also plotted on the histogram image.
- Unsupervised hierarchical clustering (correlation‐based distance) obtained from RNA‐seq in T‐induced PGCLCs (T‐PGCLCs), in vivo PGCs, and FACS‐sorted cell fractions as indicated in Fig 2A–C.
- PCA of global gene expression in the same dataset as (D).
- Left: A representative confocal image of a mouse embryo at E7.0 bearing T‐GFP and Blimp1‐RFP transgenic reporters. Scale bar: 50 µm. Arrowheads indicate Blimp1‐positive nascent germ cells in the posterior proximal epiblast. Right: FACS analysis of dissociated mouse embryos without visceral endoderm.
- Expression of the indicated genes measured by qPCR in FACS‐sorted cells (E) derived from embryos at different developmental stages (E7.0–7.5). Ten FACS‐sorted cells in different cell fractions (E) were used for each individual qPCR analysis with two technical replicates. The ∆Ct values from the average Ct values of Arbp and Ppia are shown (n ≥ 3, log2 scale). P values were calculated by two‐tailed unpaired t‐test.
The notion of the lower T‐specific activation of germ cell genes in parallel with the disruption of naïve pluripotency is also underpinned by the functional enrichment analysis, which put out the terms such as “gamete generation” to which several critical germ cell determinants such as Blimp1 and Dnd1 are annotated (Fig 3D, Appendix Fig S3A, Dataset EV3).
In good agreement with this observation, the synchronous activation of endogenous germ cell determinants and the germ line reporter (Blimp1‐RFP (Sugimoto & Abe, 2007) or stella‐GFP (Payer et al, 2006)) was specifically induced by low T (Fig 4B, Appendix Fig S3B–D), concomitant with the maintenance of core pluripotency factors and downregulation of Klf4 (Appendix Fig S3B and D). However, higher T level rather repressed germ cell determinants with a concomitant noticeable decrease in pluripotent factors (Fig 4B, Appendix Fig S3B–D). Furthermore, no such synchronous activation was induced by CDX2 at any dose level (Appendix Fig S3B), another robust disrupting factor of pluripotency (Appendix Fig S1C). We next examined whether BMP and WNT signaling pathways, two essential upstream regulators for germ cell fate in vivo, are critical for T‐dependent germ cell fate induction from the naïve pluripotent state. In order to suppress these pathways, we utilized chemical inhibitors of these pathways (LDN193189 and XAV939, respectively), that markedly blocked cytokine‐dependent PGCLC induction (Appendix Fig S4A). In addition, ChIR99201 was removed from 2iLIF medium to inhibit the activation of the WNT/β‐CATENIN pathway. Activation of germ cell genes was clearly observed in 2iLIF ESCs at 8 h after stimulation with Dox and Dex (earlier time point than examined above), which was not affected by the addition of inhibitors or withdrawal of ChIR99201 (Fig EV4B and C). Furthermore, activation was induced in the context of repressed Id1 and Axin2 (downstream target genes of BMP and WNT, respectively) (Fig EV4C), indicating that T‐driven induction of germ cell fate from naïve state is independent of BMP and WNT signaling pathways.
We then determined the transcriptomes of T‐induced primordial germ cell‐like cells (T‐PGCLCs: Blimp1/stella double‐positive cells at day 2) and compared them with those of PGCs at embryonic day 9.5 (E9.5) (Appendix Fig S4B and C), 2iLIF ESCs, and T‐induced ES cell populations (Fig 2A). Unsupervised hierarchical clustering and principal component analysis (PCA) of global gene expression showed that the T‐PGCLCs bear similar transcriptomes to those of E9.5 PGCs (Fig 4C and D). More specifically, representative germ cell‐determinant genes such as Blimp1 are activated in T‐PGCLCs at levels comparable to those in E9.5 mouse PGCs (Fig EV4D). On the other hand, genes related to somatic differentiation (e.g., Hoxb1) and genes related to de novo DNA methylation (e.g., Dnmt3b) were repressed, consistent with the results of previous studies (Ohinata et al, 2005; Kurimoto et al, 2008). We then examined the further differentiation ability of T‐PGCLCs by utilizing the induction method of primary oocytes from EpiLC‐derived PGCLCs (Hikabe et al, 2016). However, the efficiency of deriving primary oocytes from T‐PGCLCs was much lower than that of PGCLCs derived from EpiLCs (Appendix Fig S4D), suggesting that T‐induced PGCLCs are incompletely differentiated/lineage‐specified.
To investigate the relationship between T expression level and germ cell specification in vivo, we next utilized the T‐GFP knock‐in mouse system (Burtscher & Lickert, 2009). We found that various levels of T expression were also induced in embryos at germ cell specification stages (E7.0‐7.5), and the level of T expression in vivo in the cell fraction of high T level is comparable to that of high T‐induced cell population in vitro (Figs 4E and EV4E). Consistent with our in vitro observation above, Blimp1‐positive PGCs are detected in the low T‐level cell population (Fig 4E and F) at early specification stages (E7.0–7.5). In addition, the expression of pluripotency factors such as Oct4 and Klf4 was lower in the cell population of higher T levels, compared to the lower T‐level population (Figs 4F and EV4F), consistent with the dose‐dependent disruption effect of T on pluripotency factors observed in vitro.
Coordinated regulatory mechanism of T and residual pluripotency factors is critical for a germ cell differentiation program
In the low T‐induced condition with the synchronous activation of germ cell genes, core pluripotency factors are maintained while some ancillary factors are noticeably reduced (residual pluripotency), suggesting that the germ cell differentiation program may be achieved by a coregulatory machinery of T and residual pluripotency regulators. This hypothesis is also supported by data showing a noticeable decrease of germ cell determinants caused by Oct4 deletion even in the low T‐induced condition (Fig EV5A). In line with this hypothesis, we identified genomic loci co‐bound by T and core pluripotency factors around the multiple germ cell‐determinant genes such as Blimp1, Prdm14, and Dnd1 (Figs 5A and B, and EV5B and C) by exploiting our T‐ChIP‐seq data and our previous OCT4‐, SOX2‐, and NANOG‐ChIP‐seq data in the naïve pluripotent state (Adachi et al, 2018). Although the expression of such PGC genes was severely affected by the higher level of T, the binding of T to the Blimp1 and Prdm14 loci was clearly detected in all the T‐dose cell factions, and the level of their binding was increased in a dose‐dependent manner (Fig EV5D), suggesting that actual expression of PGC genes is regulated not only by T but also by other factors. Indeed, the luciferase assay revealed that the specific co‐bound locus in Blimp1 or Prdm14 mediates transcriptional activation by T, but that it was severely affected by Oct4 deletion (Fig 5C). This finding is consistent with the endogenous transcriptional situation, in which such germ cell determinants show less or no activation in the Oct4‐deleted condition (Fig EV5A).
Figure 5. Coordinated regulatory mechanism of T and residual pluripotency factors is critical for a germ cell differentiation program.

- ChIP‐seq tracks of T (in red; input is in blue) and core pluripotency factors (in green) around the Blimp1 (100 kb) and Prdm14 (100 kb). The co‐bound locus (L#1–4) and the locus exclusively bound by core pluripotency factors but not T (L#5) are indicated by arrow. NC, negative control (the locus without T binding).
- ChIP‐qPCR for the enrichment of the indicated factors on the loci (L#1–5) indicated in (A). The enrichment is indicated by the percent input with SDs (three independent experiments with two technical replicates).
- Luciferase assay with the specific sequence of the locus bound by T around L#1 and L#3 as shown in (A). Relative luciferase activities of low T‐inducible ZHBTc4 ESCs stimulated as indicated are shown with SDs. (three independent experiments with two technical replicates).
- Expression of Blimp1 and Prdm14 measured by qPCR in PGCLCs derived from indicated ESC lines. The ∆Ct values from the average Ct values of Arbp and Ppia are shown (log2 scale, the mean value of two independent experiments with two technical replicates).
- Top: Oct4‐GFP (green) reporter expression (left), and Blimp1‐RFP (red) and Oct4‐GFP (BROG) reporter expression (right) in the gonads of E13.5 embryos generated by 4N complementation with the indicated ESC lines. Scale bar: 100 µm. Bottom: percentage of Oct4‐GFP reporter‐positive PGCs (left) and BROG reporter‐positive PGCs (right) measured by FACS analysis. Blue circles, red squares, and green triangles represent the percentage of gonadal PGCs in the first, second, and third independent mutant line, respectively, of the examined locus (L#1–5).
- Model indicating the inductive germ cell segregation achieved by a coregulatory mechanism of residual pluripotency regulators and lineage regulators.
In order to examine the requirement of the co‐bound locus, we established mutant ESC lines in which the co‐bound locus was deleted by Cas9. Deletion of the co‐bound locus (L#1‐4) respectively affected the endogenous expression of Blimp1 or Prdm14 in primordial germ cell‐like cells (Hayashi et al, 2011) (PGCLCs) and germ cell development in vivo (Fig 5D and E, Appendix Fig S5A–D). Notably, combinatorial deletion of the co‐bound loci resulted in a more severe phenotype than the single‐deletion mutants at comparable levels to the Prdm14‐KO phenotype. In contrast, the locus exclusively bound by core pluripotency factors but not by T (L#5) was dispensable, though Prdm14 expression in this mutant ESC line was noticeably downregulated to a level where the PRDM14 target genes (Yamaji et al, 2013) were aberrantly activated (Appendix Fig S5E). Conclusively, these findings demonstrate that a coordinated regulatory mechanism of T and residual pluripotency factors exerts a germ cell differentiation program, which is discriminated from the T‐driven somatic differentiation program (Fig 5F).
Discussion
Although naïve pluripotency in vivo is a transient state that specifically emerges in the pre‐implantation embryo, multiple pluripotency regulators are continuously co‐expressed with lineage regulators in the developing embryo at post‐implantation/gastrulating stages after the loss of naïve pluripotency characteristics. However, the molecular function of these residual pluripotency factors in the specification of cell lineages, or inversely, the significance of co‐expressed lineage regulators in the residuality of pluripotency during these stages is not well understood.
Based on our previous finding (Bernemann et al, 2011), we conducted the present study and determined that T, a well‐conserved mesodermal lineage regulator, exerts a noticeable inhibitory effect not only on EpiSC reversion to a naïve ESC‐like state but also, in a more direct manner, on the characteristics of naïve pluripotency in fast kinetics (Figs 1, 2, 3). T induced a dose‐dependent negative effect on the transcriptional profile of naïve pluripotency by binding directly to the genomic loci of Oct4 and other pluripotency regulators. Thus, our findings suggest that T affects pluripotency through the cumulative and parallel effect on these pluripotency‐associated factors, eventually leading to the disruption of the defined pluripotency.
This single factor‐driven collapse of pluripotency in a chemically defined 2iLIF condition occurs in parallel with the induction of a differentiation program associated with nascent mesoderm development, including both germ cell and somatic cell specification (Fig 4A), consistent with the results of previous studies (Abe et al, 2000; Showell et al, 2004; Inman & Downs, 2006; Aramaki et al, 2013). Importantly, the T‐induced differentiation program as well as the level of pluripotency disruption varies in accordance with the T dose, with the low T level resulting in the synchronous activation of germ cell determinants and in the partly affected pluripotency state, i.e., the residual pluripotency state. Although low T‐level‐induced PGCLCs (Blimp1/stella double‐positive cells) had similar transcriptomes to the in vivo PGCs, they showed a poor ability to further germ cell differentiation (Appendix Fig S4D). This might be due to the incomplete specification of T‐induced PGCLCs because of the continual activation of T. Indeed, the expression of mesodermal genes, including T, was shown to be eventually repressed in in vivo PGCs, and the continued activation of the somatic mesodermal program is detrimental to germ cell program (Ohinata et al, 2005; Kurimoto et al, 2008). Intriguingly, the higher T dose does not result in the activation of germ cell genes, with a concomitant severe disruption of pluripotency and activation of the somatic differentiation program. Consistent with such in vitro observation, in vivo PGCs were found to be induced in the lower T‐level cell population at the posterior proximal epiblast, and pluripotency factors were relatively downregulated in cells of higher T level. On the other hand, we also found that the majority of lower T‐level cells in gastrulating epiblasts are Blimp1‐negative/low, suggesting another regulatory mechanism for inducing germ cell fate. One possible mechanism is a cross‐talk with the activated BMP4 signaling (Lawson et al, 1999), a critical upstream pathway for germ cell specification. Consistent with this hypothesis, Blimp1‐positive PGCs show higher levels of Id1 (inhibitor of differentiation/DNA binding 1), a target gene of BMP signaling, in vivo at early specification stages compared with Blimp1‐negative/low cells with lower T levels (Fig EV4F). Collectively, these findings suggest that T requires a permissive context created by a pluripotency state to be able to activate the germ cell differentiation program. Indeed, this possibility was supported by the findings that the synchronous activation of germ cell genes was not induced even by the low level of T in the severely affected pluripotency context caused by Oct4 deletion as well as high T induction (Fig EV5A). Notably, along with this Oct4 deletion in the low T‐induced condition, many genes related to somatic mesoderm differentiation were inversely upregulated, some of which were also activated in the disrupted pluripotency condition caused by high T dose. In line with the notion that the residual pluripotency state enables T to activate the germ cell differentiation program, our ChIP‐seq analysis has identified the multiple genomic loci of germ cell‐determinant genes that are co‐regulated by T and core pluripotency factors and are responsible for germ cell development (Fig 5). Some of these identified sites colocalized by T and pluripotency factors matched well with T‐binding sites in the EpiLC/PGCLC differentiation context of the previous study (Aramaki et al, 2013) (Appendix Fig S6). In conclusion, our findings here shed light on the regulatory mechanism created by residual pluripotency, enabling the segregation of the germline from somatic cell lineages.
The direct induction of the germ cell fate from the defined naïve pluripotency is in contrast to the induction from several primed pluripotent cell models by the combination of signaling molecules and transcription factors (Tesar et al, 2007; Ohinata et al, 2009; Hayashi et al, 2011; Magnusdottir et al, 2013; Nakaki et al, 2013). The primed pluripotency‐specific regulatory mechanism for germ cell fate is also supported by the recent study showing the primed specific NANOG‐binding to establish the putative enhancers to induce germ cell fate (Murakami et al, 2016). However, our induction model of germ cell fate from naïve ESCs is independent of both priming to a stimulus‐responsive epiblast‐like state and the subsequent activation of signaling pathways such as that of BMP and WNT (Figs 4A and B, and EV4A–C). Furthermore, our finding indicates that the regulatory locus bound by core pluripotency factors in naïve state is co‐regulated by T to achieve the germ cell fate (Fig 5), suggesting the notion different from previous studies. Nevertheless, the significance of affected pluripotency in germ cell fate is consistent with the recent publication, which showed that pluripotency regulators such as KLF4 and OTX2 blocks the initial germ cell differentiation program (Hackett et al, 2017; Zhang et al, 2018). Indeed, these factors were rapidly affected in the low T‐activated condition concomitantly with the activation of germ cell determinants (Figs 1D, 2B and 4A). In line with this, PGC‐like state is induced from naïve ESCs by the removal of LIF or the deletion of Klf4, one of the reversion/reprogramming‐inducing factors (Hackett et al, 2017).
Segregation of the germ cell lineage in metazoans can be achieved by either maternally inherited determinants (preformation) or inductive signals (epigenesis). The latter mode wherein germ cells are induced de novo from pluripotent cells by signaling molecules is evolutionarily more ancestral and conserved (Extavour & Akam, 2003). A notable feature common to many species using epigenesis is the appearance of the initial germ cell population in pluripotent mesoderm (Chiquoine, 1954; Ginsburg et al, 1990; Extavour & Akam, 2003; Johnson et al, 2011; Ewen‐Campen et al, 2013), suggesting that inductive signals are shared between germ cell and other somatic mesoderm differentiation. Although many studies suggest that common mesodermal inputs such as BMP and WNT and their targets such as T and TWIST are required for the induction of germ cell fate (Winnier et al, 1995; Lawson et al, 1999; Ohinata et al, 2009; Aramaki et al, 2013; Ewen‐Campen et al, 2013; Chatfield et al, 2014), the mechanism by which such a common mesodermal input selectively drives a germ cell specification program or activates downstream germ cell determinants such as Blimp1 has long been an unresolved issue. In this study, we propose a model in which residual pluripotency regulators create a permissive context for a mesodermal lineage regulator to selectively activate the downstream germ cell specification program.
Materials and Methods
Mice
All mice used in this study were bred and housed in the animal facility of the Max Planck Institute (MPI) in Muenster. Female mice were housed in groups of up to 5 per cage, and male mice were housed singly in individually ventilated, type II long cages under a 14‐h light/10‐h dark cycle with a controlled temperature of 22°C, 40–60% humidity, and free access to water and rodent chow. Procedures used in the present study followed the ethical and experimental recommendations of the German Society of Laboratory Animal Science. On the local regulatory level, mice were used for experiments according to the ethical approval issued by the Landesamt für Natur, Umwelt und Verbraucherschutz of the state of North Rhine‐Westphalia, Germany (permit nos. 84‐02.04.2016.A015, 81‐02.04.2017.A376, and 81‐02.04.2017.A493).
Cell culture
E3 GOF18‐EGFP male EpiSCs (F1 of homozygous GOF18‐EGFP [C57BL/6 and DBA/2 mixed background] and 129/Sv) were maintained as previously described in MEF‐conditioned medium (CM) (Xu et al, 2001) with 10 ng/ml FGF2 (CMF). For derivation of ESCs used in study bearing transgenes (Oct4/GOF18‐EGFP male ESCs, Oct4/GOF18∆PE‐EGFP male ESCs, Blimp1‐RFP (BR) male ESCs, stella‐GFP (SG) male ESCs, BRSG female ESCs, respectively), the blastocysts bearing transgenes were flushed out from the uterus at E3.5 and placed into a 96‐well plate for culture in N2B27 medium with 2i (1 μM PD0325901 and 3 μM CHIR99021) plus LIF (Ying et al, 2008) on mouse embryonic feeders (MEFs). After 6 to 10 days, the expanded inner cell mass was dissociated with TrypLE Express (Invitrogen) and passaged onto a new feeder layer. The ESCs were cultivated and propagated on MEFs until passage 4, followed by cryopreservation in STEM‐CELLBANKER (ZENOAQ). Frozen ESCs in a cryotube were thawed in a 37°C water bath, cultured, and maintained on a dish coated with 0.01% poly‐L‐ornithine (Sigma) and laminin (10 ng/ml; BD Biosciences) under a feeder‐free condition. For the reversion experiment, clonal EpiSC lines with stable integration of Tet‐on‐T (T‐V5‐GR) were generated and used (See the details of “establishment of stem cell lines” below.). For examination of T‐dependent disruption of naïve pluripotency, pooled (non‐clonal) ESC lines with stable integration of Tet‐on‐T (T‐V5‐GR‐2A‐H2BmCherry) were generated and used to enable the induction of T at various doses and the evaluation of the T‐dependent effect on naïve pluripotency. For the examination of pluripotency disruption by Oct4 deletion, ESC lines with stable integration of low T‐V5‐GR (Figs 3C and EV3G) were generated and used. For T‐PGCLC induction, clonal ESC lines with stable integration of Tet‐on‐T (low T‐V5‐GR) were used.
Vector construction
cDNA encoding V5‐tagged T and V5‐tagged Cdx2 were PCR‐amplified and inserted into pPBCAG‐GR vector (a gift from H. Niwa). Then, the T‐V5‐GR or Cdx2‐V5‐GR fragment was cloned into the PiggyBac‐based doxycycline (Dox)‐inducible vector (a gift from H. Niwa). For measurement of the level of induced T protein or CDX2 protein, 2A‐tagged H2BmCherry fragment was also PCR‐amplified and inserted together with the T‐V5‐GR or Cdx2‐V5‐GR fragment into the Dox‐inducible vector.
Tag‐free T, Cdx2, Gata4, Gata6, and Eomes cDNAs were cloned from the established vector construct or mouse cDNA pool. Then, cDNAs were inserted into PiggyBac‐based Dox‐inducible vectors together with the 2A‐tagged H2BmCherry fragment.
Establishment of stem cell lines with PiggyBac‐based Tet‐on inducible overexpression system
By using Lipofectamine 2000, the constructed vectors above were transfected into E3 EpiSCs, rE3, or 2iLIF ES cells (OCT4‐YFP, GOF18∆PE‐EGFP, Blimp1‐RFP [BR], stella‐GFP [SG], and BRSG ESCs, respectively), together with a pPyCAG‐PBase vector and a pPBCAG‐rtTA‐IRES‐Neo vector harboring a neomycin resistance gene. After 7–10 days of neomycin/G418 selection (250 μg/ml; Life Technologies), pooled or single clones were used for experiments.
Luciferase reporter assay
A genomic region containing the distal enhancer locus of Oct4 (Yeom et al, 1996) was amplified from the genomic DNA of E3 EpiSCs. Genomic regions containing T, OCT4, SOX2, and NANOG (OSNT) colocalized locus around Blimmp1 and Prdm14 were amplified from mouse Oct4 (GOF18)‐GFP ESC genomic DNA. The amplified DNAs were subcloned into a PiggyBAC‐based firefly luciferase reporter plasmid upstream of a minimal TK promoter (a gift from H. Niwa). Stable luciferase reporter ES cell lines (Oct4∆PE‐GFP ESCs and ZHBTc4 ESCs), which can overexpress T‐GR in response to Dox plus Dex (Oct4∆PE‐GFP ESCs with Dox‐inducible T‐GR‐2A‐mCherry‐overexpression system) or only Dex stimulation (ZHBTc4 ESCs with Dex‐inducible low T‐GR inducible system), were established.
To measure the transcriptional activity of the T‐binding site around the Oct4 distal enhancer, Nanog, and Klf4, cells for analysis were FACS‐sorted after 24 h of Dex plus Dox stimulation, followed by the reaction with Luciferase Assay Substrate (Promega) and measurement of transcriptional activity. Protein concentration of each cell lysate was measured by a Pierce 660 nm Protein Assay Kit (Thermo Scientific). The relative luciferase reporter activity in each sample was calculated by dividing luciferase activity by protein concentration and shown with SDs (three independent experiments with three technical replicates).
To measure the transcriptional activity of the OSNT‐colocalized locus, low T‐inducible ZHBTc4 ESCs were collected 24 h after Dex‐only or Dex plus Dox stimulation for the following luciferase reporter analysis as described above.
Assay for chimera contribution
T‐induced GFP‐positive E3 EpiSCs, rE3, and ESCs were dissociated with TrypLE Express (Invitrogen), and a single‐cell suspension was prepared 24 h after stimulation with Dox and Dex. For the following chimera formation assay, dissociated T‐induced PSCs were aggregated and cultured with denuded post‐compacted eight‐cell/morula‐stage mouse embryos obtained by mating B6C3(C57BL/6 × C3H)‐F1 female mice with CD‐1 male mice. Briefly, flushed eight‐cell embryos were placed in M2 medium and the zona pellucida was removed by short exposure to Tyrode's solution. Each denuded embryo was placed in a depression covered with a microdrop of KSOM medium under mineral oil. Eight to ten dissociated T‐induced cells were transferred on top of the embryos in the depressions. After overnight culture at 37°C, blastocysts were transferred into the uterine horns of 2.5‐dpc pseudopregnant foster mothers for further development. Then, developing embryos were collected at embryonic day 7.5 and dissociated with TrypLE Express for the following FACS analysis.
Tetraploid complementation assay
Tetraploid (4N) complementation was performed as described previously(Velychko et al, 2019). Briefly, two‐cell‐stage embryos were fused by applying electrical pulses. The fused embryos (tetraploid, 4N) were cultured for 24 h to the 4‐cell stage and aggregated with 15–20 TrypLE‐dissociated ESCs. The aggregates were cultivated at 37°C, 5% CO2 for 24 h and then transferred into the uterine horns of a 2.5‐dpc pseudopregnant recipient CD‐1 mice. Examination of germ cell contribution was performed by at least two independent mutant ESC lines.
Fluorescence‐activated cell sorting (FACS) analysis
EpiSCs, ESCs, and embryos were dissociated with TrypLE Express, washed with an equal volume of DMEM/F12 supplemented with 0.1% BSA, and then collected by centrifugation. The pellet was resuspended with PBS containing 0.1% BSA, followed by filtration using a cell strainer (70um, BD Biosciences) to remove large clumps of cells. The cells were sorted and analyzed on a flow cytometer (ARIA III; BD Biosciences). In all samples, cell population is initially identified on a FSC (size)/SSC (complexity) plot. Doublets were excluded using FSC‐W (Width)/SSC‐A (Area), followed by the further gating using SSC‐W (Width)/SSC‐H (Height) for the subsequent analysis and cell sorting.
ChIP‐qPCR
The preparation of ChIP‐DNA was performed essentially as described previously (Aramaki et al, 2013). V5‐tagged T‐induced Oct4‐GFP ESCs (equivalent to 1 × 10⁷ cells) were dissociated with TrypLE Express, washed, and collected by centrifugation. For crosslinking, the pellet was resuspended in PBS containing 1% formaldehyde, incubated for 20 min at 4°C, and quenched with 125 mM glycine. The fixed cells were resuspended in 1 ml of cold lysis buffer 1 (20 mM Tris, 10 mM NaCl, 2.5 mM MgCl2, 0.2% NP‐40, and 1 mM phenylmethylsulfonyl fluoride [PMSF], pH 7.5), rotated for 10 min at 4°C, and pelleted by centrifugation at 1,500×g for 5 min at 4°C. The pellet was resuspended in 1 ml of lysis buffer 2 (20 mM Tris, 200 mM NaCl, 1 mM EDTA, 0.5 mM EGTA, and 1 mM PMSF [pH 8.0]) and rotated for 10 min at 4°C. The nuclei were pelleted by centrifugation at 1,500 ×g for 5 min at 4°C and lysed in 400 μl of lysis buffer 3 (20 mM Tris, 150 mM NaCl, 1 mM EDTA, 0.5 mM EGTA, 1% Triton X‐100, 0.1% sodium deoxycholate, 0.1% SDS, 1 mM PMSF). The lysed nuclei were sonicated using a Bioruptor with high‐power output for 10 cycles (30 s ON and 30 s OFF at 0°C) × 4. Protein‐DNA complexes were then immunoprecipitated for 15 h at 4°C using 2 μg of mouse anti‐V5 antibody (V8012, Sigma‐Aldrich) bound to 50 μl of Dynabeads (M‐280 Sheep anti‐Mouse IgG, Invitrogen). For ChIP‐qPCR of OCT4, SOX2, and NANOG, 25 μl Dynabeads protein G coupled to 2 μg of goat anti‐OCT4 (sc‐8628, Santa Cruz), goat anti‐SOX2 (GT15098, Neuromics), and rabbit anti‐NANOG (A300‐397A, Bethyl Laboratories) were used, respectively. Immunoprecipitates were sequentially washed with 200 μl each of low‐salt buffer (0.1% SDS, 1% Triton X‐100, 2 mM EDTA, 20 mM Tris, and 150 mM NaCl [pH 8.0]), high‐salt buffer (0.1% SDS, 1% Triton X‐100, 2 mM EDTA, 20 mM Tris, and 500 mM NaCl [pH 8.0]), RIPA buffer (50 mM HEPES‐KOH, 0.5 M LiCl, 1 mM EDTA, 0.5% Na‐Deoxycholate, and 1% NP‐40 [pH 7.4]), and TE buffer (10 mM Tris and 10 mM EDTA [pH 8.0]). For collection of the protein‐DNA complexes, beads were resuspended with 50 μl of elution buffer (100 mM NaHCO3, 1% SDS, and 10 mM dithiothreitol). The crosslink for both the immunoprecipitated and input DNA fragments was reversed by incubating at 65°C for 5 h. After proteinase K digestion, the DNA was purified by using a Nucleospin gel and PCR clean‐up (MACHEREY‐NAGEL) and dissolved with TE buffer. ChIP‐qPCR was performed by iTaq Universal SYBR Green Supermix (Bio‐Rad) on QuantStudio 5 Real‐Time PCR System. The enrichment was measured by the percent input with SDs (three independent experiments with two technical replicates). The primer sequences used are listed in Table EV2.
ChIP sequence and data analysis
To prepare the DNA library for massively parallel sequencing, sonicated DNA fragments were end‐repaired, ligated to sequencing adapters, and amplified according to the manufacturer’s instructions (NEBNext Ultra II DNA library Prep Kit for Illumina [E7645]). The purified library was sequenced on the Illumina Nextseq 500 platform to generate paired‐end 75‐bp reads. The resultant sequence reads were aligned to the mm10 mouse reference genome using Bowtie2 (Langmead & Salzberg, 2012) with default parameters. Data were visualized using IGV software (Thorvaldsdottir et al, 2013). Peak‐calling analysis and the following annotation and motif analysis were performed using HOMER software with default parameters. Input DNA was used as controls.
qPCR analysis
Total RNA was isolated using a NucleoSpin RNA Mini kit (MACHEREY‐NAGEL) and was reverse‐transcribed by M‐MLV Reverse Transcriptase (USB). Real‐time PCR was performed using iTaq Universal SYBR Green Supermix (Bio‐Rad) on the QuantStudio 5 Real‐Time PCR System. Gene expression was normalized to the housekeeping genes Arbp and Ppia and calculated using the delta Ct algorithm. More specifically, the ∆Ct values from the average Ct values of Arbp and Ppia were calculated (log2 scale, the mean value of two independent experiments with two technical replicates). The primer sequences used are listed in Table EV2. For qPCR analysis of in vivo PGCs and somatic cells at post‐implantation stages, embryos at embryonic days 7.0–7.5 were isolated. Embryos were then incubated in Eagle’s balanced salt solution (EBSS; Invitrogen) containing 0.5% trypsin and 2.5% pancreatin for 5 min on ice to remove the visceral endoderm followed by the subsequent dissociation by TrypLE express for FACS analysis. Ten FACS‐sorted cells in different cell fraction were respectively collected in a PCR tube and subjected to the previous cDNA amplification method (Nakamura et al, 2015) for the following qPCR analysis.
RNA sequence
Total RNAs from sorted T‐induced OCT4‐YFP ESCs, T‐induced ZHBTc4 ESCs, T‐PGCLCs, and BRSG ESCs were extracted using a NucleoSpin RNA Mini kit (MACHEREY‐NAGEL). Then, secondary RNA‐purification was performed using NEB Next Poly A m‐RNA magnetic bead selection kit (E7490), and each cDNA library was prepared using NEBNext Ultra II RNA Library Prep Kit for Illumina (E7770). Sequencing was done by Illumina Nextseq 500 platform with paired‐end 75‐bp reads. Sequenced reads were aligned to the mm10 reference genome using Bowtie2 (Langmead & Salzberg, 2012) with default parameters. Rsubread R package (Liao et al, 2019) was used to count the number of RNA‐seq reads. Screening the differentially expressed genes, clustering analysis, and PCA analysis were performed using DESeq2 (Love et al, 2014) on iDEP9.1 platform (Ge et al, 2018). Functional enrichment analysis was performed on Metascape (Zhou et al, 2019). Gplots R packages were used to plot the heatmaps.
Western blot analysis
For the Western blot analysis, 5 × 10⁴ cells from each sample were lysed in the SDS sample buffer (62.5 mM Tris–HCl [pH 6.8], 2% SDS, 10% glycerol, 0.025% bromophenol blue, and 0.14 M β‐mercaptoethanol) at 95°C for 5 min. For the Western blot analysis of high T fractions (Fig EV4E), 1 × 10³ cells derived from the high T fraction of T‐GFP embryos (Fig 4E) or T‐V5‐2A‐H2BmCherry (Appendix Fig S1C) were FACS‐sorted and then subjected to the analysis. Proteins were separated on the 10% acrylamide gel, blotted onto an Immobilon‐P transfer membrane (Millipore), and incubated with primary antibodies (See Table EV2). Primary antibodies were detected with the secondary antibodies conjugated with HRP (Jackson Immunoresearch), followed by detection using ECL‐prime (GE Healthcare). GAPDH was used as a loading control. The band intensity of the examined proteins was quantified by ImageJ software. The band intensity of each detected protein was normalized by the intensity of GAPDH.
Reversion/reprogramming of EpiSCs
For reversion of E3 EpiSCs, T‐inducible EpiSCs cultured on MEFs in CMF were dissociated using TrypLE Express (Invitrogen) and GFP‐positive and GFP‐negative cells were sorted by FACS. Sorted cells were cultured under a floating condition by plating 2 × 10³ cells in a well of a Ultra Low Cluster round‐bottom 96‐well plate (COSTAR) in CMF. For T induction, cells were stimulated with Dox (1 μg/ml) plus Dex (100 mM). After 24 h, cultured cells were dissociated by TrypLE Express and seeded as a single‐cell suspension at 1 × 10³ cells per well per 24‐well plate in CM with 5 μM Y‐27362 and 10 ng/ml FGF2. Again after 24 h, the medium was changed to 2iLIF medium and the cells were cultured for 5 days. On day 5, alkaline phosphatase‐positive‐reverted cell colonies were scored under a microscope, and the number of GFP‐positive cells was counted by FACS.
For reversion of T‐knockout E3 EpiSCs, EpiSCs cultured in CMF without MEF feeders were dissociated and 250 cells were re‐seeded on MEFs in CMF. We confirmed by FACS that E3 EpiSCs were all GFP‐negative in the MEF‐free condition. Then, reversion of EpiSCs was performed as described above.
PGCLC induction
PGCLCs were induced as described previously (Hayashi et al, 2011). Briefly, 5 × 10⁴ ESCs were cultured in a well of a 24‐well plate coated with human plasma fibronectin (16.7 μg/ml) in N2B27 medium containing Activin A (20 ng/ml), bFGF (12 ng/ml), and KSR (1%). After 24 h, the medium was changed, and the cells were cultured for another 24 h. The resultant EpiLCs were then cultured under a floating condition by plating 2 × 10³ cells in a well of a Ultra Low Cluster round‐bottom 96‐well plate (COSTAR) in a GK15 medium in the presence of the cytokines; BMP4 (500 ng/ml), SCF (100 ng/ml), EGF (50 ng/ml), and LIF (1,000 µg/ml). In order to block the BMP and WNT signaling for inhibition of PGCLC induction by chemicals, LDN193189 (120 pM) and XAV939 (1 µM) were utilized, respectively.
Generation of mutant EpiSCs and ESCs by CRISPR/Cas9
Mutant lines of EpiSCs and ESCs were generated by the CRISPR/Cas9 system (Cong et al, 2013; Mali et al, 2013; Slaymaker et al, 2016). sgRNA oligonucleotides were subcloned into the downstream of the human U6 promoter of pX330A‐GFPT2APuro (modified from Addgene #42230, a gift from Feng Zhang) (Adachi et al, 2018). To generate T‐knockout (KO) EpiSCs and Prdm14‐KO ESCs, two sgRNAs were designed for each gene to delete critical exons, leading to frameshift mutations.
For generation of mutants of Blimp1 or Prdm14 genomic locus, two sgRNAs were designed to delete each locus.
Constructed plasmids were transfected into cells using Lipofectamine 2000, followed by the selection with puromycin (1 μg/ml) for 2 days. Selected clones bearing homozygous deletions were determined by sequencing of the genomic PCR products. Sequences of sgRNA oligonucleotide used in this study are listed in Table EV1.
Quantification and statistical analysis
Gene expression measured by qPCR (Figs 4C and F, 5D, EV1F, 2A and 3G, Appendix Fig S3B–D, Fig 5E) was normalized to the housekeeping genes (Arbp and Ppia) and calculated using the delta Ct algorithm. The ∆Ct values from the average Ct values of Arbp and Ppia were calculated (log2 scale, n ≥ 2). For ChIP‐qPCR (Figs 3A, 5B and D, and EV3G), the enrichment was measured by the percent input with SDs (three independent experiments with two technical replicates). For statistical analysis, P‐values were calculated by two‐tailed unpaired t‐test. For luciferase reporter assay (Figs 3B and 5C), the relative luciferase reporter activity was calculated by dividing luciferase activity by protein concentration and shown with SDs (three independent experiments with three technical replicates). For quantification of Western blot data (Figs 1D, EV1E and EV4E), the band intensity of the examined proteins was quantified by ImageJ software and then normalized by the intensity of GAPDH. To screen the differentially expressed genes (DEGs) (Fig 3D), DEGs with log2 fold‐change > 1; P‐value < 0.1 were selected by DESeq2.
Author contributions
SA designed the study, performed the experiments, and wrote the manuscript; SK provided critical input for the design of the manuscript; SA, SK, and EK contributed to the sequencing data analysis; SA, DO, and GW performed the mice experiments; KA contributed to the vector construction; DO proofread the manuscript; HL provided the reporter mouse line. SK, GW, KA, and KH provided critical advice on the experiments; and HRS supervised the study.
Conflict of interest
The authors declare that they have no conflict of interest.
Supporting information
Appendix
Expanded View Figures PDF
Table EV1
Table EV2
Dataset EV1
Dataset EV2
Dataset EV3
Source Data for Expanded View
Review Process File
Source Data for Figure 1
Source Data for Figure 2
Acknowledgements
We are grateful to A. Surani, K. Abe, and H. Niwa for stella‐GFP, Blimp1‐RFP mice, and OCT‐YFP ESCs, respectively. We thank M. Stehling, Y. Hou, M. Boiani, M. Sinn, J. Müller‐Keuker, and H.W. Jeong for assistance. We thank B. Greber and C. Bernemann for critical suggestions from their previous findings. We thank Areti Malapetsas for editing. This work was funded by the European Research Council (ERC) under the European Union’s Horizon 2020 research and innovation program (grant agreement No [669168]) and resources of the Max Planck Society. Open access funding enabled and organized by Projekt DEAL.
EMBO reports (2021) 22: e52553.
Data availability
The datasets generated during and/or analyzed during the current study are available from the corresponding author on reasonable request. The accession numbers for the ChIP‐seq and RNA‐seq datasets reported in this paper are ArrayExpress (https://www.ebi.ac.uk/arrayexpress): E‐MTAB‐9490 and E‐MTAB‐9494, respectively.
References
- Abe K, Yamamura K, Suzuki M (2000) Molecular and embryological characterization of a new transgene‐induced null allele of mouse Brachyury locus. Mamm Genome 11: 238–240 [DOI] [PubMed] [Google Scholar]
- Adachi K, Kopp W, Wu G, Heising S, Greber B, Stehling M, Arauzo‐Bravo MJ, Boerno ST, Timmermann B, Vingron M et al (2018) Esrrb unlocks silenced enhancers for reprogramming to naïve pluripotency. Cell Stem Cell 23: 266–275 e266 [DOI] [PubMed] [Google Scholar]
- Aramaki S, Hayashi K, Kurimoto K, Ohta H, Yabuta Y, Iwanari H, Mochizuki Y, Hamakubo T, Kato Y, Shirahige K et al (2013) A mesodermal factor, T, specifies mouse germ cell fate by directly activating germline determinants. Dev Cell 27: 516–529 [DOI] [PubMed] [Google Scholar]
- Bao S, Tang F, Li X, Hayashi K, Gillich A, Lao K, Surani MA (2009) Epigenetic reversion of post‐implantation epiblast to pluripotent embryonic stem cells. Nature 461: 1292–1295 [DOI] [PMC free article] [PubMed] [Google Scholar]
- Bernemann C, Greber B, Ko K, Sterneckert J, Han DW, Arauzo‐Bravo MJ, Scholer HR (2011) Distinct developmental ground states of epiblast stem cell lines determine different pluripotency features. Stem Cells 29: 1496–1503 [DOI] [PubMed] [Google Scholar]
- Brons IG, Smithers LE, Trotter MW, Rugg‐Gunn P, Sun B, de Sousa C , Lopes SM, Howlett SK, Clarkson A, Ahrlund‐Richter L et al (2007) Derivation of pluripotent epiblast stem cells from mammalian embryos. Nature 448: 191–195 [DOI] [PubMed] [Google Scholar]
- Burtscher I, Lickert H (2009) Foxa2 regulates polarity and epithelialization in the endoderm germ layer of the mouse embryo. Development 136: 1029–1038 [DOI] [PubMed] [Google Scholar]
- Chatfield J, O'Reilly MA, Bachvarova RF, Ferjentsik Z, Redwood C, Walmsley M, Patient R, Loose M, Johnson AD (2014) Stochastic specification of primordial germ cells from mesoderm precursors in axolotl embryos. Development 141: 2429–2440 [DOI] [PMC free article] [PubMed] [Google Scholar]
- Chesley P (1935) Development of the short‐tailed mutant in the house mouse. J Exp Zool 70: 429–459 [Google Scholar]
- Chiquoine AD (1954) The identification, origin, and migration of the primordial germ cells in the mouse embryo. Anat Rec 118: 135–146 [DOI] [PubMed] [Google Scholar]
- Cong L, Ran Fa, Cox D, Lin S, Barretto R, Habib N, Hsu Pd, Wu X, Jiang W, Marraffini La et al (2013) Multiplex genome engineering using CRISPR/Cas systems. Science 339: 819–823 [DOI] [PMC free article] [PubMed] [Google Scholar]
- Evans MJ, Kaufman MH (1981) Establishment in culture of pluripotential cells from mouse embryos. Nature 292: 154–156 [DOI] [PubMed] [Google Scholar]
- Ewen‐Campen B, Donoughe S, Clarke DN, Extavour CG (2013) Germ cell specification requires zygotic mechanisms rather than germ plasm in a basally branching insect. Curr Biol 23: 835–842 [DOI] [PubMed] [Google Scholar]
- Extavour CG, Akam M (2003) Mechanisms of germ cell specification across the metazoans: epigenesis and preformation. Development 130: 5869–5884 [DOI] [PubMed] [Google Scholar]
- Fujikura J, Yamato E, Yonemura S, Hosoda K, Masui S, Nakao K, Miyazaki Ji J, Niwa H (2002) Differentiation of embryonic stem cells is induced by GATA factors. Genes Dev 16: 784–789 [DOI] [PMC free article] [PubMed] [Google Scholar]
- Ge SX, Son EW, Yao R (2018) iDEP: an integrated web application for differential expression and pathway analysis of RNA‐Seq data. BMC Bioinformatics 19: 534 [DOI] [PMC free article] [PubMed] [Google Scholar]
- Ginsburg M, Snow MH, McLaren A (1990) Primordial germ cells in the mouse embryo during gastrulation. Development 110: 521–528 [DOI] [PubMed] [Google Scholar]
- Gluecksohn‐Schoenheimer S (1938) The development of two tailless mutants in the house mouse. Genetics 23: 573–584 [DOI] [PMC free article] [PubMed] [Google Scholar]
- Gluecksohn‐Schoenheimer S (1944) The development of normal and homozygous brachy (T/T) mouse embryos in the extraembryonic coelom of the chick. Proc Natl Acad Sci USA 30: 134–140 [DOI] [PMC free article] [PubMed] [Google Scholar]
- Greber B, Wu G, Bernemann C, Joo JY, Han DW, Ko K, Tapia N, Sabour D, Sterneckert J, Tesar P et al (2010) Conserved and divergent roles of FGF signaling in mouse epiblast stem cells and human embryonic stem cells. Cell Stem Cell 6: 215–226 [DOI] [PubMed] [Google Scholar]
- Guo G, Smith A (2010) A genome‐wide screen in EpiSCs identifies Nr5a nuclear receptors as potent inducers of ground state pluripotency. Development 137: 3185–3192 [DOI] [PMC free article] [PubMed] [Google Scholar]
- Guo G, Yang J, Nichols J, Hall JS, Eyres I, Mansfield W, Smith A (2009) Klf4 reverts developmentally programmed restriction of ground state pluripotency. Development 136: 1063–1069 [DOI] [PMC free article] [PubMed] [Google Scholar]
- Hackett JA, Kobayashi T, Dietmann S, Surani MA (2017) Activation of lineage regulators and transposable elements across a pluripotent spectrum. Stem Cell Rep 8: 1645–1658 [DOI] [PMC free article] [PubMed] [Google Scholar]
- Han DW, Tapia N, Joo JY, Greber B, Araúzo‐Bravo MJ, Bernemann C, Ko K, Wu G, Stehling M, Do JT et al (2010) Epiblast stem cell subpopulations represent mouse embryos of distinct pregastrulation stages. Cell 143: 617–627 [DOI] [PubMed] [Google Scholar]
- Hanna J, Markoulaki S, Mitalipova M, Cheng AW, Cassady JP, Staerk J, Carey BW, Lengner CJ, Foreman R, Love J et al (2009) Metastable pluripotent states in NOD‐mouse‐derived ESCs. Cell Stem Cell 4: 513–524 [DOI] [PMC free article] [PubMed] [Google Scholar]
- Hayashi K, Ohta H, Kurimoto K, Aramaki S, Saitou M (2011) Reconstitution of the mouse germ cell specification pathway in culture by pluripotent stem cells. Cell 146: 519–532 [DOI] [PubMed] [Google Scholar]
- Herrmann BG, Labeit S, Poustka A, King TR, Lehrach H (1990) Cloning of the T gene required in mesoderm formation in the mouse. Nature 343: 617–622 [DOI] [PubMed] [Google Scholar]
- Hikabe O, Hamazaki N, Nagamatsu Go, Obata Y, Hirao Y, Hamada N, Shimamoto So, Imamura T, Nakashima K, Saitou M et al (2016) Reconstitution in vitro of the entire cycle of the mouse female germ line. Nature 539: 299–303 [DOI] [PubMed] [Google Scholar]
- Inman KE, Downs KM (2006) Brachyury is required for elongation and vasculogenesis in the murine allantois. Development 133: 2947–2959 [DOI] [PubMed] [Google Scholar]
- Johnson AD, Richardson E, Bachvarova RF, Crother BI (2011) Evolution of the germ line‐soma relationship in vertebrate embryos. Reproduction 141: 291–300 [DOI] [PubMed] [Google Scholar]
- Kurimoto K, Yabuta Y, Ohinata Y, Shigeta M, Yamanaka K, Saitou M (2008) Complex genome‐wide transcription dynamics orchestrated by Blimp1 for the specification of the germ cell lineage in mice. Genes Dev 22: 1617–1635 [DOI] [PMC free article] [PubMed] [Google Scholar]
- Langmead B, Salzberg SL (2012) Fast gapped‐read alignment with Bowtie 2. Nat Methods 9: 357–359 [DOI] [PMC free article] [PubMed] [Google Scholar]
- Lawson KA, Dunn NR, Roelen BA, Zeinstra LM, Davis AM, Wright CV, Korving JP, Hogan BL (1999) Bmp4 is required for the generation of primordial germ cells in the mouse embryo. Genes Dev 13: 424–436 [DOI] [PMC free article] [PubMed] [Google Scholar]
- Liao Y, Smyth GK, Shi W (2019) The R package Rsubread is easier, faster, cheaper and better for alignment and quantification of RNA sequencing reads. Nucleic Acids Res 47: e47 [DOI] [PMC free article] [PubMed] [Google Scholar]
- Lolas M, Valenzuela PD, Tjian R, Liu Z (2014) Charting Brachyury‐mediated developmental pathways during early mouse embryogenesis. Proc Natl Acad Sci USA 111: 4478–4483 [DOI] [PMC free article] [PubMed] [Google Scholar]
- Love MI, Huber W, Anders S (2014) Moderated estimation of fold change and dispersion for RNA‐seq data with DESeq2. Genome Biol 15: 550 [DOI] [PMC free article] [PubMed] [Google Scholar]
- Magnusdottir E, Dietmann S, Murakami K, Gunesdogan U, Tang F, Bao S, Diamanti E, Lao K, Gottgens B, Azim Surani M (2013) A tripartite transcription factor network regulates primordial germ cell specification in mice. Nat Cell Biol 15: 905–915 [DOI] [PMC free article] [PubMed] [Google Scholar]
- Mali P, Aach J, Stranges PB, Esvelt KM, Moosburner M, Kosuri S, Yang L, Church GM (2013) CAS9 transcriptional activators for target specificity screening and paired nickases for cooperative genome engineering. Nat Biotechnol 31: 833–838 [DOI] [PMC free article] [PubMed] [Google Scholar]
- Martin GR (1981) Isolation of a pluripotent cell line from early mouse embryos cultured in medium conditioned by teratocarcinoma stem cells. Proc Natl Acad Sci USA 78: 7634–7638 [DOI] [PMC free article] [PubMed] [Google Scholar]
- Murakami K, Gunesdogan U, Zylicz JJ, Tang WWC, Sengupta R, Kobayashi T, Kim S, Butler R, Dietmann S, Surani MA (2016) NANOG alone induces germ cells in primed epiblast in vitro by activation of enhancers. Nature 529: 403–407 [DOI] [PMC free article] [PubMed] [Google Scholar]
- Nakaki F, Hayashi K, Ohta H, Kurimoto K, Yabuta Y, Saitou M (2013) Induction of mouse germ‐cell fate by transcription factors in vitro. Nature 501: 222–226 [DOI] [PubMed] [Google Scholar]
- Nakamura T, Yabuta Y, Okamoto I, Aramaki S, Yokobayashi S, Kurimoto K, Sekiguchi K, Nakagawa M, Yamamoto T, Saitou M (2015) SC3‐seq: a method for highly parallel and quantitative measurement of single‐cell gene expression. Nucleic Acids Res 43: e60 [DOI] [PMC free article] [PubMed] [Google Scholar]
- Niwa H, Miyazaki J, Smith AG (2000) Quantitative expression of Oct‐3/4 defines differentiation, dedifferentiation or self‐renewal of ES cells. Nat Genet 24: 372–376 [DOI] [PubMed] [Google Scholar]
- Niwa H, Toyooka Y, Shimosato D, Strumpf D, Takahashi K, Yagi R, Rossant J (2005) Interaction between Oct3/4 and Cdx2 determines trophectoderm differentiation. Cell 123: 917–929 [DOI] [PubMed] [Google Scholar]
- Ohinata Y, Ohta H, Shigeta M, Yamanaka K, Wakayama T, Saitou M (2009) A signaling principle for the specification of the germ cell lineage in mice. Cell 137: 571–584 [DOI] [PubMed] [Google Scholar]
- Ohinata Y, Payer B, O'Carroll D, Ancelin K, Ono Y, Sano M, Barton SC, Obukhanych T, Nussenzweig M, Tarakhovsky A et al (2005) Blimp1 is a critical determinant of the germ cell lineage in mice. Nature 436: 207–213 [DOI] [PubMed] [Google Scholar]
- Payer B, de Sousa C , Lopes SM, Barton SC, Lee C, Saitou M, Surani MA (2006) Generation of stella‐GFP transgenic mice: a novel tool to study germ cell development. Genesis 44: 75–83 [DOI] [PubMed] [Google Scholar]
- Showell C, Binder O, Conlon FL (2004) T‐box genes in early embryogenesis. Dev Dyn 229: 201–218 [DOI] [PMC free article] [PubMed] [Google Scholar]
- Silva J, Nichols J, Theunissen TW, Guo G, van Oosten AL , Barrandon O, Wray J, Yamanaka S, Chambers I, Smith A (2009) Nanog is the gateway to the pluripotent ground state. Cell 138: 722–737 [DOI] [PMC free article] [PubMed] [Google Scholar]
- Slaymaker IM, Gao L, Zetsche B, Scott DA, Yan WX, Zhang F (2016) Rationally engineered Cas9 nucleases with improved specificity. Science 351: 84–88 [DOI] [PMC free article] [PubMed] [Google Scholar]
- Sugimoto M, Abe K (2007) X chromosome reactivation initiates in nascent primordial germ cells in mice. PLoS Genet 3: e116 [DOI] [PMC free article] [PubMed] [Google Scholar]
- Tesar PJ, Chenoweth JG, Brook FA, Davies TJ, Evans EP, Mack DL, Gardner RL, McKay RD (2007) New cell lines from mouse epiblast share defining features with human embryonic stem cells. Nature 448: 196–199 [DOI] [PubMed] [Google Scholar]
- Thorvaldsdottir H, Robinson JT, Mesirov JP (2013) Integrative Genomics Viewer (IGV): high‐performance genomics data visualization and exploration. Brief Bioinform 14: 178–192 [DOI] [PMC free article] [PubMed] [Google Scholar]
- Toyooka Y, Shimosato D, Murakami K, Takahashi K, Niwa H (2008) Identification and characterization of subpopulations in undifferentiated ES cell culture. Development 135: 909–918 [DOI] [PubMed] [Google Scholar]
- Velychko S, Adachi K, Kim KP, Hou Y, MacCarthy CM, Wu G, Scholer HR (2019) Excluding Oct4 from yamanaka cocktail unleashes the developmental potential of iPSCs. Cell Stem Cell 25: 737–753.e4 [DOI] [PMC free article] [PubMed] [Google Scholar]
- Winnier G, Blessing M, Labosky PA, Hogan BL (1995) Bone morphogenetic protein‐4 is required for mesoderm formation and patterning in the mouse. Genes Dev 9: 2105–2116 [DOI] [PubMed] [Google Scholar]
- Xu C, Inokuma MS, Denham J, Golds K, Kundu P, Gold JD, Carpenter MK (2001) Feeder‐free growth of undifferentiated human embryonic stem cells. Nat Biotechnol 19: 971–974 [DOI] [PubMed] [Google Scholar]
- Yamaji M, Ueda J, Hayashi K, Ohta H, Yabuta Y, Kurimoto K, Nakato R, Yamada Y, Shirahige K, Saitou M (2013) PRDM14 ensures naïve pluripotency through dual regulation of signaling and epigenetic pathways in mouse embryonic stem cells. Cell Stem Cell 12: 368–382 [DOI] [PubMed] [Google Scholar]
- Yeom YI, Fuhrmann G, Ovitt CE, Brehm A, Ohbo K, Gross M, Hubner K, Scholer HR (1996) Germline regulatory element of Oct‐4 specific for the totipotent cycle of embryonal cells. Development 122: 881–894 [DOI] [PubMed] [Google Scholar]
- Ying QL, Wray J, Nichols J, Batlle‐Morera L, Doble B, Woodgett J, Cohen P, Smith A (2008) The ground state of embryonic stem cell self‐renewal. Nature 453: 519–523 [DOI] [PMC free article] [PubMed] [Google Scholar]
- Zhang J, Zhang M, Acampora D, Vojtek M, Yuan D, Simeone A, Chambers I (2018) OTX2 restricts entry to the mouse germline. Nature 562: 595–599 [DOI] [PMC free article] [PubMed] [Google Scholar]
- Zhou Y, Zhou B, Pache L, Chang M, Khodabakhshi AH, Tanaseichuk O, Benner C, Chanda SK (2019) Metascape provides a biologist‐oriented resource for the analysis of systems‐level datasets. Nat Commun 10: 1523 [DOI] [PMC free article] [PubMed] [Google Scholar]
Associated Data
This section collects any data citations, data availability statements, or supplementary materials included in this article.
Supplementary Materials
Appendix
Expanded View Figures PDF
Table EV1
Table EV2
Dataset EV1
Dataset EV2
Dataset EV3
Source Data for Expanded View
Review Process File
Source Data for Figure 1
Source Data for Figure 2
Data Availability Statement
The datasets generated during and/or analyzed during the current study are available from the corresponding author on reasonable request. The accession numbers for the ChIP‐seq and RNA‐seq datasets reported in this paper are ArrayExpress (https://www.ebi.ac.uk/arrayexpress): E‐MTAB‐9490 and E‐MTAB‐9494, respectively.