

INTRODUCTION:
The expression of LGR5, a known stem cell marker, is poorly understood in Barrett's esophagus (BE) and related neoplasia. The aim of this study was to evaluate LGR5 in BE and related neoplasia and to evaluate its utility as a potential biomarker of progression to advanced neoplasia.
METHODS:
We evaluated total 137 patients, including 119 with BE and 18 with normal gastroesophageal mucosa for expression of LGR5 using RNA in situ hybridization; this also included 28 progressors and 30 nonprogressors. The LGR5 stain was evaluated using 1 qualitative and 2 quantitative parameters, using manual and automated platforms.
RESULTS:
Surface LGR5 expression was mainly seen in high-grade dysplasia (12/18) compared with low-grade dysplasia (1/8) and nondysplastic BE (0/17) (P < 0.0001). In contrast to nondysplastic BE, low- and high-grade dysplasia showed a higher percentage of mean number of LGR5-positive crypts per patient (P < 0.0001) and an increase in the mean number of LGR5 transcripts per cell (P < 0.0001). The mean percentage of LGR5-positive crypts per patient and the mean number of LGR5 transcripts per cell were also significantly higher in nondysplastic BE from progressor compared with nonprogressor (P < 0.0001, P = 0.014). The sensitivity and specificity of LGR5 for distinguishing progressor from nonprogressor were 50% and 87%, respectively.
DISCUSSION:
BE-related advanced neoplasia shows an expansion of the LGR5-positive cellular compartment, supporting its role as a stem cell marker in this disease. Quantitative LGR5 expression and surface epithelial reactivity are novel biomarkers of increased risk of progression to advanced neoplasia in BE.
INTRODUCTION
Leucine-rich repeat-containing G-protein–coupled receptor 5 (LGR5) encodes a G-protein–coupled receptor that potentiates the WNT signaling pathway through interaction with its ligand, R-spondin (1). LGR5 is involved in embryonic development and has been shown to modulate and enhance the canonical WNT signaling pathway (2–4). Precise in vivo fate mapping in murine models has demonstrated that LGR5-positive cells self-renew, differentiate, and contribute to the long-term renewal of intestinal epithelium (5). LGR5 is a robust stem cell marker in the normal human small intestine, colon, and stomach (5,6). Metaplastic esophageal columnar epithelium recapitulates the stomach, colonic, and small bowel mucosa, and not uncommonly, a combination of all 3 epithelial types, and it stands to reason that LGR5-positive cells have also been implicated in the genesis of Barrett's esophagus (BE) (7–9).
Several studies have evaluated and, subsequently, provided support for LGR5 in neoplastic progression. For instance, deletion of APC in LGR5-positive cells was related to the development of intestinal adenomas (5). LGR5 has also been shown to be diffusely overexpressed in colonic adenomas and adenocarcinomas and a range of other gastrointestinal and nongastrointestinal malignancies (10–16). These data raise the additional possibility that LGR5 expression in Barrett's epithelium may help predict progression to advanced neoplasia.
LGR5 has not been evaluated in BE in terms of its potential usefulness as a predictive marker. In addition, although several markers have been proposed for the diagnosis of dysplasia, they are generally cumbersome, and automated analysis systems have not been fully developed.
The purpose of this study was to evaluate the prevalence and localization of LGR5 in normal, metaplastic, and neoplastic esophageal epithelium and to examine the utility of LGR5 as a potential predictor of progression to advanced neoplasia in this condition.
MATERIALS AND METHODS
Study group
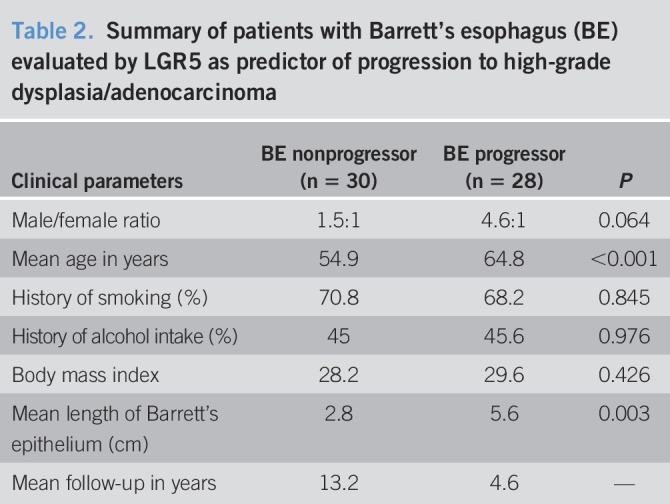
This is a retrospective study comprising 137 consecutive patients, of which 119 had BE. The other 18 consisted of specimens from patients without BE (12 normal gastric cardia and 6 normal esophagus). The 119 patients with BE consisted of 2 groups. The first group comprised 61 patients with BE and included 17 who lacked dysplasia, 8 with low-grade dysplasia, 18 with high-grade dysplasia, and 18 with adenocarcinoma (Table 1). All these 61 patients, and the 18 patients without BE, were used to evaluate qualitative and quantitative expression of LGR5. The second group of 58 patients was chosen specifically to evaluate LGR5 as a predictive marker of progression to advanced neoplasia (high-grade dysplasia or adenocarcinoma). Over the course of long-term follow-up, 28 patients with BE progressed to high-grade dysplasia or adenocarcinoma and 30 did not. In both BE groups (progressors and nonprogressors), LGR5 expression was evaluated on an index BE biopsy without dysplasia (Table 2). Within the progressor group (N = 28), the mean duration between the nondysplastic biopsy and the outcome neoplastic biopsy was 4.6 years (range 0.5–15 years). In the nonprogressor group (N = 30), the mean duration between the index Barrett's biopsy and the most recent biopsy was 13.2 years (range 10–15 years) (Table 2).
Table 1.
Summary of patients evaluated by LGR5

Table 2.
Summary of patients with Barrett's esophagus (BE) evaluated by LGR5 as predictor of progression to high-grade dysplasia/adenocarcinoma
Histologic methods
In this retrospective study, all cases were categorized as either negative for dysplasia, low-grade dysplasia, high-grade dysplasia, or adenocarcinoma by 2 experienced gastrointestinal pathologists (V.D. and R.D.O.) who were blinded to the original diagnosis as well as the LGR5 and outcome data. Discrepancies in histological diagnosis among both pathologists were resolved on multiheaded microscope.
In Situ hybridization
Branch chain in situ hybridization for LGR5 was performed on paraffin-embedded tissue (Affymetrix, Santa Clara, CA [cross-sectional group], and RNAScope 2.5 LS, Advanced Cell Diagnostics, Hayward, CA [progression group]) as previously published (12,17,18). In situ hybridization showed distinct individual dots corresponding to target mRNA loci, allowing for quantitative analysis. Negative control involved targeting the bacterial gene dapB. Biopsies lacking preserved mRNA, i.e., significantly lower expression of GAPDH on in situ hybridization than the rest of the cohort, were not included in the study. Ten cases were excluded on the basis of a low GAPDH expression.
We examined the LGR5 stain both qualitatively (localization of signal in the epithelium of interest) and quantitatively. In this manner, we assessed the following 3 parameters: (i) qualitative presence of LGR5 in surface epithelium, (ii) percentage of LGR5-positive crypts in a single high-power field of mucosa that contained the highest number of LGR5-positive crypts (a crypt was considered positive when it showed ≥5 LGR5 transcripts), and (iii) the mean number of LGR5 transcripts per cell, measured in 5 crypts that contained the highest number of LGR5 transcripts (Figure 1). Of note, the pathologist reviewing LGR5 was blinded for the location of biopsy as well as the presence of dysplasia or progression status.
Figure 1.
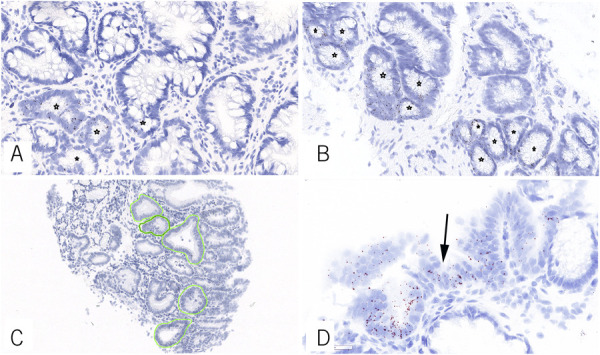
Representative example of biopsies with <50% (a) and >50% LGR5-positive crypt per high-power field (b) for LGR5 in Barrett's esophagus (in situ hybridization, Brown chromogen, asterisks indicate LGR5 positive crypts.). Mean numbers of LGR5 transcripts per cell were determined by evaluating 5 crypts (c). Surface epithelium LGR5 reactivity (d) was diagnostic of dysplasia and predicted progression to dysplasia (arrow indicates surface epithelium).
We also performed a quantitative analysis on the distal most biopsies from BE progressor and nonprogressor patients. The slides were scanned at 40X using Aperio ScanScope digital slide scanner (Aperio ScanScope CSO, Leica Biosystems Imaging, CA). In this manner, we annotated 5 crypts with the highest number of signals and recorded the number of LGR5-positive transcripts per cells using HALO image analysis platform (HALO 2.3; Indica Laboratories, NM) (see Supplementary Figure 1, Supplementary Digital Content 1, http://links.lww.com/CTG/A475).
Statistics
Data were analyzed with SPSS statistical software (version 21). The Levene test for homogeneity of variance and 1-way ANOVA to compare mean values among multiple groups were performed. Categorical data were analyzed using the χ2 test. An optimum cut point for percentage of LGR5-positive crypts and mean number of LGR5 transcripts per cells for its diagnostic efficacy was derived from receiver operating characteristic (ROC) curve. Confidence intervals were calculated using a significance level (alpha) of 0.05.
RESULTS
Qualitative analysis of LGR5 expression in normal gastric cardia, normal esophagus, BE, and associated advanced neoplasia
LGR5 expression was evaluated in esophageal squamous mucosa and normal gastric cardia in 6 and 12 cases, respectively. In gastric cardia, LGR5 expression was confined to the bases of the crypts (see Supplementary Figure 2, Supplementary Digital Content 2, http://links.lww.com/CTG/A476). Surface expression was not identified in the normal cardiac mucosa of the stomach (0/12). LGR5 staining was not present in normal esophageal squamous epithelium in any of the cases examined (0/6) (Table 3).
Table 3.
LGR5 results in normal gastric cardia, esophagus, Barrett's esophagus, and associated advanced neoplasia

Of the patients with BE and associated neoplasia, all 17 BE cases without dysplasia showed LGR5 transcripts exclusively located at the bases of the crypts, similar to the stereotypic cellular hierarchy (defined as reactivity restricted to the basal crypts) seen in normal small bowel and colonic epithelium.
We also evaluated 44 cases of BE with dysplasia or adenocarcinoma, as mentioned above. BE cases lacked surface LGR5 expression, while surface expression was limited to a single case with low-grade dysplasia; both group showed staining of basal crypts. By contrast, most cases of high-grade dysplasia showed LGR5 reactivity (66.7%, 12/18) in surface epithelial cells, in addition to staining in the crypt bases (Table 3). There was a significant difference in high-grade dysplasia compared with BE without dysplasia, or low-grade dysplasia (high-grade dysplasia vs low-grade dysplasia, high-grade dysplasia vs BE, P < 0.0001), with regard to surface LGR5 staining. All 18 biopsies with adenocarcinomas showed loss of the normal hierarchical staining pattern of LGR5 seen in nondysplastic BE. In adenocarcinomas, LGR5 was expressed in a random fashion within the malignant glands, with no apparent spatial or geographic distribution.
Quantitative analysis of LGR5 expression in normal gastric cardia, normal esophagus, BE, and associated advanced neoplasia
In the normal gastric cardia, the mean percentage of LGR5-positive crypts per patient was 6% (±4.4), whereas the mean number of LGR5 transcripts per cell was 0.3 (±0.2). Rare LGR5 transcripts were also identified in scattered epithelial cells in the submucosal esophageal glands. In BE cases without dysplasia, the mean percentage of LGR5-positive crypts per patient was 20.3% (±18.4) and the mean number of LGR5 transcripts per cell was 2.5 (±1.7). The mean number of LGR5 transcripts per cell was significantly higher in BE without dysplasia compared with normal gastric cardiac mucosa (P < 0.001). In low-grade and high-grade dysplasia, the mean percentage of LGR5-positive crypts per patient and the mean number of LGR5 transcripts per cell were significantly elevated compared with BE without dysplasia (low-grade dysplasia vs BE, high-grade dysplasia vs BE, P < 0.0001 and P < 0.0001 respectively) (Table 3, Figure 2). In low-grade dysplasia, the mean percentage of LGR5-positive crypts per patient was 55.4% (±25.3) and the mean number of LGR5 transcripts per cells was 4.9 (±2.9), whereas in high-grade dysplasia, the mean percentage of LGR5-positive crypts per patient was 72.4% (±24.6) and the mean number of LGR5 transcripts per cells was 7.3 (±3.9). Finally, in adenocarcinoma, the mean percentage of LGR5-positive crypts per patient was 73.7% (±26.4) and the mean number of LGR5 transcripts per cells was 9.1 (±3.6). The percentage of LGR5-positive crypts per patient and the mean number of LGR5 transcripts per cell were not significantly higher in adenocarcinoma compared with low-grade dysplasia or high-grade dysplasia (low-grade dysplasia vs adenocarcinoma, high-grade dysplasia vs adenocarcinoma, P = 0.912 and P = 0.601, and P = 0.926 and P = 0.665, respectively).
Figure 2.
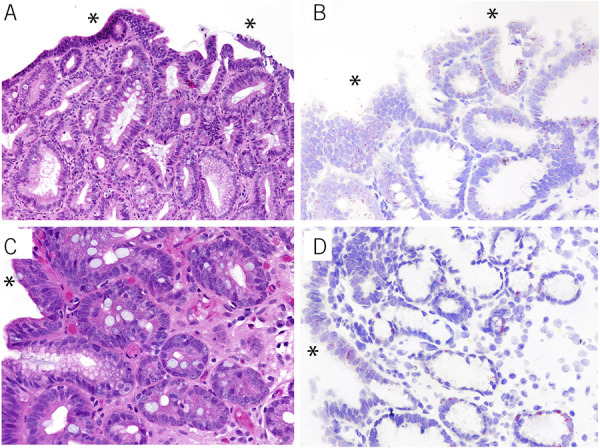
LGR5 reactivity on in situ hybridization in 2 examples of high-grade dysplasia. Full-thickness LGR5 reactivity is present, including surface epithelial cell expression (red chromogen, b and d). Corresponding hematoxylin and eosin images are shown in panel a and c. The asterisks indicate surface epithelium.
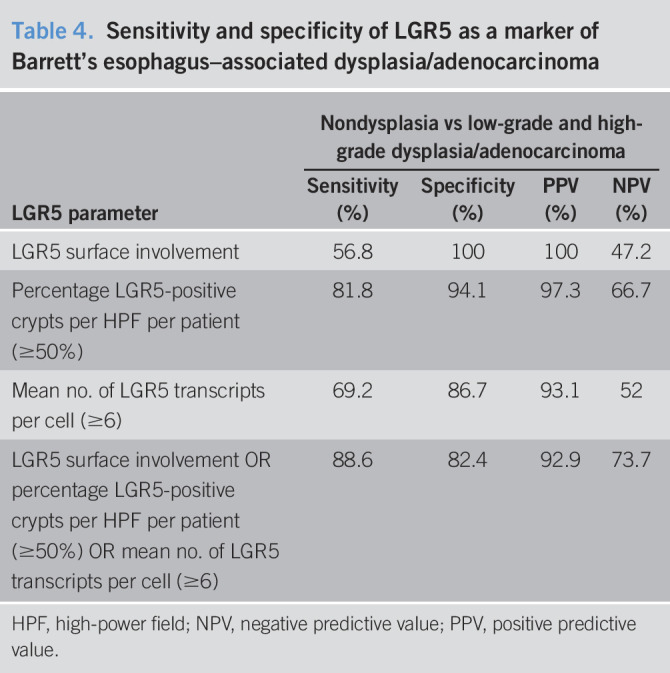
An optimal cutoff point for the percentage of LGR5-positive crypts per patient and the mean number of LGR5 transcripts per cell was derived by an ROC curve analysis. We defined abnormal LGR5 expression as the presence of any of the following 3 parameters: LGR5 surface involvement, ≥50% mean percentage of LGR5-positive crypts per patient, or ≥6 mean number of LGR5 transcripts per cell. Using this method, the sensitivity and specificity for detecting BE-related dysplasia or adenocarcinoma were high (89% and 82%, respectively) for the presence of any one, or more, of these 3 parameters (Table 4).
Table 4.
Sensitivity and specificity of LGR5 as a marker of Barrett's esophagus–associated dysplasia/adenocarcinoma
Prediction of progression
The purpose of this aspect the study was to evaluate whether LGR5 could predict progression of patients with BE to advanced neoplasia. Qualitatively, LGR5 surface expression was exclusively noted in biopsies from the progressor group (2/28, 7.1%) compared with the nonprogressor group (0/30) (P = 0.136).
With respect to the quantitative analysis, in the progressor group, the mean percentage of LGR5-positive crypts per patient was 39.3% (±25.8) and the mean number of LGR5 transcripts per cell was 5.1 (±4.5). By contrast, in the nonprogressor group, the mean percentage of LGR5-positive crypts per patient was only 17.6% (±13.2) and the mean number of LGR5 transcripts per cell was 2.6 (±2.3). The mean percentage of LGR5-positive crypts per patient and the mean LGR5 transcripts per cell were both significantly higher in BE biopsies from progressors compared with nonprogressors (P < 0.0001 and P = 0.014, respectively) (Table 5, Figure 3).
Table 5.
LGR5 as a predictor of progression to high-grade dysplasia/adenocarcinoma in Barrett's esophagus (BE)
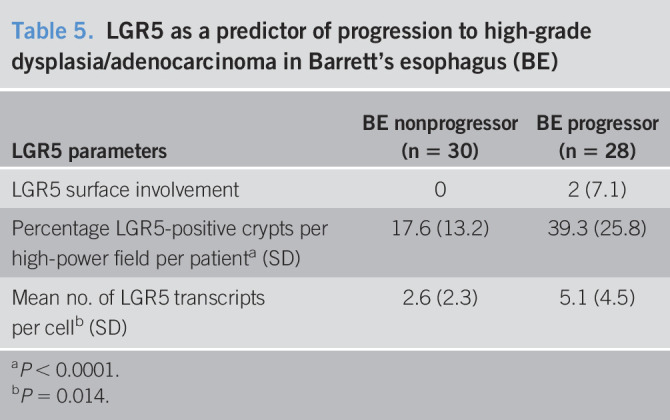
Figure 3.
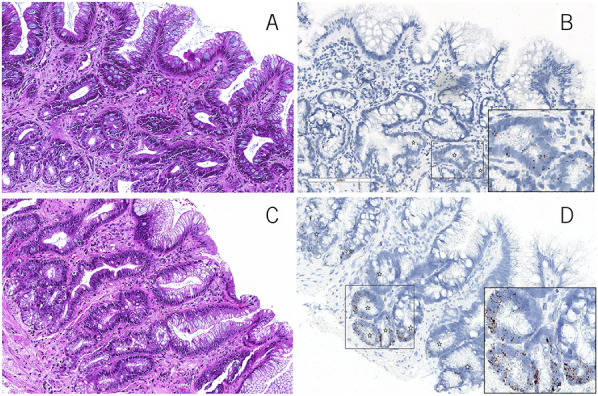
Representative hematoxylin and eosin images of a case of nonprogressor BE (a) and progressor BE (c). Quantitative LGR5 expression in nonprogressor BE (b) (percentage of LGR5-positive crypts per high-power field = 16% and mean number of LGR5 transcripts per cell = 2.3) and in predysplasia biopsy of a progressor BE patient (d) (percentage of LGR5-positive crypts per high-power field = 73% and mean number of LGR5 transcripts per cell = 13.4) (in situ hybridization, Brown chromogen). BE, Barrett's esophagus.
Based on an ROC analysis (Figure 4), we defined abnormal LGR5 expression as the presence of any of these following 3 parameters: LGR5 surface involvement, ≥50% of mean LGR5-positive crypts per patient, and ≥6 mean number of LGR5 transcripts per cell (Table 6). The specificity of an abnormal LGR5 signal, as defined above, predicted progression to advanced neoplasia with a specificity of 87% and sensitivity of 50%.
Figure 4.

Receiver operator curve evaluating the performance of LGR5 as a marker for dysplasia (a) (area under the curve = 0.936 for percentage of LGR5-positive crypts per high-power field and 0.881 for mean number of LGR5 transcripts per cell) and LGR5 as a marker predictor of dysplasia in nondysplastic Barrett's esophagus samples (b) (area under the curve = 0.738 for percentage of LGR5-positive crypts per high-power field and 0.674 for mean number of LGR5 transcripts per cell).
Table 6.
Sensitivity and specificity of LGR5 as a predictor of progression to high-grade dysplasia/adenocarcinoma

Correlation of manual and automated LGR5 transcript counting
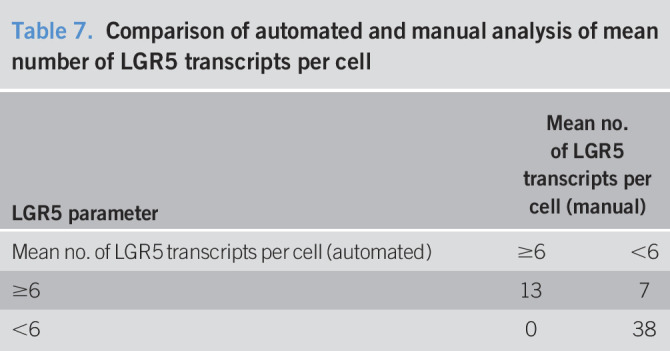
We compared the manual assessment of the mean number of LGR5 transcripts per cell with that of an automated platform to validate the results of the manual assessment and to explore the feasibility of clinical implementation of an automated LGR5 platform for the diagnosis and prediction of dysplasia in BE. The automated results validated our manual assessment of LGR5 (Pearson correlation = 0.754, P < 0.0001, concordance 88%) (Table 7). Regarding predicting risk of advanced neoplasia, the mean number of LGR5 transcripts per cell showed a specificity of 80% and sensitivity of 50%.
Table 7.
Comparison of automated and manual analysis of mean number of LGR5 transcripts per cell
DISCUSSION
Most esophageal adenocarcinomas arise within BE-associated metaplastic columnar mucosa through a metaplasia-dysplasia-carcinoma sequence. This pathogenetic process allows for a clinical opportunity to detect early lesions and eliminate them before cancer progression. As a result, there is much interest in identifying biomarkers that can help identify patients at highest risk of progression to cancer. LGR5 is a G-protein–coupled receptor that has recently been recognized as a reliable stem cell marker. LGR5 has been shown to be expressed in the stem cell compartment of the stomach, and intestines, and has also been shown to mark progenitor cells in the deep crypts of BE in observational studies (19). However, to date, there have not been any comprehensive and systematic human studies of LGR5 in BE, and also none that have used an RNA in situ hybridization technique (19–21). In this current study, our goal was to evaluate the localization and quantity of LGR5 in BE and associated neoplastic conditions and to determine whether these parameters can be used to help pathologists diagnose dysplasia and in the prediction of neoplastic progression (high-grade dysplasia/adenocarcinoma) in patients with this disease. We also sought to determine the efficacy of an automated platform in evaluating and quantifying LGR5 to decrease the level of human subjectivity in diagnosing dysplasia.
Our cross-sectional results showed several unique and clinically important observations. First, we documented that nondysplastic BE shows LGR5 expression located exclusively to the basal aspects of crypts, whereas high-grade dysplasia showed loss of the normal hierarchical pattern of expression by revealing LGR5 transcripts on the surface epithelium. In adenocarcinoma, the hierarchical pattern was completely abrogated. These results suggest that LGR5 surface expression may serve as a more objective and reliable method of assessing lack of surface maturation typical of dysplasia. In fact, the sensitivity and specificity of LGR5 surface expression for the diagnosis of high-grade dysplasia, compared with nondysplastic (reactive) BE, were 60% and 100%, respectively. The high specificity of surface LGR5 expression provides evidence that this feature can be used effectively in the diagnosis of dysplastic lesions, which is a well-known problem in BE pathology. We also demonstrated that both low- and high-grade dysplasia showed a significantly increased quantity of LGR5 expression compared with nondysplastic BE, as measured by the mean number of LGR5 transcripts per cell and the mean percentage of LGR5-positive crypts per patient. Using these parameters, LGR5 showed a sensitivity and specificity for a diagnosis of dysplasia or adenocarcinoma of 89% and 82%, respectively. Although histopathologic analysis is currently the gold standard for the diagnosis of dysplasia, the distinction of reactive epithelium from dysplasia remains a challenge in a proportion of cases and LGR5 could serve as an objective marker in this context (22–24). In a study of 248 patients diagnosed with high-grade dysplasia, expert gastrointestinal pathologists could confirm a diagnosis if high-grade dysplasia in only 51% while reclassifying 22% of cases as negative for dysplasia (25). Collectively, we feel that LGR5 expression could aid in the histological diagnosis of the more challenging dysplasia in BE, and future studies comparing morphology alone to morphology with LGR5 should be performed to ascertain its true clinical value in this regard.
In 1 cross-sectional study in humans, LGR5 was analyzed in 81 esophageal tissue specimens. It was shown to be expressed in 70% of nondysplastic biopsies and more than 90% of cases of advanced BE-related neoplasia, with a significant association between the intensity of LGR5 expression and advancing grades of neoplasia, similar to the results of our current study (13,26). This and other studies of LGR5 in BE, however, were performed with an immunohistochemical platform, a technique that has been plagued with lack of sensitivity and specificity, and reliability, of the LGR5 antibodies used for the assays (6,8–10,20,27–31).
There is keen interest, worldwide, in trying to identify reliable biomarkers that can help stratify patients with BE into those most likely to progress to cancer. For instance, DNA content abnormalities, oncogene methylation, and P53 inactivation are a few of the most well-studied potential biomarkers in BE, but so far, none have proven efficacious enough to be incorporated into clinical guidelines (32). In this study, we evaluated LGR5 expression in index nondysplastic BE biopsies as a predictive biomarker of neoplastic progression in a well-defined cohort of patients who either did (N = 28), or did not (N = 30), progress to high-grade dysplasia or cancer on follow-up. We showed that the mean percentage of LGR5-positive crypts per patient and the mean number of LGR5 transcripts per cell were both very significantly higher in BE biopsies of progressors, compared with nonprogressors. The sensitivity and specificity of these assays for predicting progression were 50% and 87%, respectively.
RNA in situ hybridization represents a more reliable quantitative platform than immunohistochemistry; the individual dots represent mRNA transcripts; consequently, the quantitation corresponds to the results of quantitative polymerase chain reaction–based assays, with the advantage of limiting the analysis to cells of interest. The availability of automated image analysis platforms creates an objective tool for the quantification of LGR5 transcripts and thus a novel means of predicting risk of advanced neoplasia (33,34). The results of our study showed excellent correlation between manual and automated LGR5 quantitation, which confirms that the automated platform may represent an easier, more reliable and objective method of RNA in situ evaluation in a clinical context.
Up until now, little is known about LGR5 in BE development and carcinogenesis. Prevailing wisdom suggests that BE arises from stem cells capable of differentiating into gastric- and intestinal-type epithelium. In fact, mouse studies have documented localization of LGR5-positive cells to the gastric cardia and, as a result, have provided evidence for this epithelium as the origin of BE, by documenting cell lineages related to esophageal columnar metaplasia (19). The presence of LGR5 cells in the human gastric cardia also supports both the “proximal migration” and the “wound-healing” model of BE pathogenesis.
This study has some limitations and strengths worthy of note. Limitations include the retrospective nature of the study and the relatively small number of patients studied, especially longitudinally. By contrast, strengths included use of an automated diagnostic platform which promotes objectivity in the evaluation of LGR5 expression, multiple independent and blinded expert pathology confirmation which provides more confidence in the diagnoses, and long-term follow-up of our progressor study which helps to rule out the possibility missed prevalent disease. Regardless, we feel that larger prospective studies should be performed of both low- and high-risk patients, so the broader value of LGR5 as a potential biomarker can be ascertained with certainty.
In conclusion, we documented, for the first time, the specific localization and degree of LGR5 expression by RNA in situ hybridization in BE and in various grades of dysplasia and showed that its expression is useful for distinguishing nondysplastic BE from true dysplasia. The predictable increase in LGR5 expression from normal to low- and high-grade dysplasia, and cancer, and its aberrant hierarchical pattern of expression in neoplasia, supports its role as a marker of cancer stem cells in BE. An increase in LGR5 expression that precedes morphologically apparent dysplasia, and its positive relationship to neoplastic progression, suggests that increased expression of LGR5 stem cells can help identify high-risk BE patients clinically. Further longitudinal outcome studies using a higher number of patients of various risk categories should provide more information of the potential utility of LGR5 as a more generalizable BE biomarker of neoplastic progression.
CONFLICTS OF INTEREST
Guarantor of the article: Vikram Deshpande, MD.
Specific author contributions: A.N., J.R.B., M.T., and V.D.: involved in study concept and design and drafting the manuscript. A.N., S.R., K.A., K.M., and W.J.: were involved in collection of sample retrieval, laboratory work, and data collection. A.N., V.D., and D.T.T.: performed analysis and interpretation of data. R.D.O., D.P., M.G., O.H.Y., and V.D.: involved in critical revision of the manuscript for important intellectual content and study supervision. M.S., D.T.T., and M.N.R.: involved in technical and/or material support.
Financial support: K.S., D.T.T., V.D., and M.N.R. previously received research support from Affymetrix, and A.N., D.T.T., V.D., and M.N.R. currently receive research support from Advanced Cell Diagnostics/Bio-techne. S.R. was supported by a postdoctoral fellowship from the MIT Ludwig Center for Molecular Oncology and funding from Richard O. Hynes (NIH grant U54-CA163109).
Potential competing interests: This work was funded by Affymetrix (K.A., D.T.T., M.N.R., and V.D.) and Advanced Cell Diagnostics/Bio-techne (A.N., D.T.T., M.N.R., and V.D.) and internal funds.
Ethics statement: This study was approved by the Institutional Review Board (IRB Number: 2018P000185).
Study Highlights.
WHAT IS KNOWN
✓ The incidence of Barrett's esophagus–related adenocarcinoma is on the rise.
✓ LGR5, the most robust intestinal stem cell marker, has been purported to represent a marker of stem cells of the gastrointestinal tract.
✓ The expression of LGR5 in Barrett's esophagus and associated neoplasia is unknown.
WHAT IS NEW HERE
✓ We identified qualitative and quantitative differences in LGR5 expression between nondysplastic and dysplastic Barrett's esophagus.
✓ LGR5 expression was significantly increased in patients with Barrett's esophagus who progressed to high-grade dysplasia or adenocarcinoma compared with those who did not on follow-up.
✓ The sensitivity and specificity of LGR5 for predicting progression to high-grade dysplasia/adenocarcinoma were 50% and 87%, respectively.
Supplementary Material
ACKNOWLEDGMENT
M.N.R is supported by Thomas & Diana Ryan MGH Research Scholar Award.
Footnotes
SUPPLEMENTARY MATERIAL accompanies this paper at http://links.lww.com/CTG/A475 and http://links.lww.com/CTG/A476.
Contributor Information
Azfar Neyaz, Email: aneyaz@mgh.harvard.edu.
Robert D. Odze, Email: odzerobert@gmail.com.
Steffen Rickelt, Email: srickelt@mit.edu.
Linda T. Nieman, Email: LNIEMAN@mgh.harvard.edu.
Jacob R. Bledsoe, Email: Jacob.Bledsoe@umassmemorial.org.
Krishnan K. Mahadevan, Email: krishnaniyer1990@gmail.com.
Kshitij Arora, Email: kshitijdr123@gmail.com.
William R. Jeck, Email: william.jeck@duke.edu.
Martin S. Taylor, Email: mstaylor@mgh.harvard.edu.
Manish Gala, Email: MGALA@mgh.harvard.edu.
Deepa T. Patil, Email: dtpatil@bwh.harvard.edu.
Omer H. Yilmaz, Email: OYILMAZ@mgh.harvard.edu.
Miguel N. Rivera, Email: MNRIVERA@mgh.harvard.edu.
David T. Ting, Email: DTING1@mgh.harvard.edu.
REFERENCES
- 1.Barker N, Tan S, Clevers H. Lgr proteins in epithelial stem cell biology. Development 2013;140:2484–94. [DOI] [PubMed] [Google Scholar]
- 2.van de Wetering M, Sancho E, Verweij C, et al. The β-catenin/TCF-4 complex imposes a crypt progenitor phenotype on colorectal cancer cells. Cell 2002;111:241–50. [DOI] [PubMed] [Google Scholar]
- 3.Kumar KK, Burgess AW, Gulbis JM. Structure and function of LGR5: An enigmatic G-protein coupled receptor marking stem cells. Protein Sci 2014;23:551–65. [DOI] [PMC free article] [PubMed] [Google Scholar]
- 4.Birchmeier W. Stem cells: Orphan receptors find a home. Nature 2011;476:287–8. [DOI] [PubMed] [Google Scholar]
- 5.Barker N, van Es JH, Kuipers J, et al. Identification of stem cells in small intestine and colon by marker gene Lgr5. Nature 2007;449:1003–7. [DOI] [PubMed] [Google Scholar]
- 6.Barker N, Huch M, Kujala P, et al. Lgr5+ve stem cells drive self-renewal in the stomach and build long-lived gastric units in vitro. Stem Cell 2010;6:25–36. [DOI] [PubMed] [Google Scholar]
- 7.Wang X, Ouyang H, Yamamoto Y, et al. Residual embryonic cells as precursors of a Barrett's-like metaplasia. Cell 2011;145:1023–35. [DOI] [PMC free article] [PubMed] [Google Scholar]
- 8.Xian W, Ho KY, Crum CP, et al. Cellular origin of Barrett's esophagus: Controversy and therapeutic implications. Gastroenterology 2012;142:1424–30. [DOI] [PMC free article] [PubMed] [Google Scholar]
- 9.Jang BG, Lee BL, Kim WH. Distribution of LGR5+ cells and associated implications during the early stage of gastric tumorigenesis. PLoS One 2013;8:e82390. [DOI] [PMC free article] [PubMed] [Google Scholar]
- 10.Baker AM, Graham TA, Elia G, et al. Characterization of LGR5 stem cells in colorectal adenomas and carcinomas. Sci Rep 2015;5:8654–8. [DOI] [PMC free article] [PubMed] [Google Scholar]
- 11.Xu L, Lin W, Wen L, et al. Lgr5 in cancer biology: Functional identification of Lgr5 in cancer progression and potential opportunities for novel therapy. Stem Cell Res Ther 2019;10:219. [DOI] [PMC free article] [PubMed] [Google Scholar]
- 12.Nakajima T, Uehara T, Kobayashi Y, et al. Leucine-rich repeat-containing G-protein-coupled receptor 5 expression and clinicopathological features of colorectal neuroendocrine neoplasms. Pathol Int 2018;68:467–72. [DOI] [PubMed] [Google Scholar]
- 13.Becker L, Huang Q, Mashimo H. Lgr5, an intestinal stem cell marker, is abnormally expressed in Barrett's esophagus and esophageal adenocarcinoma. Dis Esophagus 2010;23:168–74. [DOI] [PubMed] [Google Scholar]
- 14.Dalley AJ, Abdul Majeed AA, Pitty LP, et al. LGR5 expression in oral epithelial dysplasia and oral squamous cell carcinoma. Oral Surg Oral Med Oral Pathol Oral Radiol 2015;119:436–40.e1. [DOI] [PubMed] [Google Scholar]
- 15.Effendi K, Yamazaki K, Fukuma M, et al. Overexpression of leucine-rich repeat-containing G protein-coupled receptor 5 (LGR5) represents a typical Wnt/beta-catenin pathway-activated hepatocellular carcinoma. Liver Cancer 2014;3:451–7. [DOI] [PMC free article] [PubMed] [Google Scholar]
- 16.Vieira GC, Chockalingam S, Melegh Z, et al. Correction: LGR5 regulates pro-survival MEK/ERK and proliferative Wnt/beta-catenin signalling in neuroblastoma. Oncotarget 2017;8:32381. [DOI] [PMC free article] [PubMed] [Google Scholar]
- 17.Kulkarni AS, Wojcik JB, Chougule A, et al. MDM2 RNA in situ hybridization for the diagnosis of atypical lipomatous tumor: A study evaluating DNA, RNA, and protein expression. Am J Surg Pathol 2019;43:446–54. [DOI] [PubMed] [Google Scholar]
- 18.Martin ML, Zeng Z, Adileh M, et al. Logarithmic expansion of LGR5(+) cells in human colorectal cancer. Cell Signal 2018;42:97–105. [DOI] [PMC free article] [PubMed] [Google Scholar]
- 19.Quante M, Bhagat G, Abrams JA, et al. Bile acid and inflammation activate gastric cardia stem cells in a mouse model of Barrett-like metaplasia. Cancer Cell 2012;21:36–51. [DOI] [PMC free article] [PubMed] [Google Scholar]
- 20.Kemper K, Prasetyanti PR, De Lau W, et al. Monoclonal antibodies against Lgr5 identify human colorectal cancer stem cells. Stem Cells 2012;30:2378–86. [DOI] [PubMed] [Google Scholar]
- 21.Barker N. Adult intestinal stem cells: Critical drivers of epithelial homeostasis and regeneration. Nat Rev Mol Cell Biol 2014;15:19–33. [DOI] [PubMed] [Google Scholar]
- 22.Montgomery E, Bronner MP, Goldblum JR, et al. Reproducibility of the diagnosis of dysplasia in Barrett esophagus: A reaffirmation. Hum Pathol 2001;32:368–78. [DOI] [PubMed] [Google Scholar]
- 23.Reid BJ, Haggitt RC, Rubin CE, et al. Observer variation in the diagnosis of dysplasia in Barrett's esophagus. Hum Pathol 1988;19:166–78. [DOI] [PubMed] [Google Scholar]
- 24.Downs-Kelly E, Mendelin JE, Bennett AE, et al. Poor interobserver agreement in the distinction of high-grade dysplasia and adenocarcinoma in pretreatment Barrett's esophagus biopsies. Am J Gastroenterol 2008;103:2333–40; quiz 2341. [DOI] [PubMed] [Google Scholar]
- 25.Sangle NA, Taylor SL, Emond MJ, et al. Overdiagnosis of high-grade dysplasia in Barrett's esophagus: A multicenter, international study. Mod Pathol 2015;28:758–65. [DOI] [PubMed] [Google Scholar]
- 26.von Rahden BH, Kircher S, Lazariotou M, et al. LgR5 expression and cancer stem cell hypothesis: Clue to define the true origin of esophageal adenocarcinomas with and without Barrett's esophagus? J Exp Clin Cancer Res 2011;30:23. [DOI] [PMC free article] [PubMed] [Google Scholar]
- 27.Jang BG, Kim HS, Chang WY, et al. Expression profile of LGR5 and its prognostic significance in colorectal cancer progression. Am J Pathol 2018;188:2236–50. [DOI] [PubMed] [Google Scholar]
- 28.Barker N, Ridgway RA, van Es JH, et al. Crypt stem cells as the cells-of-origin of intestinal cancer. Nature 2008;457:608–11. [DOI] [PubMed] [Google Scholar]
- 29.Barker N, Rookmaaker MB, Kujala P, et al. Lgr5+ve stem/progenitor cells contribute to nephron formation during kidney development. Cell Rep 2012;2:540–52. [DOI] [PubMed] [Google Scholar]
- 30.Schepers AG, Snippert HJ, Stange DE, et al. Lineage tracing reveals Lgr5+ stem cell activity in mouse intestinal adenomas. Science 2012;337:730–5. [DOI] [PubMed] [Google Scholar]
- 31.Ziskin JL, Dunlap D, Yaylaoglu M, et al. In situ validation of an intestinal stem cell signature in colorectal cancer. Gut 2013;62:1012–23. [DOI] [PubMed] [Google Scholar]
- 32.Naini BV, Souza RF, Odze RD. Barrett's esophagus: A comprehensive and contemporary review for pathologists. Am J Surg Pathol 2016;40:e45-66. [DOI] [PMC free article] [PubMed] [Google Scholar]
- 33.Anderson CM, Zhang B, Miller M, et al. Fully automated RNAscope in situ hybridization assays for formalin-fixed paraffin-embedded cells and tissues. J Cell Biochem 2016;117:2201–8. [DOI] [PMC free article] [PubMed] [Google Scholar]
- 34.Holzer TR, Hanson JC, Wray EM, et al. Cross-platform comparison of computer-assisted image analysis quantification of in situ mRNA hybridization in investigative pathology. Appl Immunohistochem Mol Morphol 2019;27:15–26. [DOI] [PubMed] [Google Scholar]
Associated Data
This section collects any data citations, data availability statements, or supplementary materials included in this article.