Abstract
Blood vessels are commonly studied in isolation to define their mechanical and biological properties under controlled conditions. While sections of wall are sometimes tested, vessels are most often attached to needles and examined in their natural cylindrical configuration where combinations of internal pressure and axial force can be applied to mimic in vivo conditions. Attachments to needles, however, constrain natural vessel deformation, resulting in a complex state of deformation that is not easily determined. As a result, measurements are usually limited to the midsection of a specimen where end effects do not extend and the deformation is homogeneous. To our knowledge, however, the boundaries of this uninfluenced midsection region have not been explored. The objective of this work was to define the extent of these end effects as a function of vessel diameter and material properties, loading conditions, and needle diameter. A computational fiber framework was used to model the response of a nonlinear anisotropic cylindrical tube, constrained radially at its ends, under conditions of axial extension and internal pressure. Individual fiber constitutive response was defined using a Fung-type strain energy function. While quantitative results depend on specific parameter values, simulations demonstrate that axial stretch is always highest near the constraint and reduces to a minimum in the uninfluenced midsection region. Circumferential stretch displays the opposite behavior. As a general rule, the length of the region disturbed by a needle constraint increases with the difference between the diameter of the needle and the equilibrium diameter of the blood vessel for the imposed loading conditions. The reported findings increase understanding of specimen deformation in isolated vessel experiments, specifically defining considerations important to identifying a midsection region appropriate for measurement.
Keywords: blood vessel testing, end effects, computer modeling
Introduction
Isolated blood vessel testing is a common experimental technique utilized to study vessel mechanics and physiology. While vessel tissue is tested in a number of different ways, the most natural approach is to secure the specimen between two needles to allow control of both axial stretch and internal pressure. Attachments to needles, however, constrain natural vessel deformation, resulting in a complex strain state that is not easily determined. Local disturbances around points of attachment are unavoidable in the testing of most materials but are usually dealt with by making measurements some distance away from the imposed load or constraint where, according to St. Venant’s Principle, the resulting deformations and stresses are the same for any statically equivalent combination of end loads. Because St. Venant’s Principle was introduced in the context of isotropic linear elasticity, quantitative predictions of end effect decay rates are not expected to be accurate for blood vessels, but the general concept of end effects has guided experiments on blood vessels and other soft tissues for a number of years [1–4]. To our knowledge, however, the influence of end constraints in soft tissue experiments has not been quantified, leading to uncertainty in selecting a region appropriate for measurements.
Isolated vessel experiments in our laboratory confirm that responses within the midsection and at the ends are generally different. While axial stretch tests on unpressurized vessels produced uniform axial deformations along the vessel length [5], additional loading with internal pressure resulted in midsection axial stretch ratios that were not equivalent to the ratios calculated based on needle-to-needle motion. In tests where vessels were first pressurized and then extended axially (Fig. 1), midsection axial stretch ratios (determined by tracking microspheres on the adventitia) increased to values greater than 1.0 as a result of pressure alone (path traced by arrow in figure) and then increased again as vessel length was increased. The rate of increase of midsection axial stretch, however, was less than that of the stretch ratio calculated based on distance between needles.
Figure 1.
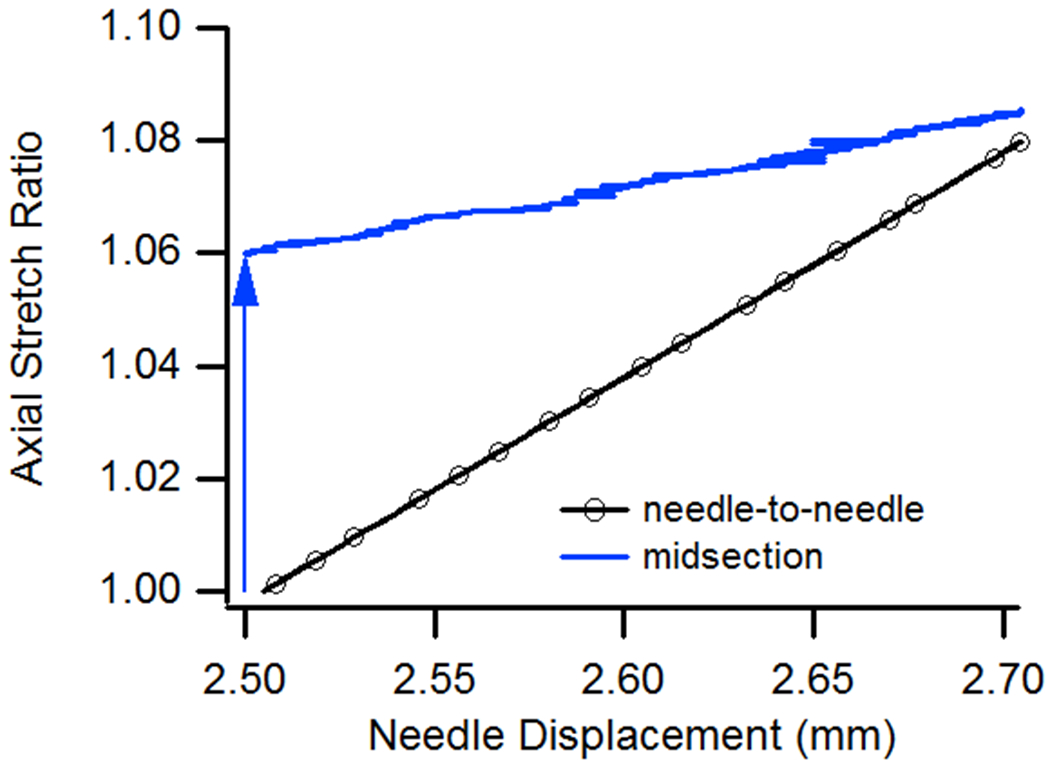
Needle-to-needle and midsection axial stretch values during a constant pressure (13 kPa) axial extension test. The arrow shows the path of midsection axial stretch as pressure is increased from 0 to 13 kPa but needle position is constant. Vessel reference length was ~2.5 mm.
While laboratory observations are helpful in demonstrating the presence of end effects, they do not easily allow systematic study of potentially influential parameters over the deformation field. The objective of this work was to define the extent of end effects as a function of common specimen and testing parameters using a computational model accounting for the nonlinear, anisotropic response displayed by most blood vessels. Specimen geometry and material properties measured in recent experiments on human cerebral arteries [6] were utilized for the baseline case.
Methods
Description of the fiber model
The computational framework utilized in the present study has been previously described for applications involving simulation of both ballistic fabrics [7] and fibrous biological tissues [8]. As the latter publication indicates, the mechanical response of many biological tissues, including blood vessels, is largely defined by their fiber architecture, so a fiber-based model framework is well-suited to description of their behavior. In order to simulate blood vessel response in the present study, individual fibers, or trusses, were arranged in either the axial or circumferential direction to form a cylindrical membrane. Intersections of fibers were defined as nodes that function as pinned joints connecting the fibers. Although the resulting structure is relatively simple compared to the microstructure of the arterial wall, the goal is not to replicate vessel architecture but rather to qualitatively capture the fibrous nature of the material. For the present time, where the compressive response is of little interest, the contribution of the surrounding soft tissue is considered negligible compared to that of the relatively stiff load-carrying fibers.
The response of the fibers is based on the Fung-type material model utilized in our previous study of cerebral arteries [6]:
| (1) |
where is the strain energy, and are the Green strains in the circumferential and axial directions, and c and ci are material parameters. Unlike the material model used in a previous application of the fiber framework [8], the stress in the material here depends on the biaxial state of strain. This material model is adapted for use with the truss model by considering the average perpendicular strain at each node. Stress and strain are defined on a given connection, or fiber, between two nodes. For a fiber along the circumference, is determined by the stretch of that fiber: , where is the stretch of the fiber. The corresponding for that fiber is determined using the average stretch of the four perpendicular (axially oriented) connections, two connected to each of the nodes on either side of the circumferential fiber: , where and is the stretch in the ith perpendicular connecting fiber. A similar process is used in the calculation of the stress in an axial fiber.
In this work, we are concerned only with quasi-static vessel loading. As a result, our approach seeks the equilibrium solution as opposed to the dynamic response of the vessel. For a lumped mass model, we thus require:
| (2) |
where is the force on node i due to the Ith connecting fiber, is the internal pressure in the vessel, is the outward pointing normal at node i, and is the surface area associated with node i. The force is a function of the positions of the node and its neighbors, . For this truss network model, the force acting along each fiber is:
| (3) |
where is the cross-sectional area of the undeformed fiber, is the second Piola-Kirchhoff stress in fiber I, is the stretch in fiber I, and is a unit directional vector for the fiber where denotes the position of the endpoint not in contact with the lumped mass and denotes the position of the lumped mass, node i. The magnitude of the Cauchy stress in fiber I is , as in one dimension the deformation gradient is equivalent to the stretch, , and the Jacobian, JI, is . The force due to pressure is calculated on the four surfaces, defined by the truss connections, that contain node i. The normal for each surface and its area are updated as the body, and the bordering nodes, deform.
The equation for static equilibrium (Eq. 2), in combination with the Fung material model and the live loading from applied pressure, produces a nonlinear system of equations. There are a number of approaches to solving such a system of equations, Newton’s method being a typical example. However, as this code was originally designed for dynamic problems, the Dynamic Relaxation method was chosen. Dynamic Relaxation works by adding an artificial damping force, , to the system and treating the static problem as a dynamic one. The system of equations now becomes:
| (4) |
The deformation of the body is allowed to evolve in time until the equilibrium configuration is reached. The convergence of the system is determined when the residual, defined as , the magnitude of the net force summed over all nodes, has dropped beneath a specified tolerance value. It is important to note that the artificial damping force is not included in the calculation of the residual. With this method, the values of mass, time, and the damping coefficient do not have a basis in the physics of the problem. Instead they may be chosen so as to improve the stability of the system and achieve convergence using a minimum number of time steps. For the results presented in this work, the mass of each node was set to 0.0653 milligrams, the damping constant was set to 1 g/s, and the initial time step was 25 nanoseconds. These values performed well but are not necessarily the optimal choices for this problem. A tolerance of 1x10⁻⁶ N was used to determine when static equilibrium was achieved.
Model application
Boundary conditions associated with diameter constraints at the needles were applied by fixing the circumferential positions of all nodes at each end of the vessel to match the diameter of the needle size being simulated. Overall, or needle-to-needle (n-t-n), axial stretch was similarly defined by fixing the axial positions of nodes at each end of the vessel to provide the desired distance between the vessel ends, or needles. Pressure was applied as a normal force to the interior surface of each node. The magnitude and direction of this force changed with variations in the normal vector and nodal area as the vessel deformed. A constant vessel thickness of 0.088 mm was used for all simulations.
Variations in loading conditions, vessel diameter and length, needle diameter, and material properties were simulated to investigate their influence on the magnitude and extent of end effects associated with the needle constraints. Geometry and material properties for the baseline case were taken from a human cerebral artery previously tested in our laboratory (specimen A9 in [6]); unloaded length and diameter were 4.05 and 0.52 mm (the mean diameter of the specimen), respectively, while material properties were defined by the constitutive model described by Eq. 1 with coefficients c = 8.90 kPa and c1, c2, c3 = 1.68, 42.39, 0.02. The simulation was also used to study diameters of 0.78 and 1.04 mm, 1.5 and 2 times the baseline, and various combinations of c1 and c2 (c1, c2 = 1.68, 31.79; c1, c2 = 1.68, 21.20; c1, c2 = 11.44, 42.39; c1, c2 = 21.20, 42.39), the parameters primarily governing material response in the circumferential and axial directions, respectively. Because baseline parameter values were so strongly orthotropic, the additional parameter combinations were selected either to stiffen the circumferential response while maintaining the baseline axial behavior or to soften the axial response while holding circumferential behavior at baseline, both approaches working to reduce the degree of anisotropy. Other constitutive model parameters were held constant at baseline values. Baseline needle diameter was taken to be equal to baseline vessel diameter; needle diameters equal to 0.8 and 0.9 times the baseline were also simulated. Loading conditions were varied between 1.0 and 1.15 for n-t-n stretch and between 6 and 20 kPa for pressure.
A study of spatial resolution was conducted to determine the number of nodes required for convergence. As expected, successive increases in the number of nodes in the simulation resulted in solutions that were more and more similar to each other. Based on this investigation, it was determined that 20 nodes around the circumference and 40 nodes along the vessel length, giving resolutions of approximately 10 nodes/mm, achieved satisfactory results for the baseline geometry. When larger diameters and lengths were explored, the number of nodes was increased proportionally.
Model Validation
Although stress values predicted by the model were not utilized as an outcome in this study, stresses predicted in the midsection region of the model were compared to theoretical values for a cylindrical membrane subjected to internal pressure. Circumferential equilibrium requires that σθ = pr / t be satisfied at all times; predicted stress values were consistent with this requirement.
Model results were also compared to deformations measured during vessel experiments in our lab. Both model and experiment showed that application of internal pressure, in the absence of any change in n-t-n displacement, resulted in increased axial stretch values in the vessel midsection, as shown in Fig. 1. Simulations also mirrored experimental data showing that midsection stretch becomes more similar to the n-t-n stretch ratio as needle displacement is increased under constant pressure. However, model predictions did not exactly match experimental results since the applied constitutive model did not exactly fit experimental data [6].
Analysis
Extent of end effects was determined for a given case by comparing the stretch ratio at the vessel axial center, where end effects do not extend assuming a long enough vessel, with stretch ratios elsewhere. Boundaries of the uninfluenced midsection region were defined as the axial position at which the difference between these two measures was greater than 0.01. Node positions usually did not coincide with this boundary, so its location was approximated using linear interpolation between the nodes where the threshold was exceeded. A different value of the threshold difference could have been utilized, and would result in a shift in the predicted extent of end effects. Also, while our primary goal was to study the influence of end effects on axial deformation, their effect on both axial and circumferential stretch ratios was analyzed.
In the presentation of results, the local axial stretch ratio is commonly compared to the n-t-n stretch ratio. The latter is defined as the current distance between the needles (or the points of vessel attachment on the needles) divided by the distance between the needles when the vessel is in its unloaded reference configuration. In general, then, the measure does not refer to deformation of the vessel itself but is a useful reference point for comparison since displacement is often readily available to an experimenter as encoder or LVDT data from an actuator.
Results
Predicted Deformations
Figure 2 illustrates the predicted deformations for the baseline case loaded with an internal pressure of 13 kPa and n-t-n stretch values ranging from 1.0 to 1.15. As shown, axial stretch is not uniform along the length of the vessel and reaches its maximum value at the end constraints. Figure 3 provides a more quantitative picture of the predicted axial stretch values, along with circumferential stretch results, for the same cases. Consistent with experimental data (Fig. 1), the left-most case illustrated in Fig. 2 developed midsection axial stretch values greater than 1.0 when it was pressurized, even though n-t-n displacement was unchanged. For all cases, axial deformation was highest in regions closest to the constraints at the vessel ends and lowest in the midsection. As Fig. 3 shows, circumferential stretch values displayed the opposite behavior, with their minimum obviously occurring where attachment to the needles constrained any increase in diameter. These locations of minimum and maximum stretch were consistent in all variations of model parameters.
Figure 2.
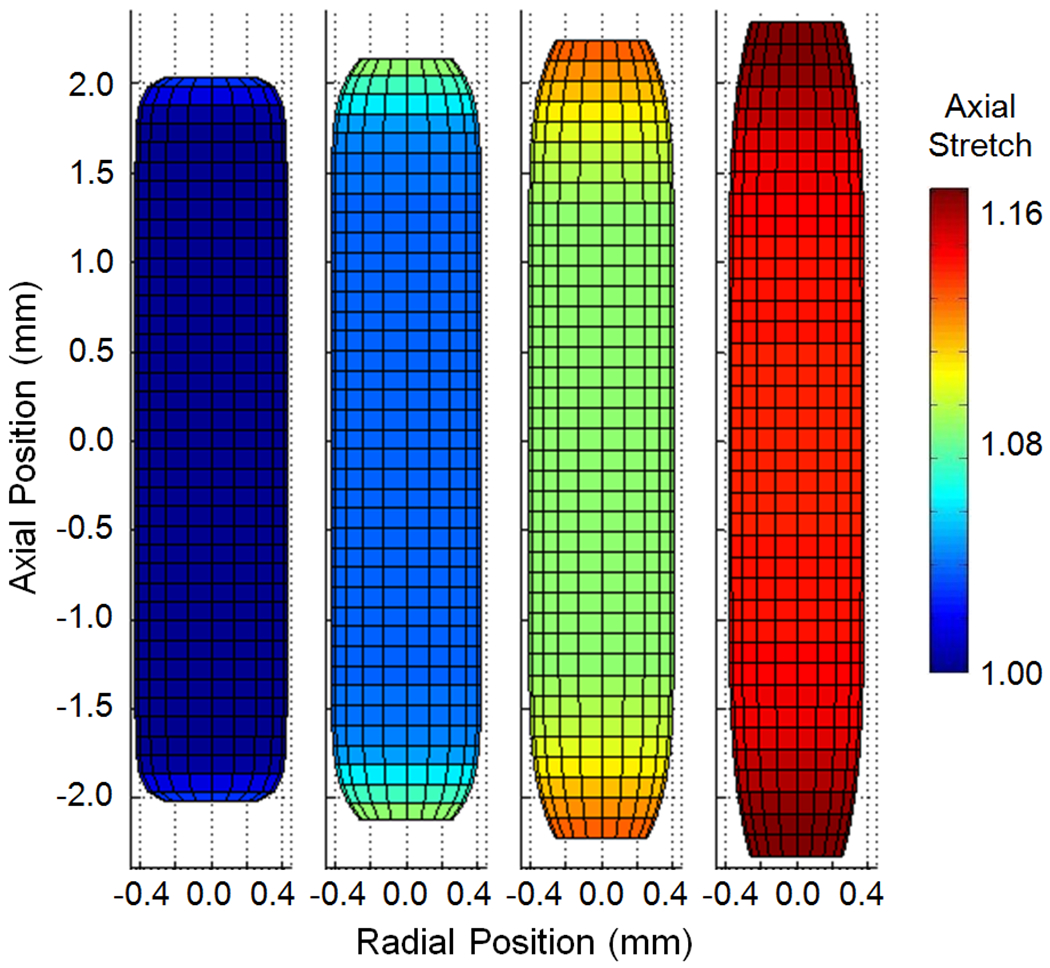
Predicted vessel geometry and associated axial stretch ratio for the baseline geometry loaded at 13 kPa and successively increasing values of n-t-n stretch (1.0, 1.05, 1.10, 1.15 from left to right).
Figure 3.
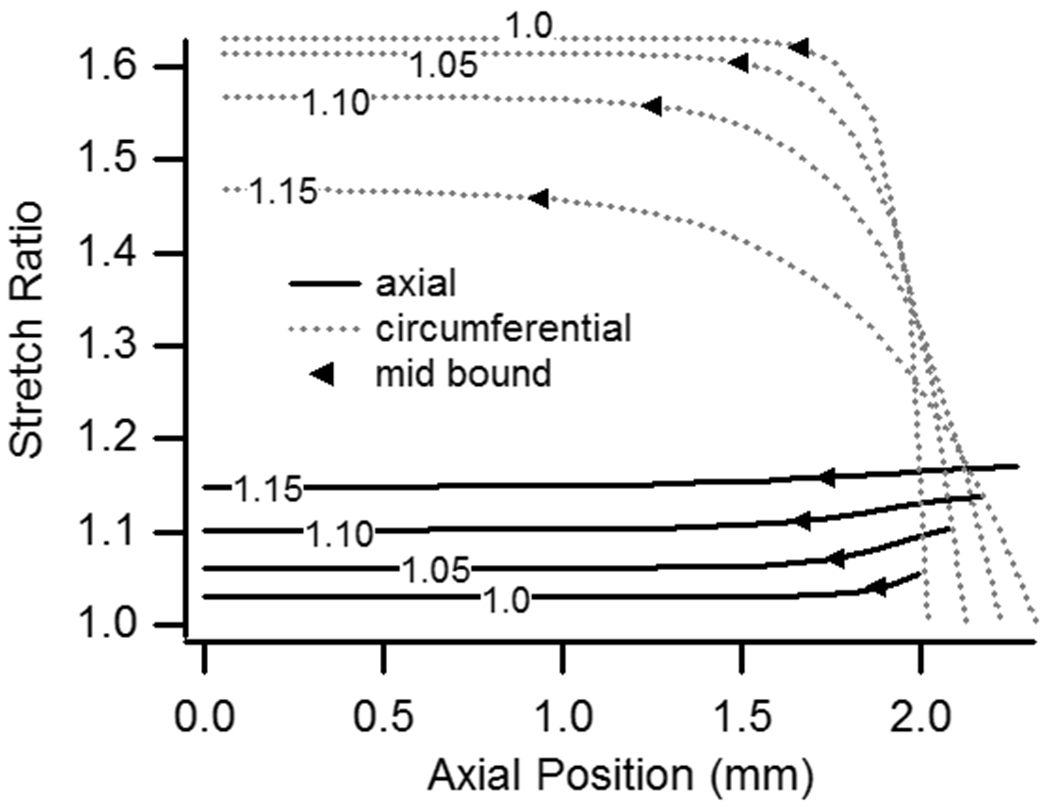
Axial and circumferential stretch ratios as a function of position along the vessel axis (data from half of vessel shown due to symmetry; 0.0 is axial center). Pressure was constant at 13 kPa while n-t-n stretch varied between 1.0 and 1.15 (labels). Midsection boundaries for a threshold difference of 0.01 are plotted.
Loading Conditions
Figure 4(a) shows that an increase in pressure leads to increased differences between n-t-n and local stretch ratios as well as between local axial stretch ratios at the ends and in the midsection, generally leading to more extensive end effects as indicated by the boundary locations plotted in the figure; these trends hold whether the specimen is stretched axially or not. As expected, increasing pressure also increased circumferential stretch (Fig. 4(b)). Increasing pressure while holding n-t-n stretch constant resulted in increases in circumferential stretch that were essentially proportional to distributions at lower pressures. As a result, the extent of end effects, based on circumferential stretch considerations, did not change significantly with variation in pressure.
Figure 4.
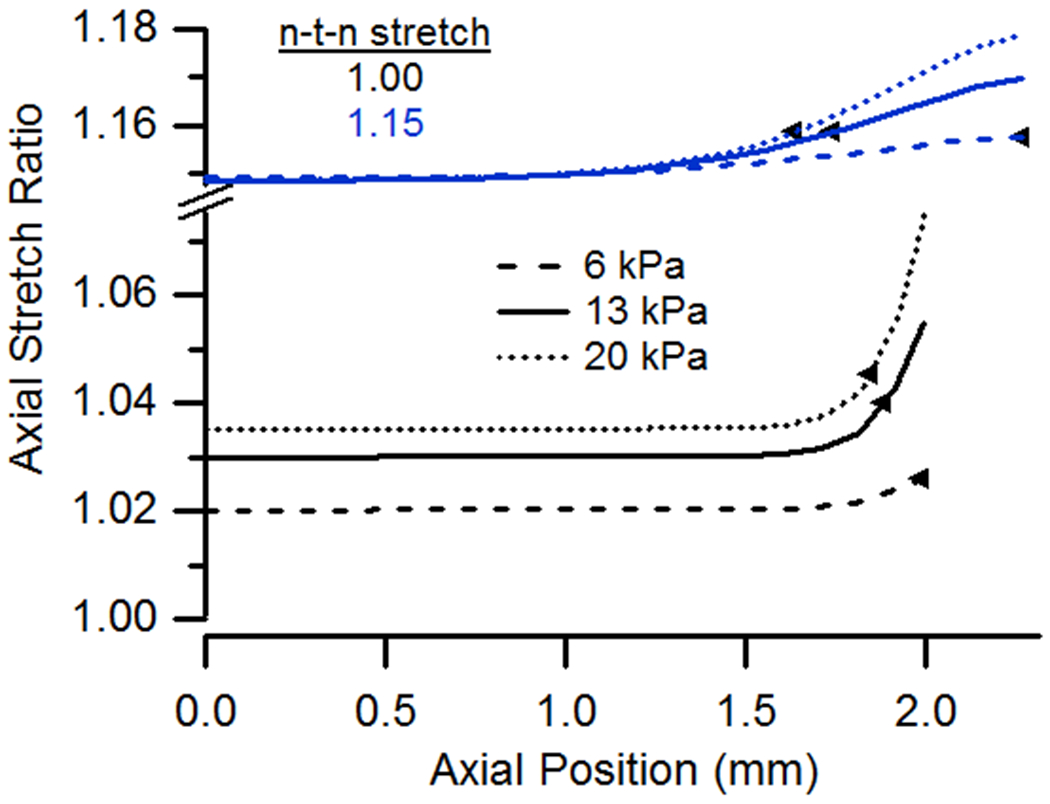
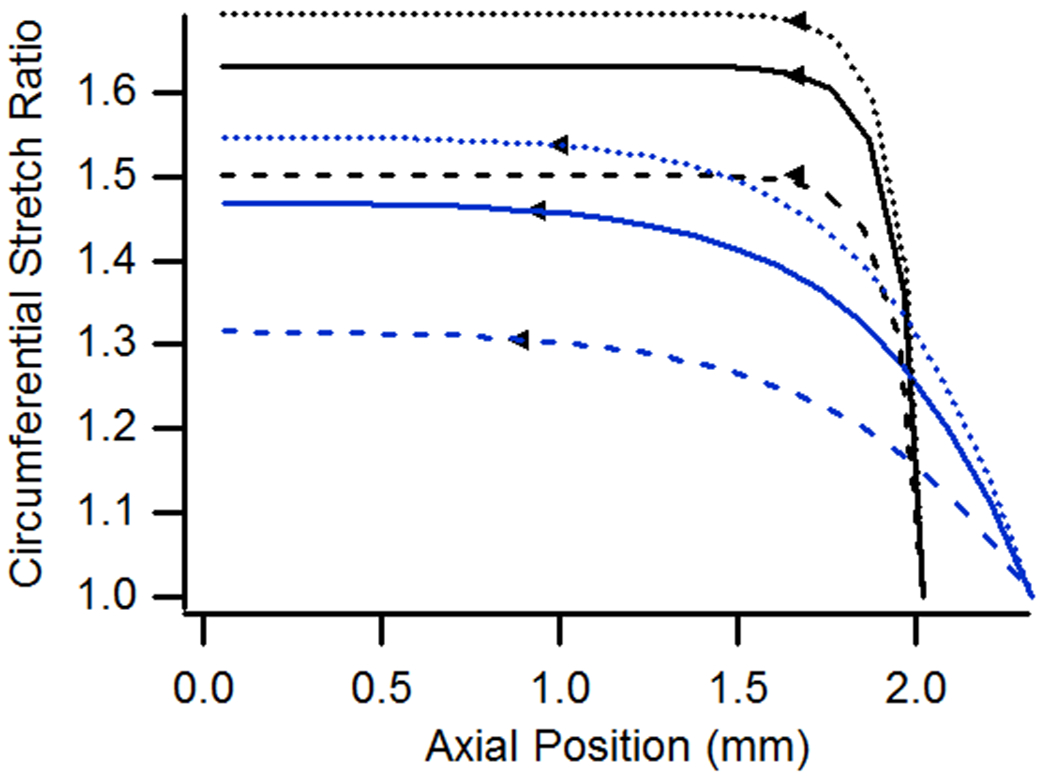
(a) Axial and (b) circumferential stretch ratio as a function of vessel length for cases having pressures of 6, 13, or 20 kPa and n-t-n ratios of 1.0 or 1.15.
In addition to showing the influence of pressure in an unstretched vessel, Fig. 3 also illustrates the role of n-t-n stretch on the strain field. As expected, an increase in n-t-n stretch resulted in higher axial stretch ratios throughout. The model also showed that differences between axial stretch ratios at the ends and midsection decreased with increased n-t-n stretch, and, consistent with the presented experimental data, midsection axial stretch ratios were more accurately approximated by n-t-n stretch as the latter increased. In the case with n-t-n stretch equal to 1.0, a midsection axial stretch ratio of 1.03 developed by virtue of pressure alone. As n-t-n stretch was increased, the difference between n-t-n and midsection values diminished so that cases with n-t-n stretch of 1.05 and 1.10 had midsection stretch values of 1.0614 and 1.1023, respectively (differences of 0.0114 and 0.0023). In the case of a n-t-n stretch of 1.15, the midsection stretch ratio was even more similar to n-t-n stretch (1.1487; difference of-0.0013), except that the ratio in the midsection was less, instead of greater, than the n-t-n value. Simulation of a comparable case having a n-t-n stretch ratio of 1.20 (not plotted) resulted in a midsection ratio of 1.1993, so the difference between the two measures continued to decrease and remained negative. Despite the increasing similarity between n-t-n and midsection ratios, the extent of end effects increased with n-t-n stretch, with lengths affected being 0.11, 0.31, 0.50, and 0.53 mm for n-t-n stretch values of 1.0, 1.05, 1.10, and 1.15. These lengths would obviously change with a different threshold value, but the plot makes it clear that the flat midsection region decreases in length with increasing n-t-n stretch. When circumferential stretch ratios are considered, Fig. 3 shows that increases in n-t-n stretch resulted in a comparatively large increase in the extent of end effects.
Vessel Geometry
For vessels having different diameters, all other parameters being held constant, axial stretch ratios increased with diameter (Fig. 5), somewhat similar to when a vessel is subjected to increasing pressure (Fig. 4(a)). The extent of end effects also increased with diameter, for both high and low values of n-t-n stretch. Circumferential stretch ratios, and the extent of end effects based on them, also increased with diameter. Simulations of increased diameter were performed on longer-than-baseline vessels to ensure an uninfluenced midsection.
Figure 5.
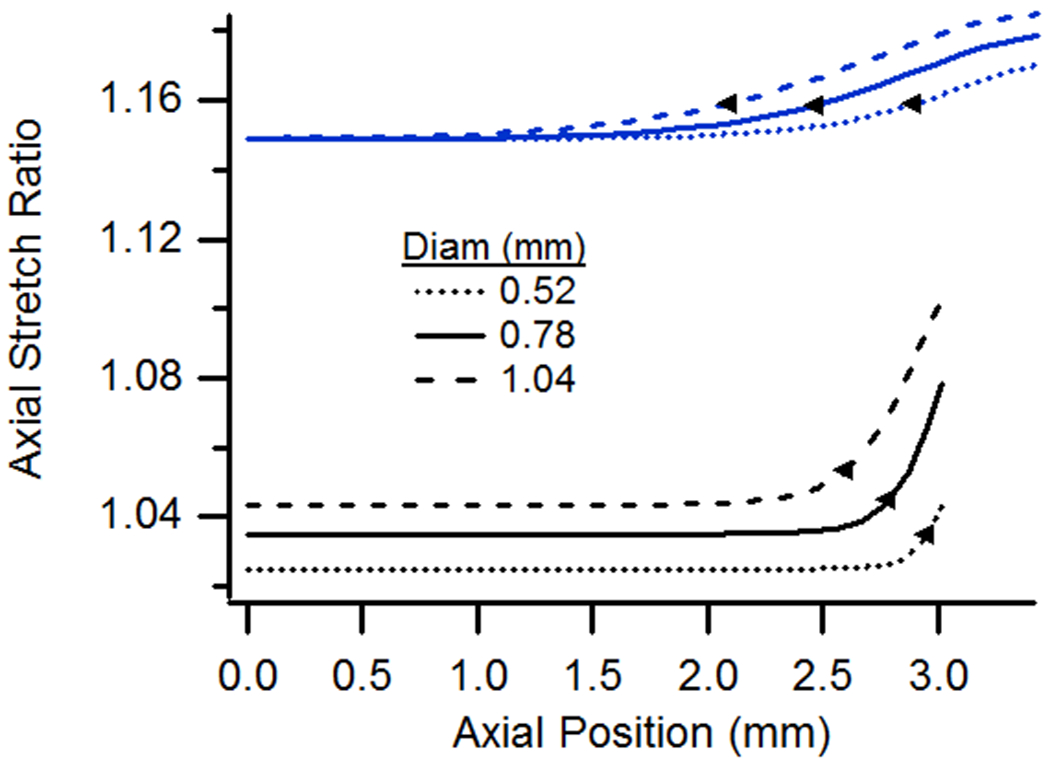
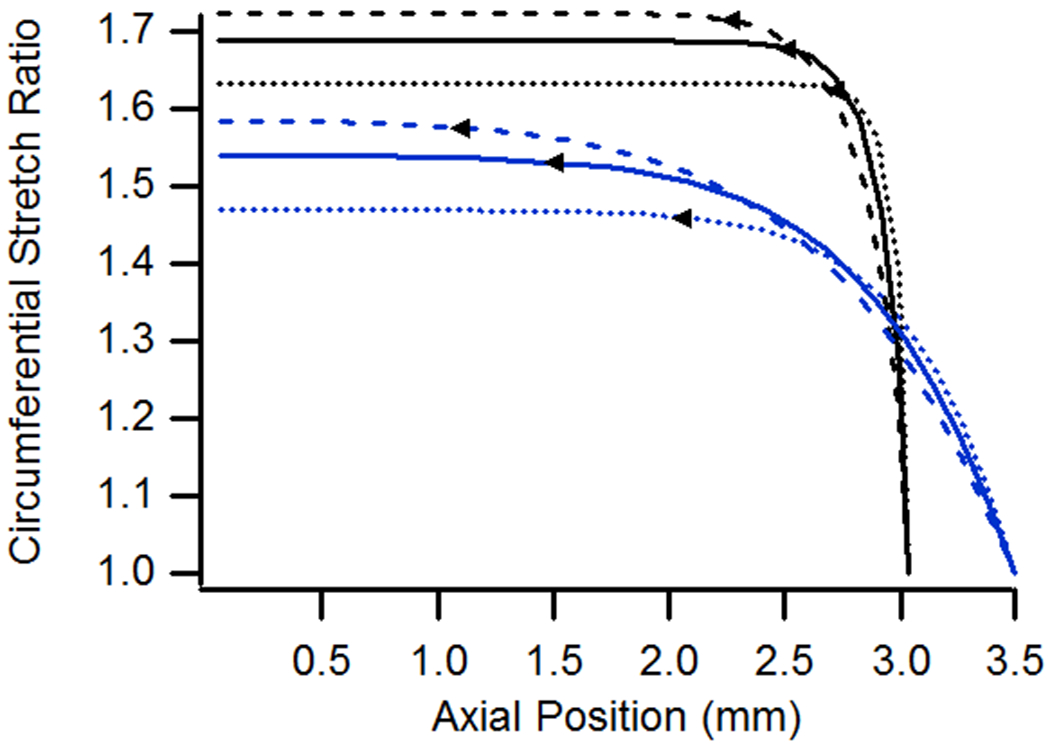
(a) Axial and (b) circumferential stretch ratios as a function of axial position for vessels with diameters ranging from 0.52 to 1.04 mm. All specimens had a length of 6.075 mm, were pressurized at 13 kPa, and were stretched axially to n-t-n ratios of either 1.0 or 1.15.
Except for the case of a pressurized but unstretched vessel, the influence of specimen length on the extent of end effects was minimal, whether axial or circumferential stretch ratios were considered (Fig. 6). As a result, plots of stretch distributions for one length can almost simply be shifted to represent that of a different length. In the case of an unstretched vessel, however, both the length of the affected region and the magnitude of axial stretch were less for longer vessels. Axial stretch ratios were lower in longer vessels since the axial stretch required to accommodate the same increase in diameter was spread out over more tissue.
Figure 6.
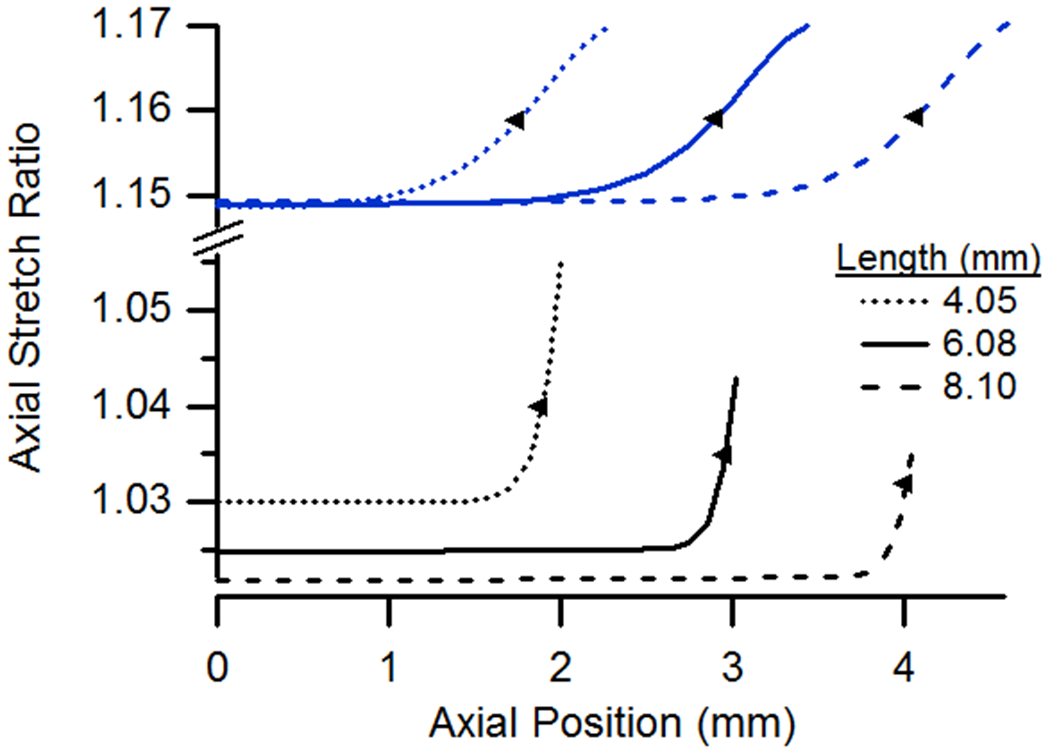
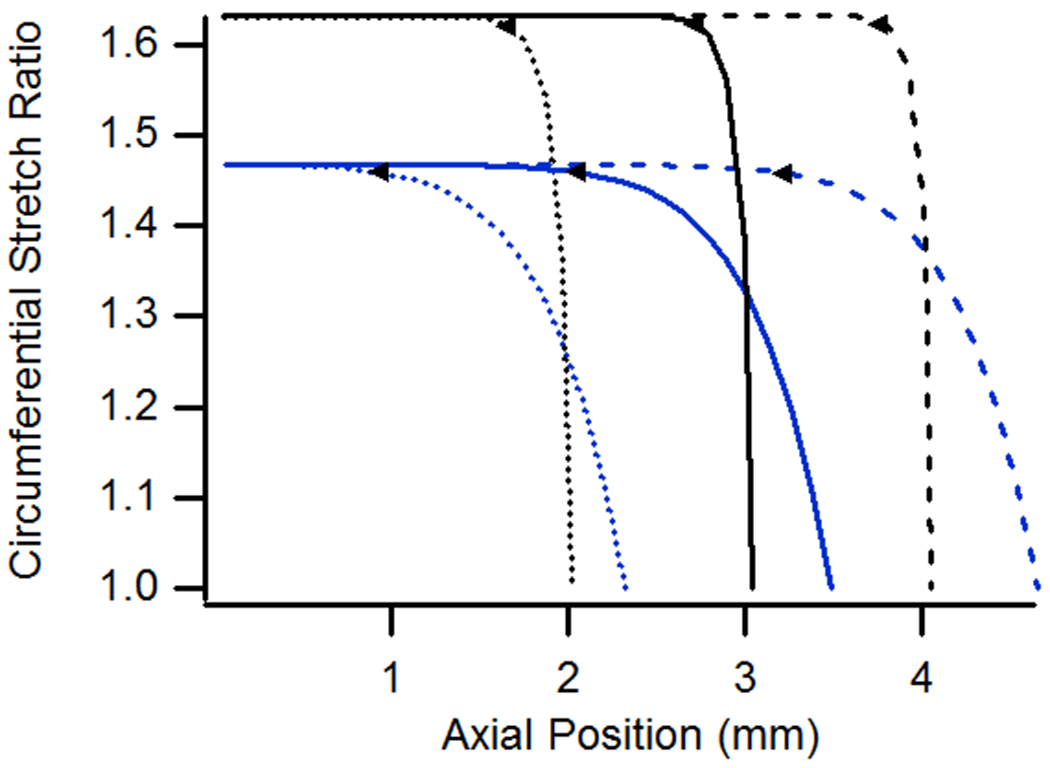
(a) Axial and (b) circumferential stretch ratios as a function of axial position for vessels having lengths of 4.05, 6.08, and 8.10 mm. All cases were pressurized at 13 kPa and stretched axially to n-t-n ratios of 1.0 or 1.15.
Needle Size
Because needles used in testing are only available in discrete sizes and usually don’t exactly match the diameter of the specimen, the model was also analyzed for different needle-to-vessel diameter ratios. In these cases, the extent of end effects was found to increase only slightly with smaller needles (Fig. 7). However, axial stretch values were higher both in the midsection and at the ends in cases utilizing smaller needles. Differences in circumferential stretch values were minimal except at the ends. It is not clear why the axial stretch ratio reached a maximum value at a point away from the end for the case with a needle ratio of 0.8 and a n-t-n stretch of 1.15 (Fig. 7a).
Figure 7.
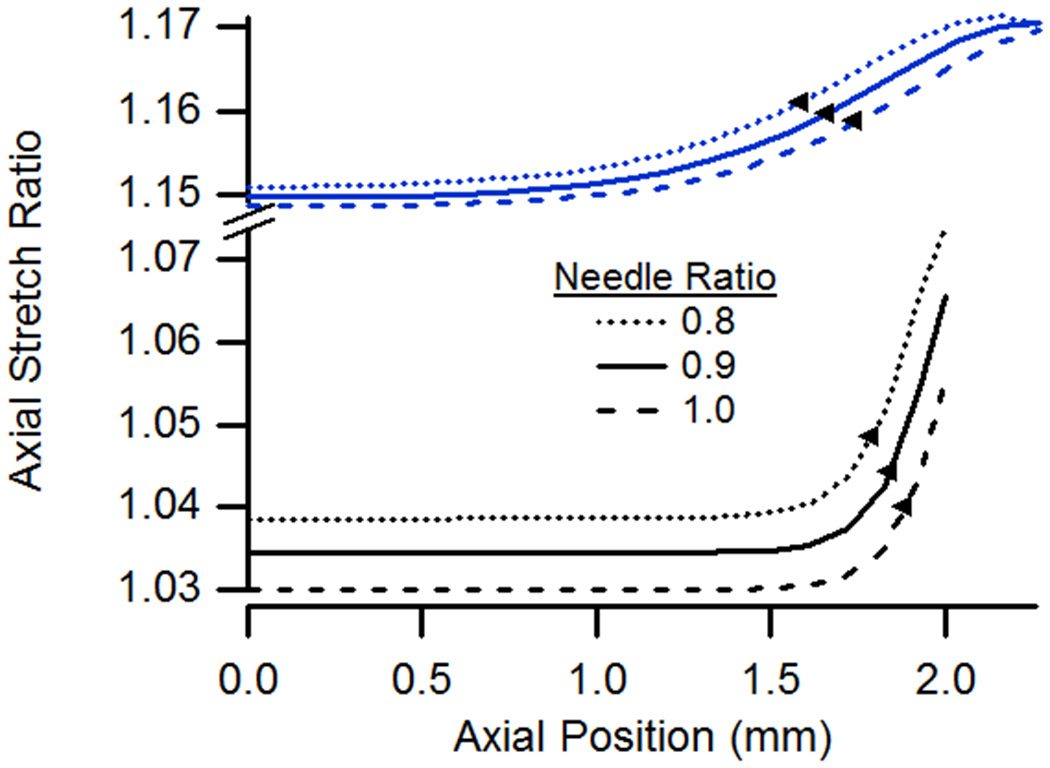
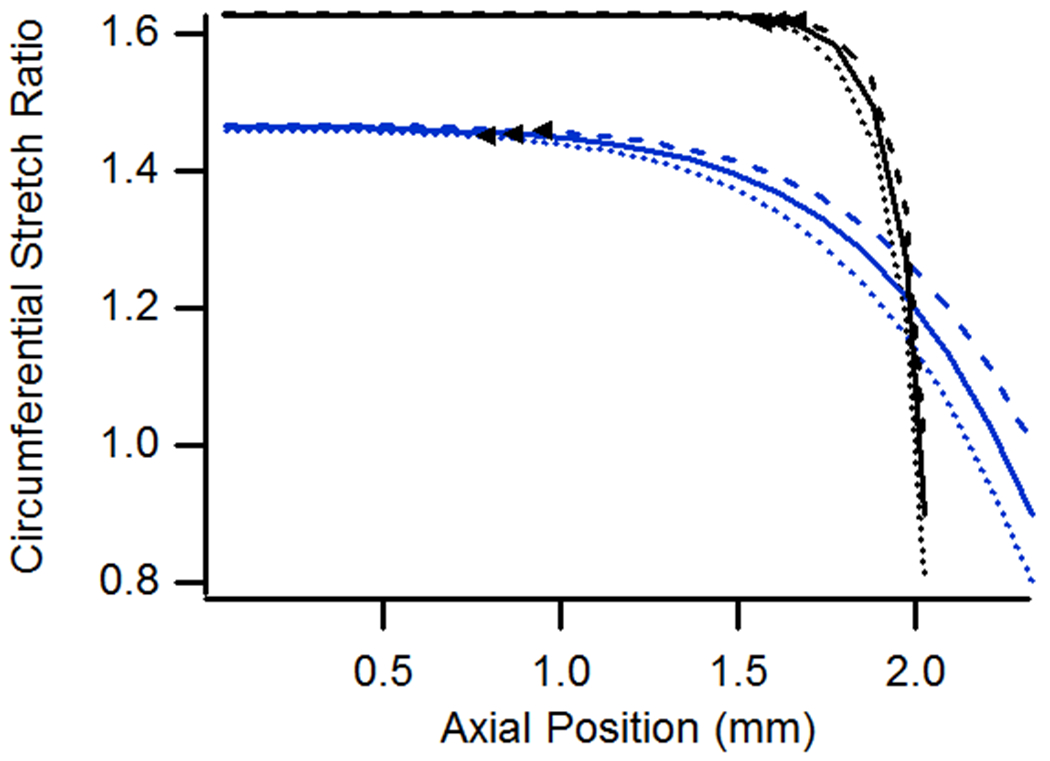
(a) Axial and (b) circumferential stretch ratios as a function of axial position for vessels constrained by needles having diameters equal to 0.8, 0.9, or 1.0 times the specimen diameter. All vessels had lengths of 4.05 mm, were pressurized at 13 kPa, and were stretched axially to n-t-n ratios of 1.0 or 1.15.
Material Properties
The influence of changing constitutive model parameters is illustrated in Fig. 8. Using the baseline case as reference, decreasing the value of c2 while holding c1 constant produced an increasingly softer vessel overall, leading to higher stretch values in both the axial and circumferential directions. The opposite trend was observed when c1 was increased while holding c2 constant since the approach resulted in a stiffer vessel overall. As the figure shows, decreasing the value of c2 had little influence on the extent of axial stretch end effects for the considered threshold, but it did significantly change the distribution of axial stretch along the vessel length, with a much higher peak value at the vessel end and a longer, flatter midsection region, suggesting that end effects decay more quickly in vessels with lower axial stiffness. This is also apparent from results based on the circumferential stretch ratio. Increasing the value of c1, while holding c2 constant, significantly reduced the extent of end effects as determined from both axial and circumferential stretch ratios. These results show that the region influenced by end effects is reduced by either stiffening the circumferential response or by softening the axial response.
Figure 8.
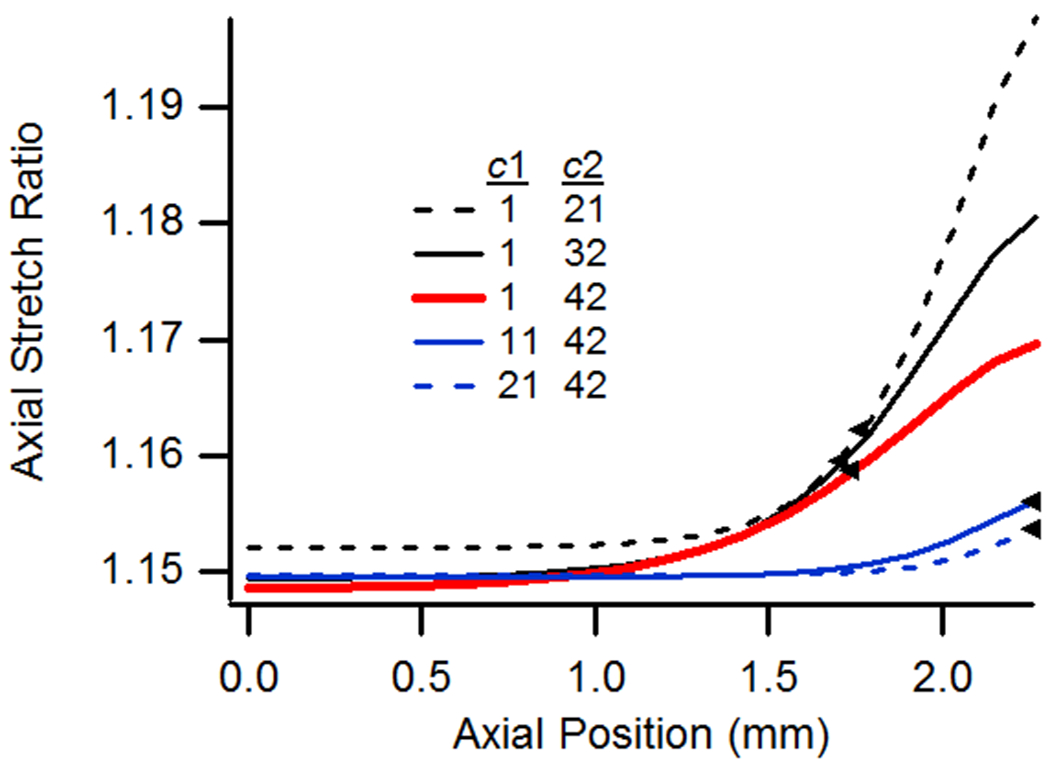
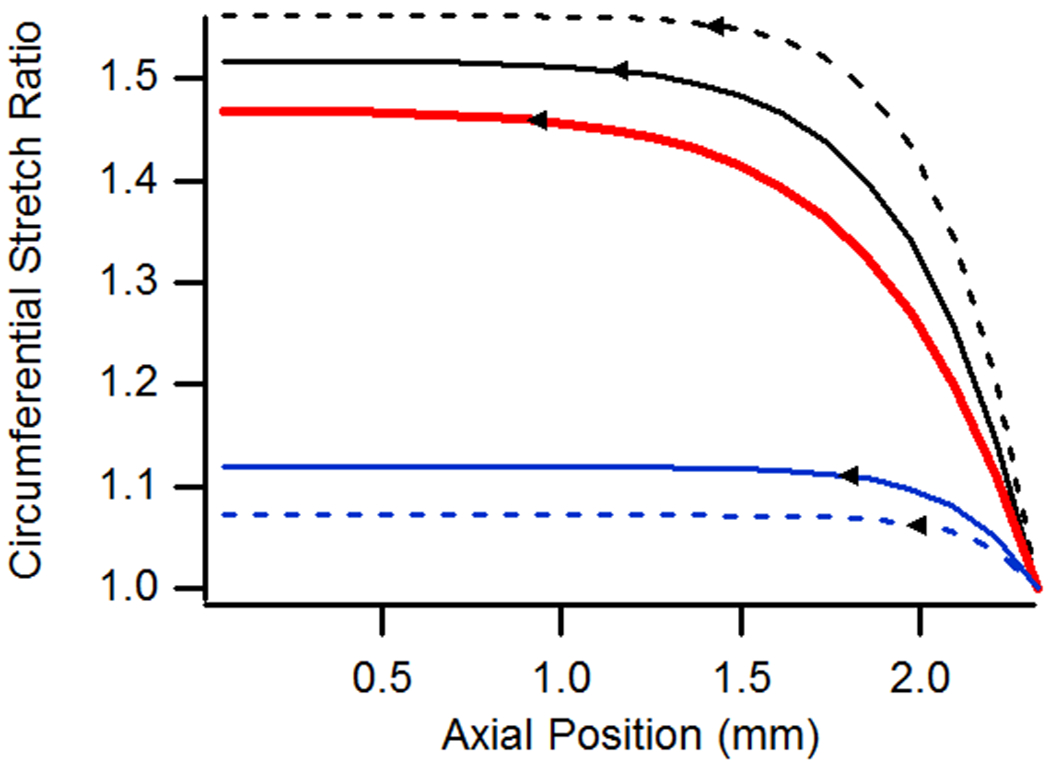
(a) Axial and (b) circumferential stretch ratios as a function of axial position for vessels with variations in material parameters c1 and c2. All cases utilized the baseline geometry, a n-t-n axial stretch of 1.15, and were pressurized at 13 kPa.
Discussion
The objective of this study was to define the extent of end effects in a blood vessel subjected to isolated testing, using a computational model. Based on each of the investigated parameters, it is clear that the extent to which end effects propagate into a blood vessel from its attachment points varies significantly. As a general rule, the length of the region disturbed by these end effects increases with the difference between the diameter of the needle and the equilibrium diameter of the blood vessel for the imposed loading conditions. An increased disturbed length was observed in simulations where pressure, diameter, or axial stiffness (c2) were increased or where needle-to-vessel diameter ratio or circumferential stiffness (c1) were decreased.
Model results clarify the nature of the deformations in an isolated blood vessel, including showing that axial stretch is greatest near the needles. Given the experimental measurements of Fig. 1, one might expect axial stretch values at the vessel ends to be relatively low in order for the average stretch to be equal to n-t-n values. In the simulation, however, it is clear that the vessel wall near the needles rotates out of the plane of the vessel axis. As a result, the directions of local axial stretch at the vessel ends and midsection do not coincide. This local rotation occurs to accommodate internal pressure via axial stretch since circumferential expansion is constrained by the connection with the needle. In the region between the needle and midsection, the wall rotates back toward a plane including the vessel axis, and circumferential, instead of axial, strains increasingly account for changes in diameter. Due to multiaxial effects, the relatively large circumferential deformations within the midsection prevent the axial direction from stretching as freely as it did near the needle, where loading was largely uniaxial. As a result, axial stretch is at a minimum at the axial center of the vessel.
Little guidance is provided in the literature with respect to how extensive end effects may be in blood vessel testing. Most investigators have simply stated that it is important to not make measurements too close to points of constraint, or attachment. Brossollet and Vito avoided problems with end effects by limiting their video strain measurements to portions of the specimen that were at least two vessel diameters from the point of constraint, but no basis was given for this requirement [2]. For the specific sets of parameters and acceptable error presented here, this guide appears to be particularly conservative, but the material properties of the canine saphenous veins studied by Brossollet and Vito were likely different than those utilized here. Because the present study has not been applied to all possible vessel properties, it does not answer the end effects question for all future vessel experiments, but it does provide a qualitative guide with respect to the contributions of different parameters.
Given the observed interplay between axial and circumferential stretch, the model also indicates that axial stretch is expected to be uniform in regions where vessel diameter is uniform. For the material properties studied in the model, end effects determined from circumferential stretch measurements were generally more extensive than those based on axial stretch so that reasonably accurate axial stretch measurements could still be made in regions where diameter was not quite uniform; comparison of the visual images of Fig. 2 with the data of Fig. 3 confirm this. As a result, it appears that a reasonable midsection region for any vessel can be approximated by observing the vessel profile and limiting analysis to the portion of the vessel where diameter does not change significantly; this approach is still qualitative but provides another point of guidance.
The extent of end effects may be studied by considering both axial and circumferential deformations, and simulation results show that predictions using either approach increase and decrease together. Because it is most often simple to measure diameter at the vessel axial center, the primary question involving end effects usually relates to what portion of the vessel length may be appropriately used for axial measurements. As a result, this project focused on results obtained from end effects predictions using axial stretch, though predictions from circumferential stretch were also presented.
Although vessel failure was not a specific point of study in this project, the predicted increase in axial stretch values at the point of constraint helps further explain why vessel failure tests most commonly result in tearing at the needle, in addition to the presence of radial stresses imposed by sutures and potential damage incurred at the time of suture tying.
While the presented results provide valuable insights into isolated vessel deformations and the extent of end effects, it is important to state limitations of the approach utilized. These include that the membrane model assumes stresses out of the plane of the wall to be negligible. The similarity between experimental and computational results, however, suggests that this assumption is reasonable for the loading conditions explored. Further, while the computational framework is described as fiber-based, it should be clear that the approach did not attempt to model the actual vessel fiber architecture, though it could be applied in this fashion. The model should thus be considered phenomenological rather than microstructural. Additionally, the selected approach ignores any contribution from non-fiber components of the vessel wall.
Acknowledgement
Funding for this study was partially provided by the National Institutes of Health (K25HD048643).
References
- [1].Downs J, Halperin HR, Humphrey J, and Yin F, 1990, “An improved video-based computer tracking system for soft biomaterials testing,” IEEE Trans Biomed Eng, 37(9), pp. 903–907. [DOI] [PubMed] [Google Scholar]
- [2].Brossollet LJ, and Vito RP, 1995, “An alternate formulation of blood vessel mechanics and the meaning of the in vivo property,” J Biomech, 28(6), pp. 679–687. [DOI] [PubMed] [Google Scholar]
- [3].Humphrey JD, 1995, “Mechanics of the arterial wall: review and directions,” Crit Rev Biomed Eng, 23(1–2), pp. 1–162. [PubMed] [Google Scholar]
- [4].Fung YC, 2004, Biomechanics: Mechanical properties of living tissues, Springer, New York. [Google Scholar]
- [5].Monson KL, Goldsmith W, Barbaro NM, and Manley GT, 2003, “Axial mechanical properties of fresh human cerebral blood vessels,” J Biomech Eng, 125(2), pp. 288–294. [DOI] [PubMed] [Google Scholar]
- [6].Monson KL, Barbaro NM, and Manley GT, 2008, “Biaxial response of passive human cerebral arteries,” Ann Biomed Eng, 36(12), pp. 2028–2041. [DOI] [PMC free article] [PubMed] [Google Scholar]
- [7].Zohdi TI, and Powell D, 2006, “Multiscale construction and large-scale simulation of structural fabric undergoing ballistic impact,” Computer Methods in Applied Mechanics and Engineering, 195(1–3), pp. 94–109. [Google Scholar]
- [8].Zohdi TI, 2007, “A computational framework for network modeling of fibrous biological tissue deformation and rupture,” Computer Methods in Applied Mechanics and Engineering, 196(31–32), pp. 2972–2980. [Google Scholar]


