

Abstract
Neurons have recently emerged as essential cellular constituents of the tumour microenvironment, and their activity has been shown to increase the growth of a diverse number of solid tumours1. Although the role of neurons in tumour progression has previously been demonstrated2, the importance of neuronal activity to tumour initiation is less clear–particularly in the setting of cancer predisposition syndromes. Fifteen per cent of individuals with the neurofibromatosis 1 (NF1) cancer predisposition syndrome (in which tumours arise in close association with nerves) develop low-grade neoplasms of the optic pathway (known as optic pathway gliomas (OPGs)) during early childhood3,4, raising the possibility that postnatal light-induced activity of the optic nerve drives tumour initiation. Here we use an authenticated mouse model of OPG driven by mutations in the neurofibromatosis 1 tumour suppressor gene (Nf1)5 to demonstrate that stimulation of optic nerve activity increases opticglioma growth, and that decreasing visual experience via light deprivation prevents tumour formation and maintenance. We show that the initiation of Nf1-driven OPGs (Nf1-OPGs) depends on visual experience during a developmental period in which Nf1-mutant mice are susceptible to tumorigenesis. Germline Nf1 mutation in retinal neurons results in aberrantly increased shedding of neuroligin 3 (NLGN3) within the optic nerve in response to retinal neuronal activity. Moreover, genetic Nlgn3 loss or pharmacological inhibition of NLGN3 shedding blocks the formation and progression of Nf1-OPGs. Collectively, our studies establish an obligate role for neuronal activity in the development of some types of brain tumours, elucidate a therapeutic strategy to reduce OPG incidence or mitigate tumour progression, and underscore the role of Nf1mutation-mediated dysregulation of neuronal signalling pathways in mouse models of the NF1 cancer predisposition syndrome.
Childhood NF1-OPGs have a predictable anatomical and temporal incidence, and occur in a neural circuit that is amenable to experimental manipulation. To study the influence of neuronal activity on low-grade glioma growth and on glioma initiation and maintenance, we leveraged an authenticated genetically engineered mouse model of low-grade NF1-associated OPG with high tumour penetrance (>95%) and a well-characterized timeline of tumour progression. Similar to children with NF1-OPG6, this Nf1flox/mut;Gfap::cre genetically engineered mouse model (hereafter, Nf1OPG) recapitulates both the germline NF1 mutation (Nfl heterozygosity (Nf1+/−) in stromal cells) and the acquired somatic NF1 mutation in tumour-initiating cells (Nf1 loss (Nf1−/−) in neural progenitor cells)5,7. These mice develop low-grade optic nerve or chiasm gliomas, as evidenced by predictable increases in optic nerve volume and proliferation relative to wild-type controls that consistently begins before nine weeks of age8, which makes them a tractable system to study the role of neuronal activity in glioma initiation. In addition, the tumour cells grow around the axons of a single type of neuron: retinal ganglion cells (RGCs) (Fig. 1a), which are neurons that transmit light-induced information from the retina to the brain through the optic nerve.
Fig. 1 |. The initiation and maintenance of Nf1-OPGs requires retinal activity.

a, Schematic depicting the optic nerve (RGC (orange) axons) with optic glioma cells (green) and the position of the fibre optic. b, Optogenetic stimulation paradigm. Yellow bars, 12-h light/12-h dark cycles. Hatched pattern, optogenetic stimulation period. Arrow, tumour initiation. w, weeks of age. c, Optic nerves from unstimulated (n = 6) and stimulated (n = 6) Nf1OPG;Thy1::ChR2-YFP mice. Asterisks, region of volume measurement. Scale bar, 1 mm. d, Dark-rearing paradigm. Half yellow and grey lightbulbs + yellow bars, regular 12-h light/12-h dark cycles (12:12). Grey lightbulbs + black bars, dark-rearing (24-h dark) periods. Arrow, tumour initiation. n = 5 (wild type (WT) 12:12), 11 (Nf1OPG 12:12), 7 (Nf1OPG dark, 9–16 weeks old), and 9 (Nf1OPG dark, 12–16 weeks old) mice. e, Optic nerve volume (left) and proliferation (per cent Ki67+ cells) (right) of mice indicated in d. f, Optic nerve proliferation and volume plots for wild-type (orange) and Nf1OPG mice reared in regular light cycles (yellow) or dark-reared from 9–16 weeks (cyan) or 12–16 weeks (dark blue) of age. Tumour is gated against volume and proliferation of 16-week-old wild-type mice (22 mice raised in regular light cycles; grey regions mark the range of values). g, Representative immunofluorescence images showing RGCs (white, BRN3A+; blue, DAPI) in the RGC layer, and quantification of per cent BRN3A+ cells. n = 5 (wild type 12:12), 13 (Nf1OPG 12:12), and 7 (Nf1OPG dark, 6–16 weeks old). Scale bar, 10 μm. h, i, As in e, f, with dark-rearing from 6 to 16 weeks (cyan) or 6–12 weeks (dark blue) of age. n = 5 (wild type 12:12), 7 (Nf1OPG 12:12), 6 (Nf1OPG dark, 6–16 weeks old), and 12 (Nf1OPG dark, 6–12 weeks old). Data are mean ± s.e.m. NS, not significant (P > 0.05). Each data point is one mouse in c, e–i. Unpaired t-test with Welch’s correction (c). Brown–Forsythe and Welch analysis of variance (ANOVA) tests with Dunnett’s T3 correction for multiple comparison (e, volume, F = 13.67, P < 0.0001; g, F = 9.054, P = 0.0048; h, volume, F = 29.51, P < 0.0001). Kruskal–Wallis test with Dunn’s correction for multiple comparisons (e, h, proliferation, P < 0.0001). All tests were two-sided. Illustrations created with BioRender.com (a, d).
Neuronal activity promotes OPG growth
Previous studies have revealed that neuronal activity drives the growth of high-grade gliomas9. To determine whether neuronal activity directly drives the initiation or growth of Nf1-OPGs, we optogenetically stimulated a unilateral (right) optic nerve in Nf1OPG;Thy1::ChR2-YFP mice, in which channelrhodopsin (ChR2) is expressed in RGCs (Fig. 1a, Extended Data Fig. 1a, b). The RGC axons of Nf1OPG;Thy1::ChR2-YFP mice were stimulated with blue light, which activates ChR2 to induce action potentials10, from 6 to 12 weeks of age (20-Hz blue-light pulses, 15-s-on, 45-s-off cycles during 15-min stimulation sessions every other day), which represents a period of time that includes both tumour initiation and growth in Nf1-OPG mice8. We analysed optic nerves at 16 weeks of age to allow sufficient time for tumour growth (Fig. 1b). Compared to control Nf1OPG;Thy1::ChR2-YFP mice that were similarly manipulated with fibre optic placement, but were not stimulated with light (unstimulated), blue-light-stimulated (stimulated) Nf1OPG;Thy1::ChR2-YFP mice exhibited increased optic nerve volumes (Fig. 1c). The proliferation rates (per cent Ki67+ cells) were similar in both groups at 16 weeks of age (4 weeks after the end of light stimulation) (Extended Data Fig. 1c), reflecting the proliferation index without optogenetic stimulation (Fig. 1b). We plotted optic nerve volumes and proliferation rates for each mouse, which revealed that the optic nerves from unstimulated and stimulated groups were clearly distinct (Extended Data Fig. 1d). In addition to increased volumes, optic nerves that were optogenetically stimulated from 6 to 12 weeks of age exhibited an increased per cent of S100β+ (glial or glioma) cells at 16 weeks of age8, but no difference in microglial cell content (per cent IBA1+ cells), relative to unstimulated, tumour-bearing mice (Extended Data Fig. 1e). Taken together, these findings demonstrate that optic nerve activity can increase Nf1-OPG growth.
OPG formation requires visual experience
The activity of the neuronal circuit in which Nf1-OPGs reside can be manipulated by modulating environmental light conditions11,12 (Extended Data Fig. 1f). Rearing mice in complete darkness decreases RGC activity, and this decreased retinal activity requires a few days to return to baseline levels after the re-establishment of regular light cycles12. Pattern electroretinography (which measures the retinal response to a pattern of light) demonstrated reduced RGC activity during dark-rearing (Extended Data Fig. 1f), as expected12. To determine the effect of decreasing visual experience on Nf1-OPG initiation and growth, we reared Nf1OPG mice in the dark from 9 weeks of age (when tumours begin to form8) to 16 weeks of age (Fig. 1d). Whereas tumours developed in all of the Nf1OPG mice (11 out of 11 mice) (Fig. 1e, f) that were raised in regular light cycles (12-h light and 12-h dark), only 1 of 7 Nf1OPG mice that were reared in darkness from 9 to 16 weeks of age contained a tumour (as defined by increased optic nerve volume and proliferation). Similarly, small tumours were detected in only 2 of 9 Nf1OPG mice that were dark-reared from 12 to 16 weeks of age, when tumours have already formed (Fig. 1d–f), which indicates a requirement for visual experience in the maintenance of Nf1-OPGs.
To further explore the effects of visual experience on the initiation of Nf1-OPGs, we dark-reared Nf1OPG mice from 6 weeks of age–representing a time point before tumour formation (which occurs by 9 weeks of age)8–and analysed them at 16 weeks of age (Extended Data Fig. 1g). Nf1OPG mice that were dark-reared from 6 to 16 weeks of age had no evidence of tumours (0 out of 6 mice), with no change in optic nerve volume, proliferation or per cent of S100β+ cells relative to wild-type (no tumour) controls, whereas tumours formed in all of the Nf1OPG mice raised in regular light cycles (Fig. 1h, i, Extended Data Fig. 2a, b). Vision loss is a major consequence of OPGs in children with the NF1 cancer predisposition syndrome, and is demonstrated in Nf1OPG mice by tumour-induced thinning of the retinal nerve fibre layer and RGC death (especially in female mice)13; we therefore examined the effects of dark-rearing on retinal health. We found that dark-rearing rescues the RGC death observed in female Nf1OPG mice that are reared in regular light cycles (Fig. 1g); dark-rearing did not affect the number of RGCs in wild-type mice (Extended Data Fig. 2c). Thus, reducing visual experience in this mouse model prevents tumour formation and rescues the associated retinal damage.
To better define the window of tumour susceptibility in which modulating visual experience alters oncogenesis, we shortened the dark-rearing period from 6–16 weeks of age to 6–12 weeks of age, followed by regular light cycles until 16 weeks of age (Extended Data Fig. 1g). We found that tumours did not form in Nf1OPG mice that were dark-reared for this shorter period (0 out of 12 mice) (Fig. 1h, i, Extended Data Fig. 2a, b). To distinguish between complete abrogation of tumour formation and delayed onset of tumorigenesis, we analysed these dark-reared mice at 12 weeks after returning to regular light cycles (Extended Data Fig. 2d). At 24 weeks of age, 0 out of 6 mice developed OPGs after dark-rearing from 6 to 12 weeks of age (Extended Data Fig. 2e, f). This dark-rearing paradigm also normalized the increased microglial infiltration that we observed in regular-light-reared Nf1OPG mice, without affecting the density of CD8+ T cells or PDGFRα+ oligodendrocyte precursor cells (Extended Data Fig. 2g–i).
We next sought to determine whether alteration of the circadian cycle contributes to the observed effects of dark-rearing on the initiation of Nf1-OPGs. Because the intrinsic circadian clock of mice oscillates on a cycle of slightly less than 24 h in length when exposed to constant darkness14, we asked whether non-entrained circadian rhythms (as a result of dark-rearing) contribute to tumour initiation. We reared Nf1OPG mice in the dark and entrained them to a 24-h circadian cycle using short light exposures at subjective day–night transitions15. Entraining mice to normalize the circadian cycle did not change the tumour-blocking effect conferred by complete darkness (Extended Data Fig. 3). Collectively, our findings firmly establish that visual experience is necessary for the initiation of Nf1-OPGs during a susceptible period of postnatal development.
NLGN3 promotes optic gliomagenesis
Cortical neuronal activity drives tumour growth in high-grade gliomas9,16, in part through paracrine mechanisms that include neuronal activity-regulated secretion of brain-derived neurotrophic factor (BDNF) and the shedding of the synaptic adhesion protein NLGN39. Moreover, activity-regulated NLGN3 shedding in the tumour microenvironment is required for the progression of high-grade glioma in xenograft models17 and correlates with patient survival9. To explore activity-regulated paracrine mechanisms in the Nf1-mutant optic nerve, we optogenetically stimulated combined retina and optic nerve explants (Extended Data Fig. 4a) and found that retinal activity similarly increased the secretion of BDNF and NLGN3 (Extended Data Fig. 4a). To determine whether BDNF or NLGN3 is also important for the growth of low-grade glioma, we exposed mouse optic glioma cells18 to each paracrine factor in vitro and found that both BDNF and NLGN3 increased the proliferation of low-grade glioma cells (Fig. 2a, Extended Data Fig. 4b, c). However, treating Nf1OPG mice with entrectinib (a brain-penetrant inhibitor of the BDNF receptor TrkB)19 from 6 to 16 weeks of age did not affect the initiation or growth of Nf1-OPGs (Extended Data Fig. 4d–f). Given the important roles that microenvironmental NLGN3 has in the pathobiology of high-grade glioma9,16,17, we next focused on the role of NLGN3 in the initiation and maintenance of Nf1-OPGs.
Fig. 2 |. NLGN3 promotes Nf1 optic gliomagenesis.

a, Nf1-OPG cell proliferation (EdU incorporation) in response to recombinant NLGN3. n = 4,3,3 and 3 wells (vehicle, 10 nM, 30 nM and 70 nM, respectively). OPG proliferation index, per cent EdU+ cells relative to vehicle group. b, Nlgn3 qRT–PCR of Nf1-OPG cells incubated with vehicle or 30 nM NLGN3. n = 3 wells per group. Nlgn3 index, Nlgn3 mRNA levels relative to vehicle group. c, RNA-seq of optic nerves from four different Nf1-OPG genetically engineered mouse models (GEMMs)20 (OPG-1 to OPG-4) and wild-type mice demonstrates increased Nlgn3 levels in OPGs relative to wild-type optic nerves at 12 weeks of age. Padj, adjusted P value. d, NLGN3 levels in optic nerves from Nf1OPG (OPG-1) (n = 7) relative to wild-type (n = 6) mice at 12 weeks of age, normalized to β-actin (NLGN3 index). e, NLGN3 mRNA levels in NF1-associated human pilocytic astrocytoma (NF1-PA) (n = 9), sporadic pilocytic astrocytoma (S-PA) (n = 10) and non-neoplastic brain (NB) (n = 5) samples. f, Nf1OPGNlgn3KO mouse generation. Created with BioRender.com. g, Representative Ki67 immunohistochemistry images from wild-type, Nlgn3KO, Nf1OPG and Nf1OPGNlgn3KO mice (n = 3, 4, 7 and 8, respectively). Arrows, Ki67+ cells. Scale bar, 20 μm. h, Optic nerve volume (left) and proliferation (per cent Ki67+ cells) (right) of wild-type (n = 3), Nlgn3KO (n = 4), Nf1OPG (n = 7) and Nf1OPGNlgn3KO (n = 8) mice reared in regular light cycles. i, Optic nerve volume and proliferation plots (as in Fig. 1) shows no OPG (tumour) in 6 out of 8 Nf1OPGNlgn3KO mice. NS, not significant (P > 0.05). Data are mean ± s.e.m. Each data point is one mouse in d, h, i. Brown–Forsythe and Welch ANOVA tests with Dunnett’s T3 correction for multiple comparison (a, F = 27.46, P = 0.0001; e, F = 7.16, P = 0.011; h, volume, F = 10.25, P = 0.0004). Unpaired t-test with Welch’s correction (b, d). Kruskal–Wallis test with Dunn’s correction for multiple comparisons (h, proliferation, P = 0.0016). All tests were two-sided.
NLGN3 binding regulates NLGN3 transcription in high-grade glioma cells through an as-yet unidentified receptor, and leads to increased tumour expression of NLGN3 mRNA and NLGN3 protein in a feed-forward manner; levels of NLGN3 in high-grade glioma cells are thus an indicator of NLGN3 exposure in the tumour microenvironment9. We found that exposure to recombinant NLGN3 increases Nlgn3 transcript levels in mouse optic glioma cells, which indicates feed-forward regulation of NLGN3 expression in low-grade Nf1-OPGs similar to that observed in high-grade glioma (Fig. 2b). Having confirmed Nlgn3 gene expression as an indicator of NLGN3 signalling in low-grade glioma, we then examined NLGN3 expression in both human and mouse low-grade glioma. We found increased Nlgn3 expression in the optic nerves from four genetically distinct mouse models of Nf1-OPG20, relative to wild-type controls (Fig. 2c). Consistent with these observed transcriptional changes, NLGN3 protein levels were also increased in the optic nerves from Nf1OPG mice (Fig. 2d). Similarly, RNA sequencing (RNA-seq) of human low-grade glioma (pilocytic astrocytoma) samples revealed increased transcript levels of NLGN3 in both NF1-associated and sporadic pilocytic astrocytomas relative to non-neoplastic brain tissues (Fig. 2e). We found the same pattern of increased NLGN3 expression in human NF1-associated pilocytic astrocytoma samples by quantitative PCR (Extended Data Fig. 5a) and in an independent, previously published microarray dataset21 (GSE44971) (Extended Data Fig. 5b). No correlation between NLGN3 expression and sex, tumour location or age was found in the RNA-seq dataset (Extended Data Fig. 5c), whereas analyses of the microarray dataset21 suggest a potential association between NLGN3 levels and tumour location (Extended Data Fig. 5d). Whether other driver mutations (for example, BRAF fusion) of sporadic pilocytic astrocytoma similarly regulate NLGN3 expression remains to be determined. Consistent with previous findings that NLGN3 induces glioma transcription of synapse-associated genes in high-grade gliomas16, pilocytic astrocytomas containing high levels of NLGN3 are enriched for synapse-associated and other neuronal gene signatures, whereas pilocytic astrocytomas containing lower levels of NLGN3 are enriched for immune-related gene expression signatures (Extended Data Fig. 5e, f). Whether the neuron-to-glioma synapses found in high-grade gliomas16,22 also occur in low-grade gliomas remains a question for future work. Taken together, these observations raise the possibility that neuronal activity-regulated NLGN3 shedding into the tumour microenvironment drives the formation and growth of low-grade glioma.
On the basis of these findings, we tested the role of NLGN3 in the initiation and maintenance of Nf1-OPGs by intercrossing Nf1OPG and Nlgn3-knockout (Nlgn3KO) mice (Fig. 2f). Nf1OPGNlgn3KO mice exhibited largely normal optic nerve volumes and proliferation rates at 16 weeks of age, despite rearing in regular light cycles (Fig. 2g–i). Only two Nf1OPGNlgn3KO mice (out of 8 mice; 25%) contained small tumours relative to a 100% (7 out of 7) tumour incidence in Nf1OPG mice wild type for Nlgn3 (Fig. 2i), thus establishing a role for NLGN3 in promoting the initiation and maintenance of Nf1-OPG.
Nf1 mutation increases NLGN3 shedding
A heterozygous Nf1-mutant microenvironment is necessary for Nf1-OPG formation: mice with Nf1 loss only in the putative cell of origin do not form tumours5. Nf1 optic gliomagenesis in mice requires the coupling of somatic Nf1 loss in neural progenitor cells with a heterozygous Nf1 mutation in non-neoplastic (stromal) cells5, similar to patients with the NF1 cancer predisposition syndrome. This obligate coupling suggests that the formation of Nf1-OPGs is dependent on the effects of Nf1 mutation on stromal cell interactions. In light of these observations, we sought to investigate the effect of Nf1 mutation on activity-regulated NLGN3 shedding and NLGN3-driven optic gliomagenesis. We first confirmed that NLGN3 shedding in the Nf1-heterozygous optic nerve is regulated by neuronal activity, as it is in the brain9,16. We performed an intravitreal tetrodotoxin injection to block retinal activity23, which caused a decrease in NLGN3 shedding in the optic nerve and indicated that NLGN3 shedding is regulated by neuronal activity in the optic nerves of Nf1+/− mice (Fig. 3a, b). To test whether Nf1 mutation modulates activity-regulated NLGN3 shedding, we measured NLGN3 shedding in retina and optic nerve explant preparations from Nf1+/+;Thy1::ChR2 and Nf1+/−;Thy1::ChR2 mice. For each mouse, one eye was assigned to the unstimulated group (dark and tetrodotoxin23), and the other eye to the blue-light-stimulated group. Although some RGCs and photoreceptors express endogenous opsins, ChR2 expression increases RGC responses to facilitate measurement of activity-regulated secreted proteins. Immunoblotting for cleaved caspase-3 in these retinal preparations shows that this paradigm does not cause apoptosis (Extended Data Fig. 6a). Baseline levels of shed NLGN3 in the conditioned medium from unstimulated explants were the same between Nf1+/+;Thy1::ChR2 and Nf1+/−;Thy1::ChR2 explants (Extended Data Fig. 6b). Retina and optic nerve explant preparations from Nf1+/+;Thy1::ChR2 mice demonstrated no difference in NLGN3 shedding between unstimulated and stimulated conditions (Fig. 3c). This suggests that, unlike the cortex9, the retina and optic nerve exhibit little activity-regulated NLGN3 shedding in wild-type mice. By contrast, retina and optic nerve explant preparations from Nf1+/−;Thy1::ChR2 mice demonstrated increased NLGN3 shedding in response to light stimulation (Fig. 3c). To further establish that Nf1 mutation increases neuronal activity-regulated NLGN3 shedding, we measured NLGN3 shedding in the optic nerves of Nf1+/+ and Nf1+/− mice after three weeks of dark-rearing (from 6 to 9 weeks of age) (Fig. 3d). Concordantly, shed NLGN3 levels were similar in the optic nerves of wild-type mice that were reared in dark or in regular light cycles, and in dark-reared wild-type and Nf1+/− mice (Fig. 3e, Extended Data Fig. 6c). However, shed NLGN3 levels were increased in the optic nerves of Nf1+/− mice that were raised in regular light cycles relative to those reared in the dark (Fig. 3e). Thus, Nf1 mutation aberrantly increases neuronal activity-regulated NLGN3 shedding in the optic nerve.
Fig. 3 |. Nf1 mutation increases activity-regulated NLGN3 shedding and inhibition of NLGN3 shedding decreases optic glioma initiation and growth.

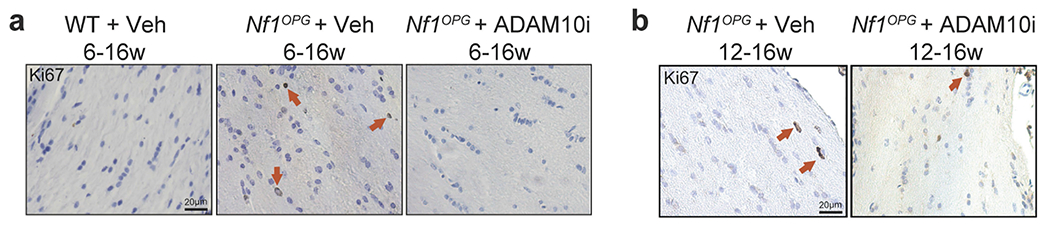
a, intravitreal tetrodotoxin (TTX) injection. b, Immunoblot of NLGN3 shed from the optic nerves of mice treated with TTX (n = 4 mice), relative to Nf1+/− mice treated with vehicle (n = 3 mice) (shed NLGN3 index). c, Immunoblot of shed NLGN3 in conditioned medium from retina and optic nerve preparations of light-stimulated Nf1+/−;Thy1::ChR2 (right) (n = 7) and Nf1+/+;Thy1::ChR2 (left) (n = 6) mice, relative to their unstimulated (dark + TTX) counterparts (shed NLGN3 index). d, Rearing in dark (grey lightbulb + black bar) or regular 12:12 light cycles (half yellow and grey lightbulbs + yellow bar) of Nf1+/− and wild-type mice from 6 to 9 weeks of age. e, Immunoblot of NLGN3 shed from the optic nerves, from Nf1+/+ (left) (n = 9 dark-reared, and 8 regular-light-reared mice) and Nf1+/− (right) (n = 5 dark-reared, and 4 regular-light-reared mice). The shed NLGN3 index indicates levels of shed NLGN3 relative to the dark group and normalized to β-actin. f, Paradigm for the treatment with ADAM10 inhibitor (ADAM10i). Blue bar indicates administration ofADAM10i (GI254023X). Arrow, tumour initiation. g, Optic nerve volume (left) and proliferation (per cent Ki67+ cells) (right) of wild-type + vehicle (n = 3), Nf1OPG + vehicle (n = 7) and Nf1OPG + ADAM10i 6–16-week-old (n = 9) groups. h, Optic nerve volume and proliferation plots. Tumours are gated as in Fig. 1. i, As in f, with ADAM10i administration from 12 to 16 weeks of age. j, Optic nerve volume (left) and proliferation (per cent Ki67+ cells) (right) of Nf1OPG + vehicle (n = 9) and Nf1OPG + ADAM10i 12–16-week-old (n = 8) groups. k, As in h, with ADAM10i administered from 12 to 16 weeks of age. Data are mean ± s.e.m. NS, not significant (P > 0.05). Each data point is one mouse in b, e, g, h, j, k. Each data point is one eye in c. Unpaired t-test with Welch’s correction (b, e,j). Wilcoxon test (c). Brown–Forsythe and Welch ANOVA tests with Dunnett’s T3 correction for multiple comparison (g, volume, F = 9.292, P = 0.0038); g, proliferation, F = 8.564, P = 0.0109). All tests were two-sided. Illustrations created with BioRender.com (a, d).
NLGN3 shedding drives gliomagenesis
The ectodomain of NLGN3 is cleaved and released from the cell surface (Extended Data Fig. 6d) of oligodendrocyte precursor cells and neurons by the ADAM10 protease in an activity-dependent manner, whereas ADAM10 is secreted chiefly by neurons17. Consistent with the ADAM10 regulation of NLGN3 shedding, treatment of Nf1+/− mice with GI254023X (a specific and brain-penetrant17 inhibitor of ADAM10) reduced NLGN3 shedding in the optic nerve (Extended Data Fig. 6e). ADAM10 secretion from light-stimulated retina and optic nerve explants was increased only in Nf1+/−;Thy1::ChR2 and not in Nf1+/+;Thy1::ChR2 mice (Extended Data Fig. 6f), which supports the hypothesis that the Nf1-mutation-induced increase in activity-regulated NLGN3 shedding–probably from oligodendrocyte precursor cells17–in the optic nerve is mediated through increased secretion of ADAM10 from Nf1+/− RGC neurons. How Nf1 mutation dysregulates ADAM10 secretion remains an open question.
Considering the potential for clinical translation, we next tested whether blocking NLGN3 shedding with GI254023X phenocopies the effects of genetic Nlgn3 loss or dark-rearing in Nf1-OPGs. ADAM10 inhibition in Nf1OPG mice treated from 6 to 16 weeks of age decreases tumour formation and/or growth. As such, optic nerve volumes and proliferation in Nf1OPG mice treated with GI254023X were indistinguishable from those found in wild-type mice (Fig. 3f–h, Extended Data Fig. 7a). Moreover, only 3 out of 8 (37.5%) Nf1OPG mice treated with GI254023X from 12 to 16 weeks of age (a period when Nf1-OPGs have already formed) exhibited small tumours (Fig. 3i–k, Extended Data Fig. 7b), underscoring the potential to therapeutically target the maintenance and growth of Nf1-OPGs. Taken together, these results indicate that optic nerve activity-regulated NLGN3 shedding is central to the formation and maintenance of Nf1-OPGs, which may represent a promising therapeutic target.
The findings presented in this Article suggest a model in which cancer predisposition (germline Nf1 mutation) synergizes with neuronal activity to promote tumour initiation by dysregulating the ADAM10–NLGN3 axis. This extends previous observations that have demonstrated that neuronal activity regulates the growth and progression of high-grade glioma9,16,17 by establishing a role for neuronal activity in the formation of low-grade brain tumours that arise in an inherited cancer syndrome. In this respect, NF1 mutation has dual effects on cancer risk in NF1: not only does germline NF1 mutation increase the proliferation of neural progenitor cells (the putative optic glioma cells of origin)24 to expand the pool of cells that are most likely to sustain somatic NF1 loss and give rise to tumours, but it also acts at the level of non-neoplastic cells to dictate glioma penetrance. Although Nf1+/− stromal cells (microglia) have previously been implicated in the growth and progression of Nf1-OPGs in mice25, to our knowledge this is the first demonstration that a heterozygous Nf1 mutation interacts with environmental stimuli (light) to govern tumour formation. Future investigation will be required to determine whether this interaction reflects the effects of Nf1 mutation on RGC excitability, as has previously been suggested for dorsal root ganglion sensory neurons26, or is due to other mechanisms that are related to dysregulating the neuronal activity-dependent ADAM10–NLGN3 signalling axis in RGC neurons or oligodendrocyte precursor cells within the optic nerve17. Relevant to precision medicine, there are numerous germline NF1 mutations in patients with NF1, which are differentially associated with glioma risk27,28 and could differentially influence neuron–glioma interactions. The abrogation of tumour formation after ADAM10 inhibition in Nf1OPG mice suggests the potential for future investigations of the ADAM10–NLGN3 axis as a therapeutic target for the treatment of optic gliomas that arise in children with NF1.
Methods
Mice
All mice were used in accordance with an approved Institutional Animal Care and Use Committee protocol at Stanford University and Washington University. Mice were housed with free access to water and food according to the university’s guidelines in a 12-h light/12-h dark cycles unless otherwise noted. Mice were dark-reared in a dark room (24 h dark with dim red light) with routine care from the animal facility. The housing rooms are kept at a set point of 20–26 °C, with humidity ranging from 30 to 70%. Nf1OPG, Nf1fl/mut (Nf1+/−) and Nf1fl/fl (wild-type) mice were previously generated5,29–31. Thy1::ChR2-YFP (line 20) and Nlgn3KOmice were acquired from the Jackson Laboratory (012350 and 008394, respectively). All mice were maintained on a C57/BL6 background (backcrossed for at least four generations) before analysis. Mice at 9, 16 or 24 weeks of age were analysed. Both male and female mice were used, as there is no difference in Nf1-OPG volume and proliferation between female and male mice13. Because low-grade gliomas of the optic nerve do not grow to a size that causes animal morbidity beyond vision loss, a maximal tumour size end point was not required. Mice were routinely monitored for signs of morbidity such as weight loss and poor grooming. Sample sizes were chosen on the basis of prior power calculations and previously published experiments to achieve 80% power and significance level of 0.05. Mice were randomized to experimental groups. Investigators were blinded to group allocation during data collection and analyses.
Optogenetic stimulation
Nf1OPG;Thy1::ChR2-YFP mice (5 weeks old) were anaesthetized with 1–4% is oflurane and placed in a stereotactic apparatus. A fibre optic ferrule (Doric Lenses) was placed above the right optic nerve (0.5 mm right to midline, 0.5 mm anterior to bregma, 5 mm deep to cranial surface). The mice recovered for 7 days after surgery, followed by optogenetic stimulation from 6 to 12 weeks of age (1 stimulation session per 2 days). The stimulation was conducted as previously descrived9. In brief, the mice were connected to a 100-mW 473-nm DPSS laser system with a mono fibre patch cord. Pulses of light (about 15 mW per mm2 measured at the end of the patch cord) were administered at a frequency of 20 Hz for periods of 15 s, followed by 45-s recovery periods, for a total session duration of 15 min. Mice were killed at 16 weeks of age for histological analyses.
Cell culture
Optic glioma cells were isolated from the optic nerves of three-month-old Nf1OPG mice18,32. Single cells were dissociated from the OPG with a digestion medium containing 0.01% sodium bicarbonate, 15 mM HEPES, 0.5% glucose, 0.2% BSA, 0.004% DNase I and 0.01% trypsin in HBSS. The reaction was quenched using 10% fetal bovine serum, followed by two washes in HBSS. The cell pellets were suspended and grown in low-attachment dishes (Millipore Sigma CLS3262) supplemented with neural stem cell (NSC) medium containing 61% DMEM low glucose medium, 35% neurobasal-A (Invitrogen 10888-022), 2 mM GlutaMAX (Invitrogen 35050-061), 1% penicillin–streptomycin, 1% N2 (Thermo Fisher Scientific 17502001), 2% B27-A (Thermo Fisher Scientific 12587-010), 20 ng ml−1 mouse FGF (PeproTech 450-33), and 20 ng ml−1 mouse EGF (PeproTech 315-09). Cells were authenticated by staining for OPG markers (SOX2, nestin and CD133) and neurosphere-forming assays18,32. Glioma neurospheres were passaged using Accutase (STEMCELL Technologies 07920, 15-min incubation at room temperature) to achieve single-cell suspension. Mycoplasma testing was performed periodically. For the Nlgn3 qRT–PCR experiment, optic glioma cells were incubated with 30 nM NLGN3 in the NSC medium supplemented with 2% B27-A for 24 h.
EdU incorporation assay
Ten thousand optic glioma cells were seeded to fibronectin (10 μg ml−1)-coated 8-chamber slides (Thermo Fisher Scientific, 154534PK), and grown in NSC medium without N2, FGF and EGF for 48 h, supplemented with vehicle (25 mM Tris-HCl, pH 7.3, 100 mM glycine and 10% glycerol), NLGN3 (70 nM unless otherwise noted, OriGene TP307955), or BDNF (70 nM, PeproTech 450-02). EdU proliferation assay was performed using the Click-iT EdU Alexa Fluor 594 imaging kit (Thermo Fisher Scientific C10339) according to the manufacturer’s instructions. EdU was added 8 h before fixing the cells in 4% paraformaldehyde. Images were taken using a Zeiss Axio Imager M2 and the Stereo Investigator software (mbfbioscience v2019). Cell proliferation was determined by dividing the number of EdU+ cells by the number of DAPI+ cells using Cell Profiler (v.3.1.9). All experiments were repeated three times with similar results.
Immunohistochemistry and immunofluorescence
Mice were anaesthetized and transcardially perfused with 30 ml cold PBS. Optic nerves were fixed in 10% formalin (Thermo Fisher Scientific SF100-4) overnight at 4 °C, then transferred to 70% ethanol for paraffin embedding. Paraffin blocks were sectioned at 10 μm. Optic nerve paraffin sections were deparaffinized, and underwent antigen retrieval in boiling citric antigen retrieval buffer (Sigma-Aldrich C9999) for 15 min. For DAB staining, tissue sections were processed using the VECTASTAIN Elite ABC Universal PLUS Kit (Vector Laboratories PK-8200) according to the manufacturer’s instructions using mouse anti-Ki67 (1:2,000, BD Biosciences 556003 lot 8239549), rabbit anti-CD8 (1:500, Cell Signaling Technology 98941T lot 5), or goat anti-PDGFRα (1:2,000, R&D Systems AF1062 RRID: AB_2236897) as the primary antibody. For immunofluorescence staining, tissue sections were permeabilized and incubated in blocking solution (3% normal donkey serum, 0.3% Triton X-100 in TBS) at room temperature for 1 h, incubated with primary antibodies, rabbit anti-S100β (1:2,000, Abcam ab52642 lot GR3215095-1), rabbit anti-IBA1 (1:1,000, Abcam ab178846 lot GR3185035-4), or mouse anti-BRN3A (1:200, Santa Cruz Biotechnology sc-8429 lot H1718), at 4 °C overnight, washed in TBS, incubated with secondary antibodies (donkey anti-rabbit Alexa Fluor 594, 1:500, Jackson ImmunoResearch 711-585-152) and DAPI, washed in TBS and then mounted with prolong gold (Invitrogen P36930). Images were taken using a Zeiss Axio Imager M2 and quantified using ImageJ (v.2.0.0).
Optic nerve volume measurements
Optic nerves were photographed and diameters were measured at 0, 150, 300 and 450 μm (anterior to the chiasm) to generate optic nerve volumes, as previously described33.
Conditioned medium experiments
Mice at six weeks of age were briefly exposed to CO2 and immediately decapitated. Eyeballs with the optic nerves attached were isolated, and microdissected to expose the retina. The resulting retina and optic nerve tissues were then placed in artificial cerebrospinal fluid (aCSF) and allowed to recover for at least 30 min. After recovery, tissues were transferred into fresh aCSF in a 96-well plate (one retina and optic nerve preparation per well). For the stimulated group, retina and optic nerve preparations were stimulated using a blue-light LED from a microscope objective at 20-Hz pulses for a 30-s-on, 90-s-off phase for 30 min, and then left in ambient light for 1.5 h. For the unstimulated group, tissues were incubated with 1 nM TTX (Abcam ab120055) and kept in the dark for 2 h. Conditioned medium was collected, supplemented with 1× phosphatase inhibitor (Thermo Fisher Scientific 78428) and 1× protease inhibitor (Thermo Fisher Scientific 87786), and stored at −80 °C for western blotting.
Western blotting
Optic nerves were lysed in RIPA buffer (Santa Cruz Biotechnology sc-24948) supplemented with 1× phosphatase inhibitor (Thermo Fisher Scientific 78428) and 1× protease inhibitor (Thermo Fisher Scientific 87786). Protein concentrations were determined using the Pierce BCA protein assay kit (Thermo Fisher Scientific 23225). Twenty μg of optic nerve lysate or 5 μg of conditioned medium was used for SDS–PAGE. PVDF membranes were subsequently blocked in 5% BSA and Tris buffered saline with 1% Triton X-100 (TBST), followed by primary antibody (rabbit anti-NLGN3, 1:500, Novus NBP1-90080 lot B118108; rabbit anti-β-actin, 1:10,000, Cell Signaling 4970 lot 15; rabbit anti-ADAM10, 1:250, Abcam ab124695 lot GR3244660-5; rabbit anti-cleaved caspase-3, 1:500, R&D Systems MAB835 lot KHK051810A; and rabbit anti-caspase-3, 1:1,000, Cell Signaling 9662 lot 19) incubation overnight at 4 °C and secondary antibody (1:10,000 anti-rabbit IgG-HRP, Cell Signaling 7074) incubation for 1 h at room temperature. Blots were developed using the SuperSignal West Femto Chemiluminescent Substrate (Thermo Fisher Scientific 34095), imaged on a Bio-Rad Gel Doc imager using Image Lab software (v.6) and analysed using Image Studio Lite (v.5.0.21). The intense overexposed full-length NLGN3 band was cropped out to allow for easy identification of shed NLGN3.
Pharmacological studies
For ADAM10 inhibition, mice were injected with 100 mg kg−1 GI254023X (Sigma-Aldrich SML0798), or the same volume of vehicle (10% DMSO in 01.M carbonate buffer), intraperitoneally, 5 days per week. Nf1+/− mice were dosed from 6 to 7 weeks of age. Nf1OPG mice were dosed from 6 to 16, or 12 to 16, weeks of age.
For BDNF and TrkB inhibition, Nf1OPC mice were gavaged with 120 mg kg−1 entrectinib (MedChem Express HY-12678), or the same volume of vehicle (7% DMSO and 10% Tween 80), from 6 to 16 weeks of age (1 dose every 2 days to minimize toxicity).
For TTX injection, 3 pl of 1 mM TTX (Tocris 1069) or the same volume of vehicle (PBS) was injected into the vitreal chamber of the eyes of 6-week-old Nf1+/− mice, once per day for 2 days, followed by euthanizing the mice on day 3.
Human pilocytic astrocytoma samples
The pilocytic astrocytoma and non-neoplastic brain tissue samples were obtained from the paediatric tumour banks at St. Louis Children’s Hospital, University of California Los Angeles and Stanford University in accordance with protocols approved by their respective Institutional Review Boards and with informed consent. Information about the samples is included in Extended Data Tables 1, 2.
Pattern electroretinography recording
Nf1OPG mice were either raised in 12-h light/12-h dark cycles, or reared in complete darkness from 6 to 12 weeks of age. All mice were dark-adapted overnight before pattern electroretinography (PERG) were performed. PERGs were recorded and analysed at 12 weeks of age using the Celeris ERG stimulator (Diagnosys) as per the manufacturer’s instructions. In brief, mice were anaesthetized with avertin (0.3 mg g−1), with eyes dilated before placing a PERG electrode on the corneal surface. A visual stimulus generated by black and white alternating contrast-reversing bars was aligned with the projection of the pupil. PERGs were measured between the first positive peak (P1) and second negative peak (N2), and adjacent trough of the waveform. Three mice per group and 600 reads per eye were recorded.
Mass spectrometry
Proteins within the conditioned medium preparations were separated by two-dimensional gel electrophoresis, followed by selecting potential spots for BDNF and NLGN3 for MALDI–TOF MS and TOF/TOF tandem MS using previously described methods9.
RNA isolation and qRT–PCR
RNA was isolated using the Qiagen RNeasy Mini Kit per manufacturer’s instructions. qRT–PCR was performed using the SYBR-Green PCR master mix (Thermo Fisher Scientific 4309155) using the following primers, as previously described9: NLCN3 forward: GGGAGTCCCCTTTCTGAAGC; NLCN3 reverse: CCTTCATGGCCACACTGACT; ACTB forward: TGAAGTGTGACGTGGACATC; ACTB reverse: GGAGGAGCAATGATCTTGAT. Relative expression was quantified using the ΔCt method.
RNA-seq and transcriptomic analysis
For RNA-seq library construction, the NEBNext Ultra II RNA Library Prep Kit for Illumina was used and mRNA enriched using oligo(dT) beads. Constructed cDNA libraries that passed a library quality-control test (comprising Qubit, LabChip fragment analysis and qPCR steps) were sequenced on an Illumina NovaSeq 6000 PE150 platform. The analysis for this Article was generated using Partek Flow software, v.9.0. RNA-seq reads were aligned to the Ensembl release 100 top-level assembly with STAR v.2.7.3a34. Gene counts and isoform expression were derived from Ensembl output. Sequencing performance was assessed for the total number of aligned reads, total number of uniquely aligned reads and features detected. Normalization size factors were calculated for all gene counts by median ratio. Differentially expressed gene analysis was then performed using DESeq235 method to analyse differences between conditions and the results were filtered for only those genes with P values ≤ 0.01 and log-transformed fold changes more extreme or equal to ± 2.
Gene set enrichment analysis
Gene set enrichment analysis36,37 was used to assess differentially expressed Gene Ontologies (GOs) enriched in high-NLGN3-expressing tumours compared to low-NLGN3-expressing tumours. GO classification and enrichment analysis were performed for biological process, cellular component and molecular function ontologies.
Statistics and reproducibility
Data analyses were performed using Prism GraphPad (v.8.4.1). The normality of each group was determined by Shapiro–Wilk test. Comparisons between two normally distributed groups were analysed using unpaired t-tests with Welch’s correction. Multiple comparisons among normally distributed groups were analysed using Brown–Forsythe and Welch ANOVA tests with Dunnett’s T3 correction for multiple comparison. Kruskal–Wallis test with Dunn’s correction for multiple comparison was used for comparisons involving data that do not pass the Shapiro–Wilk test. Statistical tests used were indicated in the figure legends with F (Brown–Forsythe ANOVA tests) and P values. All tests are two-sided, statistical significance was set at P ≤ 0.05. All data are presented as mean values with s.e.m. All in vitro experiments have been performed in at least three independent wells for each experiment, and performed at least two independent experiments. The number of biological replicates (mice for in vivo experiments and retina + optic nerve preparations for ex vivo experiments) is indicated in the figure legends, and was always three or greater. For each in vivo result, the experiment was performed independently in at least three litters of mice.
Reporting summary
Further information on research design is available in the Nature Research Reporting Summary linked to this paper.
Extended Data
Extended Data Fig. 1 |. Increased activity of the optic nerve drives growth of Nf1-OPG.

a, Representative fluorescence microscopy images reveal YFP expression within the optic nerve and retina freshly isolated from Thy1::ChR2-YFP, but not wild-type, mice. n = 3 mice from each group were examined with similar results. Scale bar, 30 μm. b, Immunohistochemistry using green fluorescent protein (GFP)- and yellow fluorescent protein (YFP)-specific antibodies reveals YFP expression (green) specifically in the retinal ganglion cells (BRN3A+) (red) of Thy1::ChR2-YFP, but not wild-type, mice. n = 3 mice from each group were examined with similar results. Scale bar, 15 μm. Arrow, cells shown in the inset. GCL, ganglion cell layer, IPL, inner plexiform layer, INL, inner nuclear layer, OPL, outer plexiform layer, ONL, outer nuclear layer. c, Representative Ki67 immunohistochemistry images (arrows indicate Ki67+ cells) and quantification of unstimulated (unstim) (n = 6) and stimulated (stim) (n = 6) Nf1OPG;Thy1::ChR2-YFP mice. Scale bar, 20 μm. Unpaired t-test with Welch’s correction. d, Plotting optic nerve volume against proliferation shows separation between unstimulated and stimulated groups. e, Immunofluorescence images of S100β (red), IBA1 (green) and DAPI (blue) reveal increased per cent of S100β+(P = 0.005), but not IBA1+ (P = 0.6739), cells in the stimulated group (n = 6 mice), relative to the unstimulated group (n = 5 mice). Unpaired t-test with Welch’s correction. f, PERG performed on Nf1OPG mice raised in regular light cycles (12:12) (n = 6 eyes) or reared in dark (n = 6 eyes) from 6–12 weeks of age. Mann–Whitney test. g, Dark-rearing experimental paradigm. n = 5 (wild type 12:12), 7 (Nf1OPG 12:12), 6 (Nf1OPG dark 6–16 weeks old) and 12 (Nf1OPG dark 6–12 weeks old). Data are mean ± s.e.m. NS, not significant (P > 0.05). Each data point is one mouse in c–e. All tests were two-sided. Illustrations created with BioRender.com (f, g).
Extended Data Fig. 2 |. Retinal activity during a susceptible period is required for initiation of Nf1-OPG.

a, Representative Ki67 immunohistochemistry (arrows, Ki67+ cells), S100β immunofluorescence (green) and haematoxylin and eosin (H&E) (arrows indicate abnormal nuclei) images. Scale bar, 20 μm. b, Quantification of the per cent of S100β+ cells in Nf1OPG mice reared in regular light cycles (12:12) or dark-reared (24-h darkness) from 6 to 16 or 6 to 12 weeks of age. n = 4 (wild type 12:12), 5 (Nf1OPG 12:12), 5 (Nf1OPG dark 6–16 weeks old) and 5 (Nf1OPG dark 6–12 weeks old) mice. c, Representative immunohistochemistry images (white, BRN3A; blue, DAPI) in the ganglion cell layer, and quantification of per cent BRN3A+ cells in wild-type mice reared in regular light cycles (12:12, n = 5 mice), or dark (24-h darkness, n = 6 mice). P = 0.9307. Scale bar, 10 μm. d, Dark-rearing experimental paradigm with observation until 24 weeks after return to regular light cycles at 12 weeks. Half-yellow and half-grey lightbulbs and yellow bars indicate 12-h light/12-h dark cycles (12:12). Grey lightbulbs and black bars indicate dark-rearing periods (24-h darkness). Arrow, tumour initiation. e, Optic nerve volume (left) and proliferation (per cent Ki67+ cells) (right) of Nf1OPG mice reared in regular light cycles (12:12) or dark-reared (24-h darkness) from 6 to 12 weeks of age and observed until 24 weeks. n = 7 (wild type 12:12), 6 (Nf1OPG 12:12) and 6 (Nf1OPG dark 6–12 weeks old) mice. f, Plotting optic nerve volume against proliferation shows no OPG (tumour) in the dark-reared Nf1OPG mice. Tumour is gated against the maximum volumes and proliferation of 24-week-old wild-type mice. g, IBA1 (green) immunofluorescence images and quantification. Scale bars, 20 μm. n = 4 mice in each group. h, i, Quantification of CD8+ (n = 6 and 4 mice in 12:12 and dark groups, respectively) and PDGFRα+ cell density (n = 5 and 6 mice in 12:12 and dark groups, respectively). Data are mean ± s.e.m. Mann–Whitney test (c). Brown–Forsythe and Welch ANOVA tests with Dunnett’s T3 correction for multiple comparison (b, F = 11.18, P = 0.0071; e, volume, F = 11.19, P = 0.0011). Kruskal-Wallis test with Dunn’s correction for multiple comparisons (e, proliferation, P = 0.0008). Unpaired t-test with Welch’s correction (g–i). NS, not significant (P > 0.05). Each data point is one mouse in b, e–i. Each data point is one eye in c. All tests were two-sided. Illustrations created with BioRender.com (d).
Extended Data Fig. 3 |. The intrinsic circadian clock associated with constant darkness does not contribute to Nf1-OPG initiation.

a, Entrained dark-rearing paradigm. Half-yellow and half-grey lightbulbs and yellow bars indicate 12-h light/12-h dark cycles (12:12). Grey lightbulbs and dashed black bars indicate entrained dark-rearing periods (24-h darkness with 15 min of light at 07.00 and 19.00). Arrow, tumour initiation. b, Optic nerve volume (left) and proliferation (per cent Ki67+ cells) (right) of Nf1+/− mice (no tumour control, n = 3) and Nf1OPG mice reared in regular light cycles (12:12, n = 5), or dark-reared (entrained) from 6 to 16 weeks of age (n = 7). Kruskal–Wallis test (volume, P = 0.0014; proliferation, P = 0.0005). c, Plotting optic nerve volume against proliferation shows few OPGs (tumours) in entrained dark-reared Nf1OPG mice. Tumour is gated against volume and proliferation of 16-week-old wild-type mice (22 mice raised in regular light cycles; grey regions mark the range of values). d, Representative Ki67 immunohistochemistry images of Nf1+/− mice (no tumour control, n = 3) and Nf1OPG mice reared in regular light cycles (12:12, n = 5), or dark-reared (entrained) from 6 to 16 weeks of age (n = 7). Arrows, Ki67+ cells. Scale bar, 20 μm. NS, not significant (P > 0.05). Each data point is one mouse in b, c. All tests were two-sided. Illustrations created with BioRender.com (a).
Extended Data Fig. 4 |. Targeting BDNF or TrkB signalling does not prevent formation of Nf1-OPGs.

a, Left, generation of retina + optic nerve explants for collecting secreted proteins in the conditioned medium. Right, retina + optic nerve explant preparations from Nf1+/−;Thy1::ChR2-YFP mice were stimulated by blue light (stim) or unstimulated (unstim) (complete darkness + 1 nM TTX), followed by conditioned medium collection and mass spectrometry measurement of BDNF and NLGN3. Fold changes of BDNF and NLGN3 in the conditioned medium between stimulated and unstimulated conditions are indicated. b, Representative EdU immunofluorescence images of Fig. 2a, showing increased Nf1 optic glioma cell proliferation (EdU incorporation) to increasing concentrations of NLGN3. Scale bar, 25 μm. n = 4 (vehicle (veh)), 3 (10 nM), 3 (30 nM) and 3 (70 nM) wells. c, Increased Nf1 optic glioma cell proliferation (EdU incorporation) to 70 nM NLGN1 (n = 3 wells), NLGN2 (n = 4 wells), NLGN3 (n = 7 wells) and BDNF (n = 3 wells), relative to vehicle (n = 8 wells for NLGN1, NLGN2 and NLGN3 and 3 wells for BDNF). d, Entrectinib (ent) treatment paradigm. Blue bar, time intervals when entrectinib was administered. Arrow, tumour initiation. e, Optic nerve volume (left) (P = 0.8690) and proliferation (per cent Ki67+ cells) (right) (P = 0.4536) of Nf1OPG + vehicle (n = 3), and Nf1OPG + entrectinib (n = 6) groups. f, Plotting optic nerve volume against proliferation shows OPG (tumour) in all Nf1OPG + entrectinib mice. Tumour is gated against volume and proliferation of 16-week-old wild-type mice (22 mice raised in regular light cycles; grey regions mark the range of values). Unpaired t-test with Welch’s correction (c, BDNF; e, proliferation). Brown-Forsythe and Welch ANOVA tests with Dunnett’s T3 correction for multiple comparison (c, NLGN1, NLGN2 and NLGN3, F=44.85, P < 0.0001). Mann–Whitney test (e, volume). Data are mean ± s.e.m. NS, not significant (P > 0.05). Each data point is one well in c. Each data point is one mouse in e, f. All tests were two-sided. Illustrations created with BioRender.com (a).
Extended Data Fig. 5 |. NLGN3 expression analyses in human pilocytic astrocytomas.

a, qRT–PCR using Washington University School of Medicine (WUSM) samples reveals increased NLGN3 levels in NF1-associated pilocytic astrocytoma (NF1-PA) (n = 9); NLGN3 levels were not significantly increased in sporadic pilocytic astrocytoma (S-PA) in this dataset (n = 14), relative to non-neoplastic brain controls (NB) (n = 9); the same non-neoplastic brain cases are shown in each comparison). These results should be considered in the context of the larger dataset presented in b and the cases presented in Fig. 2e. b, NLGN3 expression of a previously published microarray dataset (GSE44971)21 reveals increased NLGN3 levels in pilocytic astrocytoma (n = 49), relative to non-neoplastic brain controls (n = 9). Red dots, NF1-associated pilocytic astrocytomas. c, No association between NLGN3 expression and sex, location or age was observed in the pilocytic astrocytoma RNA-seq dataset. From left to right, n = 6, 3, 6, 4, 4, 5, 6, 4, 4, 5, 6 and 4 samples. d, NLGN3 expression of the previously published microarray dataset21 reveals increased NLGN3 levels in all methylation groups, pilocytic astrocytomas located in cerebellum and diencephalon, relative to non-neoplastic brains. From left to right, n = 9, 12, 28, 9, 9, 35, 5, 6 and 3 samples. e, GO terms and differentially expressed genes in NLGN3-high and NLGN3-low groups from the pilocytic astrocytoma RNA-seq database. f, Gene set enrichment analysis reveals neuronal and immune signatures in NLGN3-high and NLGN3-low pilocytic astrocytomas, respectively. Mann–Whitney test (a, NB versus NF1-PA). Unpaired t-test with Welch’s correction (a, NB versus S-PA; b). Brown–Forsythe and Welch ANOVA tests with Dunnett’s T3 correction for multiple comparison (c, all comparisons are not statistically significant; d, methylation, F = 11.71, P = 0.0001; d, location, F = 23.48, P < 0.0001). Data are mean ± s.e.m. Each data point is one human sample in a–d. All tests were two-sided.
Extended Data Fig. 6 |. Optogenetic stimulation of retina + optic nerve explants.

a, Immunoblotting of retina + optic nerve tissues reveals no change in cleaved caspase-3 (CC3) levels (normalized to the amount of total caspase-3 (Cas-3)) between the unstimulated (unstim) and stimulated (stim) groups. n = 3 mice. P = 0.8938. b, Immunoblotting reveals the same levels of shed NLGN3 (s-NLGN3) in the conditioned medium of unstimulated Nf1+/+;Thy1::ChR2 (n = 6 mice) and Nf1+/−;Thy1::ChR2 (n = 6 mice) retina + optic nerve explants. c, Immunoblotting of optic nerve lysate reveals same levels of shed NLGN3 in dark-reared wild-type (n = 3) and Nf1+/− (n = 5) mice. d, ADAM10-mediated NLGN3 shedding. e, Immunoblotting reveals reduced shed NLGN3 levels in optic nerves of Nf1+/− mice after treatment with the ADAM10 inhibitor (ADAM10i) (GI254023X) (n = 4 mice), relative to vehicle (n = 3 mice) treatment. f, Immunoblotting of conditioned medium reveals increased ADAM10 in light-stimulated Nf1+/−;Thy1::ChR2 (left) (n = 7 mice), but not Nf1+/+;Thy1::ChR2 (right) (n = 3 mice), retina + optic nerve explants relative to their unstimulated (dark + TTX) counterparts. ns, not significant. Data are mean ± s.e.m. Wilcoxon test (a, f). Unpaired t-test with Welch’s correction (b, c, e). Each data point is one mouse in a–c, e, f. All tests were two-sided. Illustrations created with BioRender.com (d).
Extended Data Fig. 7 |. Targeting NLGN3 shedding prevents Nf1-OPG proliferation.
a, Representative Ki67 immunohistochemistry images of wild-type + vehicle (n = 3), Nf1OPG + vehicle 6–16 weeks old (n = 7) and Nf1OPG + ADAM10i 6–16 weeks old (n = 9) groups. b, Representative Ki67 immunohistochemistry images of Nf1OPG + vehicle (n = 9) and Nf1OPG + ADAM10i 12–16 weeks old (n = 8) groups. Arrows, Ki67+ cells. Scale bar, 20 μm.
Extended Data Table 1.
Human pilocytic astrocytoma samples used in the RNA-seq study
| Age | Gender | Location | |
|---|---|---|---|
| Non-neoplastic brain (NB) | |||
| NOP454N | 15 | F | N/A |
| DIPG46N | 11 | F | Frontal cortex |
| DIPG51N | 3 | F | Frontal cortex |
| DIPG48N | 14 | M | Frontal cortex |
| DIPG70N | 14 | F | Frontal cortex |
| NFI-PAs | |||
| NOP002 | 12 | F | Temporal lobe/optic radiation |
| NOP026 | 7 | F | Cerebellum |
| NOP286 | 15 | F | Basal ganglia |
| NOP454 | 15 | F | 3rd ventricle |
| NOP482 | 4 | F | Temporal lobe/optic radiation |
| NOP489 | 15.5 | F | Posterior fossa |
| NOP006 | 3 | M | Posterior fossa |
| NOP009 | 6 | M | Temporal lobe/optic radiation |
| NOP435 | 17 | M | Posterior fossa |
| S-PAs | |||
| NOP015 | 4 | F | Frontal lobe |
| NOP023 | 11 | F | Posterior fossa |
| NOP227 | 12 | F | Posterior fossa |
| NOP445 | 3 | M | Temporal lobe/optic radiation |
| NOP664 | 15 | F | Thalamic mass |
| NOP667 | 4 | F | Midbrain |
| LB3082 | 2 | M | Posterior fossa |
| LB4271 | 13 | F | Brainstem |
| LB3419 | 3 | M | Cerebellum |
| LB2978 | 7 | M | Inferior frontal lobe |
Neurofibromatosis-1 syndrome-associated pilocytic astrocytoma samples (NF1-PA); sporadic (occurring in patients without NF1) pilocytic astrocytoma samples (S-PA); non-neoplastic brain samples (NB). Age is reported in years. F, female; M, male.
Extended Data Table 2.
Human pilocytic astrocytoma samples used in qRT–PCR study
| Age | Gender | Location | |
|---|---|---|---|
| Non-neoplastic brain (NB) | |||
| NOP411N | 7 | F | Cerebellum |
| NOP452N | 15 | M | Temporal lobe |
| NOP478N | 15 | M | Frontal lobe |
| NOP463N | 4 | F | Posterior fossa |
| SU-pTG-2N | 5 | F | Frontal cortex |
| SU-pTG-3N | 3 | M | Frontal cortex |
| SU-pTG-4N | 15 | F | Frontal cortex |
| SU-DIPG-58N | 4 | F | Frontal cortex |
| SU-DIPG-61N | 4 | M | Frontal cortex |
| NF1-PAS | |||
| NOP 009 | 6 | M | Temporal lobe/optic radiation |
| NOP 286 | 15 | F | Basal ganglia |
| NOP 435 | 17 | M | Posterior fossa |
| NOP 454 | 15 | F | 3rd ventricle |
| NOP 463 | 4 | F | Posterior fossa |
| NOP 482 | 4 | F | Temporal lobe/optic radiation |
| NOP 002 | 12 | F | Temporal lobe/optic radiation |
| NOP 006 | 3 | M | Posterior fossa |
| NOP 093 S-PAs | 15 | F | Posterior fossa |
| NOP 015 | 4 | F | Frontal lobe |
| NOP 019 | 17 | M | Intraventricular mass |
| NOP 023 | 11 | F | Posterior fossa |
| NOP 128 | 15 | M | Posterior fossa |
| NOP 227 | 12 | F | Posterior fossa |
| NOP 244 | 10 | F | Posterior fossa |
| NOP 445 | 3 | M | Temporal lobe/optic radiation |
| NOP 667 | 4 | F | Midbrain |
| NOP 730 | 15 | F | Posterior fossa |
| 19013 | 3 | F | Brainstem |
| 18085 | 4 | F | Cerebellar |
| 18137 | 8 | M | Cerebellum |
| 19047 | 12 | M | Frontal lobe |
| 19008 | 15 | M | Cerebellum |
Neurofibromatosis-1 syndrome-associated pilocytic astrocytoma samples (NF1-PA); sporadic (occurring in patients without NF1) pilocytic astrocytoma samples (S-PA); non-neoplastic brain samples (NB). Age is reported in years. F, female; M, male.
Supplementary Material
Acknowledgements
This work was supported by grants from the Department of Defense (W81XWH-15-1-0131 to M.M. and D.H.G., and W81XWH-19-1-0260 to Y.P.), National Institute of Neurological Disorders and Stroke (R01NS092597 to M.M. and R35NS07211 to D.H.G.), NIH Director’s Pioneer Award (DP1NS111132 to M.M.), National Cancer Institute (P50CA165962), National Eye Institute (P30EY026877 to J.L.G. and F32EY029137 to K.-C.C.), Brantley’s Project supported by Ian’s Friends Foundation (to Y.P. and M.M.), Gilbert Family Foundation (to D.H.G. and J.L.G.), Robert J. Kleberg, Jr. and Helen C. Kleberg Foundation (to M.M.), Cancer Research UK (to M.M.), Unravel Pediatric Cancer (to M.M.), McKenna Claire Foundation (to M.M.), Kyle O’Connell Foundation (to M.M.), Virginia and D. K. Ludwig Fund for Cancer Research (to M.M.), Waxman Family Research Fund (to M.M.), Stanford Maternal and Child Health Research Institute (to E.M.G.), Stanford Bio-X Institute (to J.D.H.), Will Irwin Research Fund (to M.M.), Research to Prevent Blindness, Inc. (to J.L.G.) and Alex’s Lemonade Stand Foundation (to Y.P.) The authors thank G. Grant and A. Bet for low-grade glioma samples from the Stanford Center for Childhood Brain Tumors Tissue Bank; C. Gardner from The St. Louis Children’s Hospital Pediatric Tumor Bank (supported by the St. Louis Children’s Hospital Foundation and Children’s Surgical Sciences Institute); and Stanford Animal Histology Services for optic nerve paraffin-block sectioning.
Footnotes
Online content
Any methods, additional references, Nature Research reporting summaries, source data, extended data, supplementary information, acknowledgements, peer review information; details of author contributions and competing interests; and statements of data and code availability are available at https://doi.org/10.1038/s41586-021-03580-6.
Competing interests M.M. is an SAB member for Cygnal Therapeutics. M.M. is listed as an inventor on a patent (US10377818B2) coordinated through Stanford University related to targeting neuron–glioma interactions for therapy.
Supplementary information The online version contains supplementary material available at https://doi.org/10.1038/s41586-021-03580-6.
Peer review information Nature thanks Botond Roska, Rosalind Segal and Frank Winkler for their contribution to the peer review of this work. Peer reviewer reports are available.
Data availability statement
Original western blots are included in the Supplementary Information (supplementary Fig. 1). Human pilocytic astrocytoma RNA-seq data are deposited with the Gene Expression Omnibus under accession number GSE163071. The cell lines and other reagents described here are freely available and can be obtained by contacting the corresponding authors and with a standard materials transfer agreement. Any other relevant data are available from the corresponding authors upon reasonable request. Source data are provided with this paper.
References
- 1.Monje M et al. Roadmap for the emerging field of cancer neuroscience. Cell 181, 219–222 (2020). [DOI] [PMC free article] [PubMed] [Google Scholar]
- 2.Zahalka AH & Frenette PS Nerves in cancer. Nat. Rev. Cancer 20, 143–157 (2020). [DOI] [PMC free article] [PubMed] [Google Scholar]
- 3.Listernick R, Louis DN, Packer RJ & Gutmann DH Optic pathway gliomas in children with neurofibromatosis 1: consensus statement from the NF1 Optic Pathway Glioma Task Force. Ann. Neurol 41, 143–149 (1997). [DOI] [PubMed] [Google Scholar]
- 4.Listernick R, Charrow J, Greenwald M & Mets M Natural history of optic pathway tumors in children with neurofibromatosis type 1: a longitudinal study. J. Pediatr 125, 63–66 (1994). [DOI] [PubMed] [Google Scholar]
- 5.Bajenaru ML et al. Optic nerve glioma in mice requires astrocyte Nf1 gene inactivation and Nf1 brain heterozygosity. Cancer Res. 63, 8573–8577 (2003). [PubMed] [Google Scholar]
- 6.Gutmann DH et al. Somatic neurofibromatosis type 1 (NF1) inactivation characterizes NF1-associated pilocytic astrocytoma. Genome Res. 23, 431–439 (2013). [DOI] [PMC free article] [PubMed] [Google Scholar]
- 7.Zhu Y et al. Inactivation of NF1 in CNS causes increased glial progenitor proliferation and optic glioma formation. Development 132, 5577–5588 (2005). [DOI] [PMC free article] [PubMed] [Google Scholar]
- 8.Toonen JA, Ma Y & Gutmann DH Defining the temporal course of murine neurofibromatosis-1 optic gliomagenesis reveals a therapeutic window to attenuate retinal dysfunction. Neuro-Oncol. 19, 808–819 (2017). [DOI] [PMC free article] [PubMed] [Google Scholar]
- 9.Venkatesh HS et al. Neuronal activity promotes glioma growth through neuroligin-3 secretion. Cell 161, 803–816 (2015). [DOI] [PMC free article] [PubMed] [Google Scholar]
- 10.Arenkiel BR et al. In vivo light-induced activation of neural circuitry in transgenic mice expressing channelrhodopsin-2. Neuron 54, 205–218 (2007). [DOI] [PMC free article] [PubMed] [Google Scholar]
- 11.Johnson J et al. Melanopsin-dependent light avoidance in neonatal mice. Proc. Natl Acad. Sci. USA 107, 17374–17378 (2010). [DOI] [PMC free article] [PubMed] [Google Scholar]
- 12.Tian N & Copenhagen DR Visual deprivation alters development of synaptic function in inner retina after eye opening. Neuron 32, 439–449 (2001). [DOI] [PubMed] [Google Scholar]
- 13.Toonen JA, Solga AC, Ma Y & Gutmann DH Estrogen activation of microglia underlies the sexually dimorphic differences in Nf1 optic glioma-induced retinal pathology. J. Exp. Med 214, 17–25 (2017). [DOI] [PMC free article] [PubMed] [Google Scholar]
- 14.Eckel-Mahan K & Sassone-Corsi P Phenotyping circadian rhythms in mice. Curr. Protoc. Mouse Biol 5, 271–281 (2015). [DOI] [PMC free article] [PubMed] [Google Scholar]
- 15.Kennaway DJ Resetting the suprachiasmatic nucleus clock. Front. Biosci 9, 56–62 (2004). [DOI] [PubMed] [Google Scholar]
- 16.Venkatesh HS et al. Electrical and synaptic integration of glioma into neural circuits. Nature 573, 539–545 (2019). [DOI] [PMC free article] [PubMed] [Google Scholar]
- 17.Venkatesh HS et al. Targeting neuronal activity-regulated neuroligin-3 dependency in high-grade glioma. Nature 549, 533–537 (2017). [DOI] [PMC free article] [PubMed] [Google Scholar]
- 18.Chen YH et al. Mouse low-grade gliomas contain cancer stem cells with unique molecular and functional properties. Cell Rep. 10, 1899–1912 (2015). [DOI] [PMC free article] [PubMed] [Google Scholar]
- 19.Iyer R et al. Entrectinib is a potent inhibitor of Trk-driven neuroblastomas in a xenograft mouse model. Cancer Lett. 372, 179–186 (2016). [DOI] [PMC free article] [PubMed] [Google Scholar]
- 20.Pan Y et al. Whole tumor RNA-sequencing and deconvolution reveal a clinically-prognostic PTEN/PI3K-regulated glioma transcriptional signature. Oncotarget 8, 52474–52487 (2017). [DOI] [PMC free article] [PubMed] [Google Scholar]
- 21.Lambert SR et al. Differential expression and methylation of brain developmental genes define location-specific subsets of pilocytic astrocytoma. Acta Neuropathol. 126, 291–301 (2013). [DOI] [PubMed] [Google Scholar]
- 22.Venkataramani V et al. Glutamatergic synaptic input to glioma cells drives brain tumour progression. Nature 573, 532–538 (2019). [DOI] [PubMed] [Google Scholar]
- 23.Narahashi T, Moore JW & Scott WR Tetrodotoxin blockage of sodium conductance increase in lobster giant axons. J. Gen. Physiol 47, 965–974 (1964). [DOI] [PMC free article] [PubMed] [Google Scholar]
- 24.Lee DY, Gianino SM & Gutmann DH Innate neural stem cell heterogeneity determines the patterning of glioma formation in children. Cancer Cell 22, 131–138 (2012). [DOI] [PMC free article] [PubMed] [Google Scholar]
- 25.Daginakatte GC & Gutmann DH Neurofibromatosis-1 (Nf1) heterozygous brain microglia elaborate paracrine factors that promote Nf1-deficient astrocyte and glioma growth. Hum. Mol. Genet 16, 1098–1112 (2007). [DOI] [PubMed] [Google Scholar]
- 26.Wang Y, Nicol GD, Clapp DW & Hingtgen CM Sensory neurons from Nf1 haploinsufficient mice exhibit increased excitability. J. Neurophysiol 94, 3670–3676 (2005). [DOI] [PubMed] [Google Scholar]
- 27.Guo X, Pan Y & Gutmann DH Genetic and genomic alterations differentially dictate low-grade glioma growth through cancer stem cell-specific chemokine recruitment of T cells and microglia. Neuro-oncol. 21, 1250–1262 (2019). [DOI] [PMC free article] [PubMed] [Google Scholar]
- 28.Sharif S et al. A molecular analysis of individuals with neurofibromatosis type 1 (NF1) and optic pathway gliomas (OPGs), and an assessment of genotype-phenotype correlations. J. Med. Genet 48, 256–260 (2011). [DOI] [PubMed] [Google Scholar]
- 29.Brannan CI et al. Targeted disruption of the neurofibromatosis type-1 gene Leads to developmental abnormalities in heart and various neural crest-derived tissues. Genes Dev. 8, 1019–1029 (1994). [DOI] [PubMed] [Google Scholar]
- 30.Zhu Y et al. Ablation of NF1 function in neurons induces abnormal development of cerebral cortex and reactive gliosis in the brain. Genes Dev. 15, 859–876 (2001). [DOI] [PMC free article] [PubMed] [Google Scholar]
- 31.Bajenaru ML et al. Astrocyte-specific inactivation of the neurofibromatosis 1 gene (NF1) is insufficient for astrocytoma formation. Mol. Cell. Biol 22, 5100–5113 (2002). [DOI] [PMC free article] [PubMed] [Google Scholar]
- 32.Pan Y et al. Athymic mice reveal a requirement for T-cell-microglia interactions in establishing a microenvironment supportive of Nf1 low-grade glioma growth. Genes Dev. 32, 491–496 (2018). [DOI] [PMC free article] [PubMed] [Google Scholar]
- 33.Hegedus B et al. Preclinical cancer therapy in a mouse model of neurofibromatosis-1 optic glioma. Cancer Res. 68, 1520–1528 (2008). [DOI] [PubMed] [Google Scholar]
- 34.Dobin A et al. STAR: ultrafast universal RNA-seq aligner. Bioinformatics 29, 15–21 (2013). [DOI] [PMC free article] [PubMed] [Google Scholar]
- 35.Love MI, Huber W & Anders S Moderated estimation of fold change and dispersion for RNA-seq data with DESeq2. Genome Biol. 15, 550 (2014). [DOI] [PMC free article] [PubMed] [Google Scholar]
- 36.Subramanian A et al. Gene set enrichment analysis: a knowledge-based approach for interpreting genome-wide expression profiles. Proc. Natl Acad. Sci. USA 102, 15545–15550 (2005). [DOI] [PMC free article] [PubMed] [Google Scholar]
- 37.Mootha VK et al. PGC-1α-responsive genes involved in oxidative phosphorylation are coordinately downregulated in human diabetes. Nat. Genet 34, 267–273 (2003). [DOI] [PubMed] [Google Scholar]
Associated Data
This section collects any data citations, data availability statements, or supplementary materials included in this article.
Supplementary Materials
Data Availability Statement
Original western blots are included in the Supplementary Information (supplementary Fig. 1). Human pilocytic astrocytoma RNA-seq data are deposited with the Gene Expression Omnibus under accession number GSE163071. The cell lines and other reagents described here are freely available and can be obtained by contacting the corresponding authors and with a standard materials transfer agreement. Any other relevant data are available from the corresponding authors upon reasonable request. Source data are provided with this paper.