

Abstract
Social interactions among animals mediate essential behaviours, including mating, nurturing, and defence1,2. The gut microbiota contribute to social activity in mice3,4, but the gut–brain connections that regulate this complex behaviour and its underlying neural basis are unclear5,6. Here we show that the microbiome modulates neuronal activity in specific brain regions of male mice to regulate canonical stress responses and social behaviours. Social deviation in germ-free and antibiotic-treated mice is associated with elevated levels of the stress hormone corticosterone, which is primarily produced by activation of the hypothalamus–pituitary–adrenal (HPA) axis. Adrenalectomy, antagonism of glucocorticoid receptors, or pharmacological inhibition of corticosterone synthesis effectively corrects social deficits following microbiome depletion. Genetic ablation of glucocorticoid receptors in specific brain regions or chemogenetic inactivation of neurons in the paraventricular nucleus of the hypothalamus that produce corticotrophin-releasing hormone (CRH) reverse social impairments in antibiotic-treated mice. Conversely, specific activation of CRH-expressing neurons in the paraventricular nucleus induces social deficits in mice with a normal microbiome. Via microbiome profiling and in vivo selection, we identify a bacterial species, Enterococcus faecalis, that promotes social activity and reduces corticosterone levels in mice following social stress. These studies suggest that specific gut bacteria can restrain the activation of the HPA axis, and show that the microbiome can affect social behaviours through discrete neuronal circuits that mediate stress responses in the brain.
Bidirectional communication between the gut and the brain affects health and disease5,7. Various environmental and/or peripheral factors influence gut–brain interactions, including the intestinal microbiota. Changes in stress responses, anxiety, locomotion, and social behaviour have shown that the microbiota contribute to brain development and function and to behaviour4,6,8–13. Specific gut bacterial species contribute to each of these behavioural domains in mice3,14. The influence of host–microorganism interactions on complex behaviours may extend beyond preclinical studies, as the human microbiome is altered in several neuropsychiatric disorders that are associated with changes in sociability5.
Sensory processing, internal states, and decision-making are crucial for the control of social behaviour2. An animal perceives visual, olfactory, pheromonal, auditory, and/or tactile cues from another animal, which may modulate the internal state of the first animal towards a decision that will guide a specific response. In addition, past experiences, emotions, motivation, and physiological inputs shape the internal state and influence the final outcome of a social response2. Activation or inhibition of specific brain regions or circuits can determine the type of response towards another animal, such as a decision to mate, nurture, fight, surrender, flee, or investigate1,2.
In addition to outcomes determined by the brain, the regulation of social behaviour may be influenced by the gastrointestinal tract3,4. Diet choice affects social aggression15. Most, but not all11, studies show that rodents lacking gut bacteria display decreased social behaviour compared to animals with a complex microbiome3,4,16. Mouse models of autism spectrum disorder display changes in gut microbiome composition, and probiotic treatment corrects certain social outcomes3,14,17–19. In humans, gastrointestinal symptoms have been observed in several psychiatric disorders with a social component20,21, and individuals with these disorders also have altered microbiomes compared to healthy individuals22,23. Despite the emerging appreciation of the effects of gut bacteria on complex behaviour, the neural circuits that are influenced by the microbiome to modulate social activity remain unknown.
Gut microbiota affect social activity
Consistent with previous studies3,4, germ-free (GF) mice showed reduced social activity towards novel stranger mice, regardless of microbial status (Fig. 1a–c, Extended Data Fig. 1a–c). Notably, non-social activity was indistinguishable between GF and specific-pathogen-free (SPF) mice, which harbour complex microbiota (Extended Data Fig. 1f, g). Adult SPF mice treated orally with a broad-spectrum antibiotic cocktail (ABX) to deplete their microbiota also showed decreased social activity (Fig. 1a, d, Extended Data Fig. 1d). Social activity was not altered by presentation of a novel ABX mouse (Extended Data Fig. 1e). Non-social activity was not changed by antibiotic treatment (Extended Data Fig. 1f). Culture-dependent and culture-independent analysis showed that the microbiota were fully depleted in GF and ABX mice (Extended Data Fig. 2). Neither administration of antibiotics directly into the brain nor chronic systemic injection of antibiotics altered social behaviour (Extended Data Fig. 1h–j), which suggests that antibiotics are not neurotoxic. Depletion of the microbiome reduced social activity regardless of animal sex, social isolation time, and age (Extended Data Fig. 1k–m) but did not cause altered behaviour in the three-chamber social test (Extended Data Fig. 1n–q).
Fig. 1 |. The gut microbiome regulates social behaviour and serum corticosterone levels in mice.

a, Timeline schematic of studies using GF mice and ABX-treated SPF mice. Iso, isolation; RSI, reciprocal social interaction. b, c, Social activity of SPF and GF test mice (subject), in the context of SPF (b) and GF (c) novel mice. d, Social activity of adult SPF mice treated with ABX or vehicle. e, i, Representative images of c-Fos staining in brain sections from SPF and GF mice (e) and vehicle (VEH)- or ABX-treated SPF mice (i). adBNST, anterodorsal BNST; LV, lateral ventricle; 3V, third ventricle. Scale bars, 200 μm. f–h, j–l, Quantification of c-Fos+ cells in GF (f–h) and ABX-treated (j–l) mice. m–o, Serum corticosterone levels in GF (m, n) and ABX-treated (o) mice following social interactions as shown. Data shown as individual points with mean ± s.e.m. from at least two independent trials. n = a, 20 SPF, 19 GF; b, n, 8; c, 26; f–h, 6; j–l, 5; m, 13 SPF, 18 GF; o, 30 mice per group. Two-tailed unpaired t-test (b–d, f–h, j–o).
Anxiety-like behaviour was lower in GF mice than in their SPF counterparts, as previously reported8, although there was no change in this behaviour in ABX mice (Extended Data Fig. 3a–h). Overall locomotor activity was not affected in the GF or ABX groups (Extended Data Fig. 3a, e, i). GF status did not alter water intake (Extended Data Fig. 3j), and the heightened olfactory investigatory behaviour seen in GF mice exposed to soiled bedding from SPF mice is probably due to novelty (Extended Data Fig. 3k). Habituation and dishabituation to an equally novel social odour were similar in GF and SPF mice (Extended Data Fig. 3l). Responses to microbial scents may influence olfactory communication24. As volatile odours from GF rats in oestrus induce similar sexual responses in male rats to odours from control rats25, moderate effects on olfaction in GF mice are unlikely to explain the stark contrast in social behaviour compared to SPF mice. Collectively, these data show that the absence of gut microbiota impairs social activity in mice, and that social deviations are not likely to be a consequence of olfactory dysfunction, anxiety, or altered locomotion.
Microbiota affect brain region activity
We investigated brain activation patterns in GF and ABX mice. Expression of c-Fos, a measure of neuronal activation, was increased after a social encounter in brain regions associated with stress responses, including the paraventricular nucleus of the hypothalamus (PVN), bed nucleus of stria terminalis (BNST) and hippocampal dentate gyrus (DG) (Fig. 1e–l). We observed a trend towards increased c-Fos staining in the basolateral amygdala (BLA) of GF and ABX mice (Extended Data Fig. 1r, s). GF mice only showed increased brain activation in response to social interaction (Extended Data Fig. 1t). Several immediate-early genes in the hippocampus and hypothalamus of GF mice were elevated following exposure to stranger animals (Extended Data Fig. 4a–d). The effects of gut bacteria on the social behaviour studied are not likely to be mediated through vasopressin, whereas an oxytocin-dependent pathway cannot be completely ruled out26 (Extended Data Fig. 5a–e, Supplementary Information 1). We conclude that depletion of the microbiota activates or de-represses activity in distinct brain regions in response to a social interaction.
Gut bacteria regulate corticosterone
Gut bacteria modulate the HPA stress response in mice9 and affect corticosterone production by the HPA axis9,12,13,16. Accordingly, serum corticosterone levels were more robustly increased after a transient social encounter in GF and ABX mice than in SPF controls (Fig. 1m–o). Corticosterone concentrations trended upward immediately after a social encounter and lasted at least one hour in ABX mice (Extended Data Fig. 1u). Corticosterone levels were increased in GF mice, but not ABX mice, exposed to a novel cage (Extended Data Fig. 1v). Changes in corticosterone levels were not subject to circadian rhythms (Extended Data Fig. 1w, x). Transplantation of gut bacteria from SPF donors into GF mice corrected social activity and lowered corticosterone (Extended Data Fig. 1y, z), showing that the effects of microbiota alterations are reversible. The increases in corticosterone levels in GF and ABX mice following social interaction were not due to differences in PVN neuronal density (Extended Data Fig. 5f–k, Supplementary Information 1). We therefore investigated the hypothesis that the HPA axis mediates the observed behavioural outcomes in GF and ABX mice.
We inhibited corticosterone production using both pharmacological and surgical approaches (Fig. 2a). In GF mice, injection of the corticosterone synthesis blocker metyrapone (MET) reduced serum corticosterone levels and significantly increased social activity compared to injection of the vehicle control, carboxymethylcellulose (CMC) (Fig. 2b, c). The adrenal gland is a major source of corticosterone, and adrenalectomy (ADX) blocked corticosterone increases in ABX mice compared to sham controls (ABX-sham versus ABX-ADX) (Fig. 2d). Notably, ABX-ADX mice showed normal social activity (vehicle-sham versus ABX-ADX; Fig. 2e, CMC1st and CMC2nd), whereas ABX-sham mice showed reduced social activity compared to controls (vehicle-sham versus ABX-sham; Fig. 2e, CMC1st and CMC2nd). Administration of RU-486 to antagonize glucocorticoid receptors led to similar social activity in vehicle-sham and ABX-sham mice, whereas MET treatment to inhibit corticosterone synthesis increased social behaviour in ABX-sham mice compared to vehicle-sham mice (Fig. 2e). ABX-ADX mice showed increased social activity following treatment with either RU-486 or MET (Fig. 2e). By contrast, acute injection of corticosterone impaired social behaviour in all groups (Extended Data Fig. 6a). We observed minimal effects on non-social activity following surgery or drug treatment (Extended Data Fig. 6b–d).
Fig. 2 |. Microbiome modulation of glucocorticoid signalling alters social behaviour.

a, Timeline schematic for b–f of ABX, ADX and SDV and treatment with CMC, MET, RU-486 and CCK-8 (cholecystokinin 8). b, Serum corticosterone in MET-injected GF mice. c, Social activity in MET-injected GF mice. d, Serum corticosterone in ABX-treated ADX mice. e, Social activity in ABX-treated ADX mice injected with RU-486 or MET. s, sham. f, Social activity in ABX-treated SDV mice. g, Timeline scheme for h–m. ICI, intracerebral injection. h, j, l, Social activity in ABX-treated Nr3c1ΔDG (h), Nr3c1ΔBNST (j) and Nr3c1ΔHYPO (l) mice. i, k, m, Serum corticosterone in ABX-treated Nr3c1ΔDG (i), Nr3c1ΔBNST (k) and Nr3c1ΔHYPO (m) mice. Data shown as individual points with mean ± s.e.m. from at least two independent trials. n = b, c, 5 SPF-CMC, 5 GF-CMC, 6 SPF-MET, 5 GF-MET; d, e, 11 VEH-sham, 18 ABX-sham, 11 ABX-ADX; f, 7 VEH-sham, 9 ABX-sham, 6 ABX-SDV; h–k, 7; l, 7 control, 5 Nr3c1ΔHYPO; m, 6 control, 5 Nr3c1ΔHYPO mice per group. Two-way ANOVA (b, c) with repeated measures (h, j), mixed-effects (e, l), one-way ANOVA (d, f) with Bonferroni multiple comparison test; two-tailed unpaired t-test (i, k, m).
The vagus nerve is a key pathway for gut–brain communication19. However, social behaviour and corticosterone levels were not changed by subdiaphragmatic vagotomy (SDV) in ABX mice (ABX-sham versus ABX-SDV) (Fig. 2f, Extended Data Fig. 6e–g), which suggests that the vagus nerve does not participate in social impairment resulting from microbiota depletion.
Next, we deleted the gene encoding the glucocorticoid receptor (Nr3c1) in specific brain regions by stereotaxic injection of AAV-hSyn-Cre-GFP bilaterally into Nr3c1f/f mice (Fig. 2g, Extended Data Fig. 7a, d, g). In ABX-treated Nr3c1f/f mice, knockout of Nr3c1 in the DG (Nr3c1ΔDG) or BNST (Nr3c1ΔBNST) resulted in an increase in social activity compared to ABX-treated wild-type mice injected with AAV-hSyn-Cre-GFP (control) (Fig. 2h, j). Global blockade of glucocorticoid receptor signalling by RU-486 enhanced social activity only in ABX control mice, but not ABX Nr3c1ΔDG or Nr3c1ΔBNST mice (Fig. 2h, j). Accordingly, serum corticosterone levels (Fig. 2i, k) and c-Fos expression (Extended Data Fig. 7c, f, j) in the PVN and BNST were reduced in ABX Nr3c1ΔDG and Nr3c1ΔBNST mice after social interaction. Increased social behaviour and decreased corticosterone were observed in Nr3c1ΔDG and Nr3c1ΔBNST mice only after antibiotic treatment, but not in mice with an intact microbiome (Extended Data Fig. 7k, m, p), with the exception of decreased social activity in SPF Nr3c1ΔBNST mice (Extended Data Fig. 7n).
Bilateral stereotaxic delivery of AAV-hSyn-Cre-GFP into the hypothalamic region (including the PVN) of Nr3c1f/f mice (Nr3c1ΔHYPO) decreased social behaviour compared to non-ablated control mice following ABX treatment, with or without administration of RU-486 (Fig. 2l). Serum corticosterone (Fig. 2m) and c-Fos expression in the DG (Extended Data Fig. 7i, j) were significantly increased in ABX-treated Nr3c1ΔHYPO mice, supporting the notion that the glucocorticoid receptor in the hypothalamus serves as a negative regulator of the HPA axis. Non-social activity was not affected in Nr3c1ΔDG or Nr3c1ΔHYPO mice, but was reduced in ABX-treated Nr3c1ΔBNST mice (Extended Data Fig. 7b, e, h, l, o, r). Decreased social behaviour and increased corticosterone in Nr3c1ΔHYPO mice were observed only following antibiotic treatment (Fig. 2l, m, Extended Data Fig. 7q, s). These results indicate that glucocorticoid receptors have distinct functions in different brain regions, and that they affect the levels of corticosterone and social behaviours that are regulated by the microbiota.
CRH neurons modulate social behaviour
Although global changes in stress-related genes were not observed in the DG, Ammon’s horn, or hypothalamus (Extended Data Fig. 4e–l), the Crh gene was selectively upregulated in the hypothalamus of ABX mice after social interaction (but not following novel cage exposure) (Fig. 3a). We used a chemogenetic approach with designer receptors exclusively activated by designer drugs (DREADDs) to deliver a mutated human M4 muscarinic receptor, hM4Di27, via AAV to inactivate CRH-expressing neurons. Specifically, AAV-hSyn-DIO-hM4Di-mCherry (hM4Di) was bilaterally injected into the PVN of Crh-ires-Cre mice, with AAV-hSyn-DIO-mCherry (mCherry) used as a control (Fig. 3b, Extended Data Fig. 8a). Treatment with clozapine N-oxide (CNO), a designer drug for DREADDs, markedly increased social behaviour in ABX mice in an acute fashion (Fig. 3c), and decreased corticosterone in ABX hM4Di mice, but not in ABX mCherry mice (Fig. 3d). Inactivation of CRH neurons in the PVN also decreased c-Fos staining after social interaction (Fig. 3e–g), but did not alter c-Fos expression in the BNST or DG (Extended Data Fig. 8c–f). We were unable to determine whether c-Fos staining was specific to CRH neurons. Delivery of AAV-hSyn-DIO-hM4Di-mCherry bilaterally into the BNST, another region with high expression of CRH, did not alter social behaviour, corticosterone levels, or brain c-Fos expression (Extended Data Fig. 8g–m). Non-social activity was unchanged following inactivation of CRH neurons in the PVN or BNST (Extended Data Fig. 8b, i).
Fig. 3 |. CRH neurons and glucocorticoid receptors affect social behaviour.

a, Crh expression in hypothalamus of ABX mice exposed to novel cage or novel mouse (social). b, Timeline schematic for c–g (mice received antibiotics). ROB, retro-orbital blood collection. c, Social activity in ABX Crh-ires-Cre mice injected in the PVN with AAV-hSyn-DIO-mCherry (mCherry) or AAV-hSyn-DIO-hM4Di-mCherry (hM4Di). d, Serum corticosterone in ABX- and CNO-treated mCherry and hM4Di mice. e, f, Representative images (from 10 mCherry, 11 hM4Di mice) of c-Fos, mCherry and DAPI staining (scale bars, 100 μm). g, Quantification of c-Fos+ cells in the PVN of ABX- and CNO-treated hM4Di and mCherry mice. h, Timeline schematic for i, j. i, Serum corticosterone in Crh-ires-Cre SPF mice injected in PVN with mCherry or AAV-hSyn-DIO-hM3Dq-mCherry (hM3Dq) and treated with CNO. j, Social activity in SPF mCherry or hM3Dq mice treated with CNO. k, n, Timeline schematics for l–m, o–p. CRF, corticotropin releasing factor peptide; CORT, corticosterone; DEX, dexamethasone. l, m, Social activity in PVN CRF-injected SPF test mice. o, p, Social activity in CORT- or DEX-injected SPF test mice. Data shown as individual points with mean ± s.e.m. from at least two independent trials. n = a, 6 VEH, 6 ABX (novel cage), 5 VEH, 6 ABX (social exposure); c, g, 10 mCherry, 11 hM4Di; d, 9 mCherry, 10 hM4Di; i, j, 10 mCherry, 11 hM3Dq; l, m, 9 CRFhigh, 7 CRFlow; o, 7; p, 8 VEH, 8 CORT, 6 DEX mice per group. Two-way ANOVA (a) with repeated measures (c, j), one-way ANOVA with repeated measures (o) with mixed effects (p) with Bonferroni multiple comparison test; two-tailed paired (d, i, l, m) and unpaired t-test (g). NS, not significant.
Unilateral injection of the retrograde neural tracer cholera toxin B subunit (CTB) into the PVN of SPF and GF mice (Extended Data Fig. 9a) showed a trend towards a reduction in labelled neuronal projections from the PVN in the BNST, lateral septum (LS), and medial amygdala (MeA) in the ipsilateral hemisphere of SPF mice compared with GF mice (Extended Data Fig. 9b, c). We next co-injected CTB into the PVN and Fluorogold into the BNST of ABX Crh-ires-Cre;Ai14D reporter mice (Extended Data Fig. 9d). The PVN receives similar projections from the BNST, LS, and MeA in both ABX and control mice (Extended Data Fig. 9e, g). Labelling alternative projections showed that the PVN and BNST are bidirectionally connected to each other and receive neuronal projections from the LS and MeA (Extended Data Fig. 9f, g). Notably, retrograde labelling from the PVN and BNST was similar in both ABX and vehicle-treated mice (Extended Data Fig. 9e–g). Therefore, decreased social behaviour in GF and ABX mice is probably due to changes in neural activity rather than neural circuitry, with the PVN being the major region, although we cannot rule out other circuits.
Stress pathways promote social deficits
To test whether activation of CRH neurons in the PVN is sufficient to induce social impairment under more ‘natural’ conditions (rather than in GF or ABX mice), we bilaterally injected AAV-hSyn-DIO-hM3Dq-mCherry (hM3Dq) into the PVN of SPF Crh-ires-Cre mice, using mice injected with AAV-hSyn-DIO-mCherry (mCherry) as controls (Fig. 3h, Extended Data Fig. 8n). hM3Dq is a mutated human M3 muscarinic receptor that induces neuronal firing when activated27. Injection of CNO increased corticosterone in SPF hM3Dq mice, but not in SPF mCherry mice (Fig. 3i). Chemogenetic activation of CRH neurons in the PVN following intraperitoneal injection of CNO significantly decreased social behaviour in SPF hM3Dq mice (Supplementary Video 1), but not in SPF mCherry mice (Fig. 3j) or SPF hM3Dq mice injected with vehicle (Supplementary Video 2). Activation of CRH neurons in the PVN also increased non-social activity in SPF hM3Dq mice (Extended Data Fig. 8o, Supplementary Video 1), which was also observed in mice under stress conditions28.
Administration of synthetic corticotropin-releasing factor (CRF) directly into the PVN of SPF mice reduced social activity towards a novel mouse (Fig. 3k–m, Extended Data Fig. 8p). Notably, CRF levels affected non-social activity: low levels of CRF increased non-social activity and high levels had no effect (Extended Data Fig. 8q). Injection of corticosterone or the glucocorticoid receptor agonist dexamethasone into the DG and BNST of SPF mice also decreased social activity (Fig. 3n, o, p, Extended Data Fig. 8r, s). Therefore, activation of CRH+ neurons in the PVN and of glucocorticoid receptor-expressing neurons in the DG and BNST induce social alterations, revealing a neural pathway that regulates social behaviour. We speculate that this circuit may also mediate social activity in response to non-microbial cues.
Enterococcus faecalis restores social behaviour
We next sought to identify gut bacterial species that affect social activity in mice. Treatment of SPF mice with different combinations of antibiotics (ampicillin (A), vancomycin (V), neomycin (N), and metronidazole (M)) showed that a microorganism(s) that is exclusively sensitive to neomycin appeared to be responsible for modulating social activity and c-Fos expression in the PVN (Fig. 4a, b, Extended Data Fig. 10a). After social interaction, corticosterone levels were lower in AVM-treated mice than in AVNM-treated mice (Fig. 4c). Notably, transplantation of microbiota from antibiotic-treated donor mice into untreated GF recipients transferred the associated social activity phenotypes (Fig. 4d) and decreased serum corticosterone levels (Fig. 4e), suggesting that specific (neomycin-sensitive) bacterial species mediate social behaviour.
Fig. 4 |. Enterococcus faecalis restores social deficits and corticosterone levels in mice.

a, Timeline schematics for b, c, f (left) and d, e, g (right). b, Social activity in mice treated with various antibiotic combinations (see main text). c, Serum corticosterone levels after social interaction in AVM- and AVNM-treated mice. d, Social activity in GF mice receiving faecal transplants from AVNM- or AVM-treated donor mice. e, Serum corticosterone levels in GF mice receiving faecal transplants from AVNM- or AVM-treated donor mice. f, Composition of bacteria (at family level) in faeces from AVNM- and AVM-treated donor mice. g, Enterococcus loads in faecal pellets from GF mice that received faecal transplants from AVNM- and AVM-treated donor mice. Red dashed line, lower limit of quantification (LLOQ). h, Timeline schematic depicts two rounds of RSI (first, baseline 3-week ABX effects; second, 3-week E.f. colonization effects). ABX mice colonized with E. faecalis (ABX + E.f.). Control buffer was given to vehicle (VEH + Ctrl) and ABX (ABX + Ctrl) mice. i, Social activity in VEH + Ctrl, ABX + Ctrl and ABX + E.f. mice. j, Serum corticosterone levels in ABX + Ctrl mice after second RSI. Data shown as individual points with mean ± s.e.m. from at least two independent trials. n = b, c, 8; d, e, 12 GF-AVNM, 14 GF-AVM; g, 11 GF-AVM, 9 GF-AVNM; i, 8 VEH, 8 ABX, 7 ABX + E.f.; j, 7 VEH + Ctrl, 8 ABX + Ctrl,7 ABX + E.f. mice per group. One-way ANOVA (b, j), two-way ANOVA with repeated measures (i) with Bonferroni multiple comparison test; two-tailed unpaired t-test (c–e). NS, not significant.
Standard bacterial 16S rRNA gene sequencing did not profile the microbiome because of low biomass in faecal samples following antibiotic depletion (Extended Data Fig. 2e–k). Using a recently developed quantitative microbiome sequencing framework29, we identified a taxon in the Enterococcus genus that was present in AVM-treated and AVM-microbiota recipient mice, and absent in mice that received faecal samples from AVNM donors (Fig. 4f, g, Extended Data Fig. 10b–d). The predominant bacterial species from the AVM microbiota is E. faecalis (E.f.) (Fig. 4g, Extended Data Fig. 10d).
Adult SPF mice were treated for three weeks with ABX as above, and then switched to regular water and colonized with E. faecalis (ABX + E.f.) or treated with sodium bicarbonate control (ABX + control) by gavage (Fig. 4h). Matched vehicle mice (no antibiotics) were gavaged with bicarbonate. Mice were first behaviour tested before gavage (first trial) to confirm that antibiotics reduced social activity in this paradigm (Extended Data Fig. 10e). Notably, after three weeks of colonization with E. faecalis (Extended Data Fig. 10f), ABX + E.f. mice showed an increase in social activity compared to their first trial (Fig. 4i) or ABX + control mice (Extended Data Fig. 10g). Corticosterone levels were reduced in ABX + E.f. mice compared to ABX + control mice, to levels similar to vehicle-treated mice (Fig. 4j). These data reveal that E. faecalis increases social activity in mice with ABX-depleted microbiota, but they do not exclude the possibility that other bacteria have similar or synergistic effects. GF mice mono-colonized with E. faecalis (GF + E.f.) also showed an increase in social activity and decreased c-Fos expression in the brain compared to GF mice (Extended Data Fig. 10h–k), with corticosterone levels unaffected (Extended Data Fig. 10l), potentially as a result of developmental issues in GF mice or the lack of other microorganisms. We conclude that specific members of the gut microbiota, such as E. faecalis, can affect social behaviour in mice.
Discussion
We have provided evidence that a complex microbiome suppresses an overactive stress response during encounters with a novel mouse by dampening the HPA-axis-mediated production of corticosterone; we confirmed this result by restoring sociability upon removal of the adrenal gland, antagonism of the glucocorticoid receptor, or pharmacological inhibition of corticosterone synthesis in mice devoid of gut bacteria. Antibiotic depletion of the microbiota in adult mice, used here as research tool and not suggested clinically, recapitulated many of the findings with GF mice. It is tempting to speculate that symbiotic bacteria have evolved properties that promote social behaviours among animals under stress to disseminate microorganisms within a population30, create social groups among animals to preserve microbial communities24, and/or influence animal mating to expand host–microbiome symbiosis across generations31.
The gut microbiome is altered in several neuropsychiatric conditions that involve social deficits, such as autism spectrum disorder22, and findings in rodents and humans have implicated changes in gut bacteria as a contributing factor to brain morphology, activity, transcriptional patterns, neurogenesis, expression of neurotransmitters, and many complex behaviours32. The discovery of a specific neuronal pathway that responds to signals from the gut may enable interventions to modulate social behaviours through safe, natural, and non-invasive approaches. Future research will aim to uncover the microbial molecules that are responsible for modulating social activity and to identify host receptors and cell types that receive microbial signals and translate them into specific behavioural outputs.
Methods
Mice
Wild-type C57BL/6J (00064), Nr3c1f/f (021021; B6.Cg-Nr3c1tm1.1Jda/J), Crh-ires-Cre (012704; B6(Cg)-Crhtm(cre)Zjh/J), and Ai14D (007914; B6.Cg-G t(ROSA)26Sortm14(CAG-tdTomato)Hze/J) mice were obtained through Jackson Laboratory. C57BL/6J germ-free (GF) mice were bred in the Gnotobiotic Animal Facility at Caltech. In addition, wild-type C57BL/6JNarl mice used in SDV, brain cannulation, chronic antibiotic intraperitoneal injection, partial colonization, and anxiety-like behaviour experiments were obtained through National Laboratory Animal Center, Taiwan. All experiments were performed with male mice except for Extended Data Fig. 1k. All mice were group housed (2–5 mice per cage) unless specified with a 13-h light/11-h dark cycle (lights on at 06:00) at 21–23 °C and 45–55% relative humidity within a range of 30–70% in ventilated cages (Super Mouse 750, Lab Products). Unless specified, SPF mice were fed 5053 PicoLab Rodent Diet (LadDiet) and the SPF breeders were fed a mix of half 5053 and half 5058 PicoLab Rodent Diet. SPF C57BL/6J mice obtained from Jackson Laboratory were yielded from multiple litters (at least 6–8 litters) and randomly assigned to subject groups (SPF, vehicle, or ABX) or novel mice (SPF or ABX) to eliminate the maternal effect. GF mice used in this study were yielded from multiple litters (at least 6 litters) and randomly assigned to testing groups to eliminate the maternal effect. No statistical methods were used to predetermine sample size. The investigators were not blinded to allocation during experiments and outcome assessment.
For experimental mice, SPF, GF, vehicle and ABX mice were transferred and maintained in sterilized cages and fed autoclaved 5010 PicoLab Rodent Diet (LadDiet) and provided with autoclaved drinking water. GF mice were housed outside the GF isolator for no more than a week. GF mice used in this study were tested for behaviour at 11–15 weeks of age. The SPF mice used for comparison with GF mice were all age-matched. All GF mice completed the behaviour test once and were processed with tissue collections 30–60 min after behaviour testing. Faecal samples from GF mice were freshly collected at the endpoint of each experiment. The faeces were plated onto Brucella agar plates with 5% sheep’s blood (B0150; Teknova) and cultured aerobically and anaerobically to screen for contamination in the sterile housing. All SPF mice were handled with the same procedures as GF mice. All experiments were performed with approval of the Caltech and NCKU Institutional Animal Care and Use Committee (IACUC).
Antibiotic cocktail (ABX) treatment
Gut microbiota were depleted in adult mice (8–12 weeks) by treatment with a cocktail of antibiotics for 3–4 weeks. The recipe included drinking water with ampicillin (1 g/l), vancomycin (0.5 g/l), neomycin (1 g/l), and metronidazole (0.5 g/l), and was sweetened with 1% w/v of sucrose and filtered with a 0.22-μm filter. To avoid confounding effects from chronic stress induced by oral gavage, antibiotics were administered in the drinking water ad libitum. Untreated (vehicle control) mice received 1% w/v of sucrose in filtered drinking water. The length of ABX treatment was adapted based on the recovery of body weight after ABX treatment. All antibiotics were United States Pharmacopeia (USP) grade, or at minimum cell culture grade. Drinking water was prepared and changed weekly. All vehicle-treated mice went through the same handling procedures as ABX mice. Faecal samples were freshly collected at the endpoint of each experiment and plated onto Brucella agar plates with 5% sheep’s blood (B0150; Teknova) and cultured aerobically and anaerobically to test whether gut bacteria were successfully depleted following ABX treatment.
Corticosterone measurement
Whole blood was collected by either cardiac puncture or retro-orbital bleeding and placed into Micro tube Z gel (41.1378.005; Sarstedt). Serum was separated by centrifuge at 10,000g for five minutes and stored at −80 °C until use. Corticosterone levels were detected using the Corticosterone EIA Kit (K014-H5; Arbor Assays) according to the manufacturer’s protocol. Owing to the effects of the circadian rhythm on corticosterone levels, we collected blood samples only between 13:00 and 17:00 on each day of the experiment.
Adrenalectomy
Mice were anaesthetized with 5% isoflurane in an induction box followed by maintenance on a nose cone with 1–2% isoflurane during surgery. A single dose of sustained-release buprenorphine (1 mg/kg) was subcutaneously injected before surgery. The surgical fields were covered with a sterile drape and sterile gloves were worn. A 1.5-cm dorsal midline incision was made with its midpoint centred over the 13th rib. All of the underlying muscle on either side of the spinal column was incised. The adrenal glands are located in the fat pad that covers the cranial portion of the kidney. The adrenal glands were isolated and removed using a small curved forcep and a micro scissor. Bupivacaine (1 mg/kg) was applied subcutaneously along the incision just before wound closure. The peritoneal opening was closed with a 5–0 subcutaneous suture (Vicryl) and 7-mm wound clips (Roboz) were applied to close the dermis. For postoperative care, mice were monitored for signs of pain or distress at least three times a day for three days, and were supplied with drinking water containing 30 mg/kg ibuprofen for seven days with 0.9% sodium chloride ad libitum. The clips were removed two weeks after surgery under isoflurane anaesthesia. Sham-operated control mice underwent the same procedure as described above without removal of the adrenal glands.
Drug administration
To systemically inhibit corticosterone synthesis, mice were intraperitoneally injected with 50 mg/kg metyrapone (3292; R&D) and returned to their home cage. To block glucocorticoid receptors, mice were intraperitoneally injected with 40 mg/kg RU-486 (also known as mifepristone; M8046; Sigma-Aldrich) and returned to their home cage. Metyrapone and RU-486 were freshly dissolved in 0.5% carboxymethylcellulose sodium (CMC; C9481; Sigma) on the day of the reciprocal social interaction test. Injection with 0.5% CMC was used as a baseline control. Behaviour testing was performed 40 min after injection.
For acute corticosterone exposure, mice were intraperitoneally injected on two consecutive days with 10 mg/kg corticosterone 2-hydroxypropyl-β-cyclodextrin complex (C174; Sigma-Aldrich) and returned to their home cage. The corticosterone 2-hydroxypropyl-β-cyclodextrin complex was used to facilitate solubility of the steroid. The reciprocal social interaction test was performed 40 min after the second corticosterone injection.
For DREADD-based chemogenetic activation or inactivation, mice expressing hM3Dq, hM3Di or mCherry were intraperitoneally injected with 2–3 mg/kg CNO (Enzo Life Sciences) and returned to their home cage. The reciprocal social interaction test was performed 32–40 min after the second CNO injection.
Viral vectors
AAV-hSyn-DIO-hM4Di-mCherry (44362-AAV5); AAV-hSyn-DIO-hM3Dq-mCherry (44361-AAV5); AAV-hSyn-DIO-mCherry (50459-AAV5); AAV-hSyn-EGFP (50465-AAV5) viruses were purchased through Addgene. AAV-hSyn-Cre-GFP (AAV5) was produced at the Vector core at the University of North Carolina at Chapel Hill.
Stereotaxic surgery
Adult (7–8 weeks old) mice were deeply anaesthetized with 5% isoflurane in oxygen and kept at 1–2% isoflurane during surgery. In addition, 5 mg/kg ketoprofen was subcutaneously given once before surgery. Surgery was performed with a stereotaxic frame (Model 1900; David Kopf Instruments). The bregma was located by using a centring scope (Model 1915; David Kopf Instruments) and aligned using a stereotaxic alignment indicator (Model 1905; David Kopf Instruments). The skull was exposed, and holes were produced using a stereotaxic drill (Model 1911; David Kopf Instruments) with a no. 79 micro drill bit (Drill Bit City). Viruses were injected into the brain in both hemispheres using a pulled glass capillary (1B120F-4; World Precision Instruments) with a nanolitre injector (Nanoliter2010; World Precision Instruments) at a flow rate of 23 nl/minute controlled by a micro controller (Micro4; World Precision Instruments). The glass capillaries were left in place for five minutes to prevent backflow. Stereotaxic injection coordinates (in millimetres) were based on the Paxinos and Franklin atlas33: PVN (AP: –0.80, ML: ±0.25; DV: −4.75), BNST (AP: 0.26, ML: ±0.90; DV: −4.30), DG (AP: −1.50, ML: ±0.40; DV: −2.25). The diagrams of brain injection were based on the Paxinos and Franklin atlas33 (Extended Data Figs. 7a, d, g, 8a, g, n). Volumes delivered were 207 nl for most regions, and 299 nl for the DG. Bupivacaine (1 mg/kg) was applied subcutaneously along the incision before wound closure. The incision on the scalp was closed with tissue adhesive (Gluture topical adhesive; Abbott Laboratories). For postoperative care, mice were monitored daily for signs of pain or distress for at least three days and were supplied for seven days with drinking water containing 30 mg/kg ibuprofen ad libitum. Behavioural experiments were performed at least three weeks after virus injection. All surgically manipulated animals underwent histological examination after death to ensure viruses were correctly injected.
Guide canula implantation surgery
Mice were anaesthetized with 5% isoflurane in oxygen in a Plexiglas cage. After anaesthesia, mice were placed in a digital stereotaxic device (Stoelting) delivering isoflurane to maintain anaesthesia throughout the surgery and injected subcutaneously with 5 mg/kg ketoprofen. The custom guide cannula was implanted in the following regions at the following coordinates based on the Paxinos and Franklin atlas33: lateral ventricle (LV), AP: −0.1 mm; ML: 1.0 mm; DV: −2.0 mm; PVN, AP: −0.8, ML: ±0.25, DV: −4.75; DG, AP: −1.5, ML: ±0.4, DV: −2.25; BNST: AP: 0.26, ML: .., DV: −4.3. The diagrams of brain cannulation were based on the Paxinos and Franklin atlas33 (Extended Data Fig. 8p, r, s). Two to four small stainless-steel screws were installed into the skull to anchor the acrylic maintaining the guide cannula. Then, a dummy stainless-steel plug was implanted in the cannula to prevent clogging with blood or cerebrospinal fluid at the cannula opening. For postoperative care, mice were monitored daily for signs of pain or distress for at least three days and were supplied for seven days with drinking water containing 30 mg/kg ibuprofen ad libitum.
The customized cannulization set includes a guide cannula, injector, dummy, and cap (Extended Data Fig. 8t). The guide cannula was implanted 0.5 mm above the PVN, DG, and BNST. The tip of the guide cannula track can be visualized in each implanted mouse. The injector was designed to reach 0.5 mm below the tip of guide cannula. As the injector was made of 33G fine needle, the needle tracks produced by the injector were not visible in brain slices. The cannulization set for the PVN, DG, and BNST was customized (RWD Life Science) with the following specification: PVN (guide cannula: double_OD 0.41 mm-27G/C.C0.5/B7.8/M3.5/C = 4.25 mm, dummy cannula: double_OD 0.20 mm-27G/C. C0.5/Mates with M3.5/G = 0.5 mm, Injector: double_OD0.21 mm-33G/C. C0.5/Mates with M3.5/C = 4.25 mm/G = 0.5 mm), DG (guide cannula: double_OD 0.41 mm-27G/C.C0.8/B7.8/M3.5/C = 1.75 mm, dummy cannula: double_OD 0.20 mm-27G/C.C0.8/Mates with M3.5/G = 0.5 mm, Injector: double_OD0.21 mm-33G/C.C0.8/Mates with M3.5/C = 1.75 mm/G = 0.5 mm), BNST (guide cannula: double_OD 0.41 mm-27G/C.C1.8/ B7.8/M3.5/C = 3.8 mm, dummy cannula: double_OD 0.20 mm-27G/C. C1.8/Mates with M3.5/G = 0.5 mm, Injector: double_OD0.21 mm-33G/C. C1.8/Mates with M3.5/C = 3.8 mm/G = 0.5 mm).
Intracerebroventricular (ICV) antibiotics injection
Ampicillin (1 mg/l) and metronidazole (0.5 mg/l) were dissolved in artificial cerebrospinal fluid (ACSF: 7.46 g/l NaCl, 0.19 g/l KCL, 0.14 g/l CaCl2, 0.19g/l MgCl2, 1.76 g/l NaHCO3, 0.18 g/l NaH2PO4, 0.61 g/l glucose in ddH2O) and adjusted to pH 7.4. The dissolved antibiotics were filtered through a 0.22-μm filter. Mice were infused with antibiotics during social behaviour tests with an infusion rate of 7 nl/s for 3 min.
CRF infusion in PVN
CRF was dissolved in saline (high-dose: 210 μM; low-dose: 42 μM) and injected into each hemisphere of PVN during anaesthesia with an infusion rate of 4.5 nl/s for a total infusion volume of 450 nl. Once complete, the injection syringe remained in tissue for 2 min to prevent backflow. After 2 min, the injection syringe was placed in the other hemisphere of PVN and the same volume of CRF was infused at the same flow rate. The mice were then placed in a novel cage to recover from anaesthesia until social behaviour testing.
Corticosterone and dexamethasone infusion in DG and BNST
Corticosterone (65 μM) or dexamethasone (20 mM) was dissolved in DMSO, diluted in saline, and injected bilaterally into DG and BNST of anaesthetized mice at an infusion rate of 4.5 nl/s up to 450 nl. The injection syringe remained in tissue for 2 min to prevent backflow. After 2 min, the injection syringe was placed in the other hemisphere of PVN and the same volume of corticosterone or dexamethasone was infused at the same flow rate. The mice were then placed in a novel cage to recover from anaesthesia until social behaviour testing.
Subdiaphragmatic vagotomy (SDV)
Mice were habituated to a liquid diet (Research Diets; AIN-76A) for two days and were fasted overnight before surgery. The abdominal surgery site was shaved and wiped with the skin disinfectant chlorhexidine three times before incision. Mice were then anaesthetized using 1–5% isoflurane and injected subcutaneously with 5 mg/kg ketoprofen. An incision was made along the abdominal midline and the muscle and skin were separated using blunt scissors. The liver was then gently moved using a sterile cotton swab to expose the stomach and oesophagus. The ventral and dorsal trunks of the vagus nerve were resected using sharp forceps. In the sham operation, the stomach and oesophagus were exposed but the vagal trunks were not resected. The organs were then placed back to their anatomical position. The incision along the muscular layer was closed with absorbable suture and treated with topical lidocaine (0.25%) and the skin incision was closed with non-absorbable suture and treated with n-butyl cyanoacrylate adhesive (3M Vetbond) to prevent infection. After surgery, the mice were placed into a clean cage placed on a heat pad. During the recovery time, mice were given a hydrating, nutritious gel pack (DietGel 76A 2oz, Clear H2O) for two days before receiving a normal chow diet. Mice were supplied with drinking water containing ibuprofen (20 mg/dl) ad libitum.
After behaviour testing, SDV was validated by intraperitoneal injection of cholecystokinin (CCK-8) following fasting-induced food consumption. Each mouse was fasted for 20 h, placed into a single cage, and injected i.p. with CCK-8 (8μg/kg, Sigma-Aldrich). After 2 h ad libitum feeding post-injection, food intake was recorded. The anorexia signal by CCK-8 is transmitted through the vagus nerve to acutely decrease satiety.
Hippocampal dentate gyrus (DG) and Ammon’s horn microdissection
Microdissection of the DG and Ammon’s horn was performed as described34. In brief, brains were sampled from deeply anaesthetized mice and placed in cold PBS for five minutes. The midbrain, brainstem, and cerebellum were removed so that only the cerebrum remained. The cerebrum was sagittally sliced along the midline of the brain. The cerebral hemisphere was placed in ice-cold PBS in a Petri dish and the thalamus and hypothalamus were removed under a dissection microscope. Once the medial side of the hippocampus was exposed, the DG could be readily visualized. A 27-gauge needle was inserted into the edge of DG and moved along the septo-temporal axis of the hippocampus to retrieve the DG. The rest of the hippocampus (Ammon’s horn) was collected with sharp forceps. The tissues were pooled from both hemispheres and placed in RNAlater (Qiagen) for storage. The samples were stored at −80 °C until RNA extraction. The diagrams of brain microdissection were based on the Paxinos and Franklin atlas33 (Extended Data Fig. 4e).
Brain sampling for IEG expression
GF mice were transferred out of isolators and temporarily co-housed with stranger GF mice from multiple cages. The brains of GF mice were immediately collected and dissected into hippocampus, hypothalamus, midbrain, and brainstem regions. Brains of SPF mice were sampled and handled following the same procedure. The primers for IEGs were adapted from a previous publication.35.
RNA extraction and quantitative real-time polymerase chain reaction (qRT–PCR)
RNA extraction of brain samples was based on the manufacturer’s protocol (Rneasy Mini Kit; Qiagen). RNA concentration and quality was measured by NanoDrop (Thermo Scientific). RNA (1 μg) from each sample was reverse transcribed using the iScript cDNA synthesis kit (Bio-Rad).
Gene expression in brain subregions was measured using Power SYBR Green PCR master mix (ThermoFisher Scientific) and analysed using ABI Prism 7900HT system (Life Technologies). Gene expression was normalized to Actb or Gapdh mRNA. Data are presented as fold-change in gene expression in each group relative to the control group. The primer sequences were adapted from the Harvard PrimerBank database36.
Fluorogold labelling
To label neurons in the PVN in a retrograde manner, mice were given a single intraperitoneal injection of 100 μl Fluorogold (2% w/v; Fluorochrome). The mice were perfused six days after injection37. Brains were sampled and stained using the standard protocols described above.
Retrograde tracing
Stereotaxic injection was performed as described above. SPF, GF, vehicle-treated and ABX-treated mice were stereotaxically injected into the PVN with 46 μl CTB-488 (0.5% w/v; C22841; ThermoFisher). Vehicle-treated and ABX-treated mice were stereotaxically injected into the BNST with 46 μl Fluorogold (2% w/v; Fluorochrome). Stereotaxic injection coordinates (in millimetres) and diagrams (Extended Data Fig. 9a, d) were based on the Paxinos and Franklin atlas33: PVN (AP: −0.80, ML: ±0.25; DV: −4.75), BNST (AP: 0.26, ML: ±0.90; DV: −4.30). Mice were perfused one week after injection. GF mice were maintained under ABX treatment as described above to limit microbial contamination. All surgically injected animals underwent histological examination to ensure the tracers were correctly injected.
Brain sample collection for c-Fos staining
All brain samples for c-Fos expression were collected one hour after the reciprocal social interaction test. Mice were anaesthetized by intraperitoneal injection with a mixture of 100 mg/kg ketamine and 10 mg/kg xylazine. The mice were then perfused via the cardiovascular system with PBS followed by 4% paraformaldehyde (Electron Microscopy Sciences). Brains were removed and post-fixed in 4% paraformaldehyde for 3–5 days at 4 °C. The brains were kept in PBS with 0.02% sodium azide at 4 °C until sectioning.
Brain sectioning and immunohistochemistry
The brains were embedded in 4% UltraPure low melting point agarose (ThermoFisher) and were coronally sectioned by vibratome (VT1000S; Leica) at a thickness of 50 μm, with the exception of the brain sections for Fig. 1, which were sectioned at a thickness of 100 μm. Brain sections of 50 μm were collected and stained every 0.15 mm. Brain sections of 100 μm were collected sequentially and stained entirely. The brain sections were stored free-floating in PBS with 0.02% sodium azide at 4 °C until staining.
Free-floating sections were incubated with primary antibody in blocking solution (10% horse serum, 0.1% triton X-100, and 0.02% sodium azide in PBS) overnight at room temperature. The next day, sections were incubated with fluorescence-conjugated secondary antibody for 1.5–2 h at room temperature. Between each step and after secondary antibody staining, sections were thoroughly washed with PBS or PBS with 0.1% triton-X-100 at least three times for 5 min each. The stained free-floating sections were then mounted onto Superfrost Plus microscope slides (Fisher Scientific) in PBS. Excess PBS from adhered sections was carefully removed. Slides were dried at room temperature for 2–5 min. ProLong Diamond anti-fade mountant with DAPI (150–200 μl; ThermoFisher Scientific) was applied to the slides before placing the coverslip. The slides were immersed in mountant overnight before imaging.
Primary antibodies and their dilutions were: goat anti-c-Fos (1:250; SC-52; Santa Cruz), mouse anti-NeuN (1:1,000; MAB377; Millpore Sigma), rabbit anti-oxytocin (1:10,000; 20068; Immunostar), rabbit anti-vasopressin (1:2,000; 20069; Immunostar), and rabbit anti-fluorescent gold (1:1,000; AB153-I; EMD Millpore Sigma). The fluorescence-conjugated secondary antibodies were donkey anti-goat (1:1,000), donkey anti-rabbit (1:1,000), and donkey anti-mouse (1:1,000) (ThermoFisher Scientific).
Microscopic imaging and image analysis
Imaging was performed using a Zeiss LSM 800 inverted confocal laser scanning microscope (Carl Zeiss) with Zen software (Carl Zeiss). For Fig. 1e, i, and the DG in Extended Data Figs. 7, 8, confocal images were obtained by Z-stacks covering the entire Z-axis range of the sections. The interval for each focal plane was 2 μm. The images were then projected in the visualization plane with maximum intensity voxels by maximum intensity projection using Zen software. In addition, the DG and PVN for Fig. 1e, i were imaged in tiled images covering the entire brain area using Zen software. For other images shown in this study, confocal images were captured in single plane with the highest intensity of DAPI. A 20× objective lens was used for all images, except those in Fig. 1, which were taken using a 10× objective lens. c-Fos-, oxytocin-, vasopressin-, CTB-488-, and Fluorogold-positive cells were quantified using a manual cell counter in ImageJ software (NIH). All images were minimally processed with brightness and contrast adjustment. The adjustment was applied equally across the entire image and consistent in the corresponding controls. Regions of interest were selected by a segmented line based on the anatomical features of each region. The final number of positive cells reported was averaged from multiple images.
Coordinates for adBNST imaging were from anterior to posterior (AP) +0.38 mm to +0.26 mm, (DV) 4.00 mm to +4.50 mm relative to bregma (bilateral). Coordinates for PVN imaging were from anterior to posterior (AP) −0.70 mm to −0.94 mm relative to bregma (bilateral). Coordinates for DG imaging were from anterior to posterior (AP) −1.58 mm to −1.94 mm relative to bregma (bilateral). Coordinates for BLA imaging were from anterior to posterior (AP) −1.06 mm to −2.06 mm relative to bregma (bilateral). Coordinates for LS imaging were from anterior to posterior (AP) +0.98 mm to +0.86 mm relative to bregma (bilateral). Coordinates for MeA imaging were from anterior to posterior (AP) −1.46 mm to −1.94 mm relative to bregma (bilateral). All coordinates and diagrams were based on the Paxinos and Franklin atlas33 (Extended Data Fig. 1r).
Quantification of Fluorogold-positive cells in PVN and ME
Confocal images were converted from czi format to jpeg format, and uploaded to ImageJ. Images were smoothed and edges were accentuated to sharpen cellular shape. Brightness and contrast were adjusted to enhance contrast and reduce non-cellular background fluorescence. Images were made binary (16-bit), yielding black and white images in which cells, previously defined by their edges, were white and the rest of the image was black. Images were subjected to a threshold to separate cells from background. The threshold was decided to be that at which cells appeared either partially or completely red when the image was run through the threshold function in the program. Application of this threshold yielded cells completely separate from the background. The Wastershed, Despeckle, and Fill Holes functions were applied selectively and as needed to divide cells that may have been merged together following binarization, to reduce false positive cells by removing minuscule specks that met threshold, and to close gaps of white space within cells, respectively. The following measurements were programmed to be calculated: ‘Area’, ‘Min and Max Gray Value’, ‘Integrated Density’, and ‘Mean Gray Value.’
For the PVN: the polygon line tool was used to outline regions of interest. Original confocal images were referenced to ensure accurate outlining. Particles were quantified by an automatic counter that enumerated cells within the outline. Results were given as an image with numbered cells in the region of interest and a table displaying quantification of that image (for example, cell count, total area, average size of cell, percentage area that cells take up, mean grey value, and integrated density). Cell count value was used in the quantification of PVN images. For the ME, the rectangle tool was used to outline a square of known area within an arbitrary part of the median eminence. The same area was applied to other images of the ME at approximately the same part of the ME. Integrated density was calculated for that area. Integrated density was used as a proxy for measuring fluorescence intensity.
Faecal microbiota transplant
GF recipient mice were colonized with gut bacteria from SPF donors (exGF) at 4 weeks of age and from ABX-treated donors (AVM, AVNM) at 8 weeks of age. The social behaviour test was performed at 10–15 weeks of age. The faecal samples collected were immediately homogenized in pre-reduced sterilized PBS. Oral gavage was used to give 100 μl of the settled suspension to GF recipient mice.
Mouse faecal sample collection and microbial DNA extraction
Frozen mouse faecal samples were stored at −80 °C until DNA extraction at Laragen. 16S sequencing was performed at Laragen, using an in-house validated protocol. In brief, DNA was extracted using a bead-based method with a proprietary extraction buffer validated against mock community controls. Samples were lysed using Tissuelyser II (Qiagen) and DNA was purified by magnetic beads using the Kingfisher Flex System (ThermoFisher Scientific). Subsequently, 16S sequencing was performed according to the Earth Microbiome Project 16S V4 protocol (https://earthmicrobiome.org/protocols-and-standards/16s/).
16S rRNA gene sequencing and data analysis
Demultiplexed sequencing outputs from 2 × 150 bp V4 16S rRNA gene sequencing using Illumina MiSeq were obtained from Laragen and analysed using the QIIME2 software package38. We obtained 55,290.5 ± 2,427.52 (mean ± s.e.m.) reads for vehicle-treated samples, 8,218.1 ± 5,508.82 reads for AVNM-treated samples, and 2,045.8 ± 660.83 reads for negative controls. Paired reads were joined by q2-VSEARCH39. Subsequently, reads were quality filtered and denoised using q2-Deblur40 with left_trim_len = 20, trim_length = 229 to obtain an operational taxonomic unit (OTU) table and representative sequences. Subsequently, a tree was generated using phylogenetic placement of sequences with SEPP into the GreenGenes reference database41 using q2-fragment-insertion42. Taxonomic assignment for each sOTU was obtained by a Naive-Bayes classifier as implemented in q2-feature-classifier43. Lastly, Alpha (observed speices and Faith’s phylogenetic diversity) and Beta diversity (UniFrac44) metrics were calculated using QIIME2. Hypothesis testing for differences in Alpha diversity were performed using the Kruskal–Wallis test and differences in Beta diversity were tested using PERMANOVA, as implemented in QIIME2. Raw data were deposited in ENA under BioProject PRJNA632893.
Isolation and characterization of enterococcal candidate bacterium
Faecal pellets were taken from mice that received faecal microbiota transplants from AVNM- or AVM-treated mice. Pellets were maintained on ice for the duration of sample collection (approximately 20 min). Under anaerobic conditions, pellets from each group were then pooled and weighed. Pre-reduced PBS with 1.5% sodium bicarbonate was added at 10 μl PBS + NaHCO3 per 1 mg faeces. Faeces were mashed and faecal contents completely resuspended using a sterile P1000 pipette tip, vortexed vigorously, and allowed to settle for 1–2 min. Supernatant was used to inoculate chopped meat medium (Hardy Diagnostics; AG21H) and incubated anaerobically at 37 °C for five days. Growth differences between groups (that is, turbidity) were evident in the cultures. One hundred microliters of each meat broth culture was streaked onto Brucella blood agar plates (Teknova) and incubated anaerobically for three days at 37 °C, after which noticeable morphological differences were evident. Single colonies were selected and re-streaked to confirm purity, and colony PCR and sequencing were performed for each isolate (Laragen) using universal 16S primers: 16S forward 5′- AGAGTTTGATCMTGGCTCAG-3′, reverse 5′-GGTTACCTTGTTACGACTT-3′. Glycerol stocks (30% glycerol) of isolates were stored at −80 °C.
Adult colonization of ABX mice with E. faecalis
Gut microbiota were depleted in adult C57BL/6J male mice (8–12 weeks) by treatment with ABX for 3 weeks as described above. Three weeks after ABX treatment, mice were given 6 inoculums of 1 × 10⁸ CFU each of E. faecalis (ATCC 19433) by oral gavage (2× per week). ABX water was replaced by sterilized regular drinking water during the period of gavage with E. faecalis. Control ABX-treated mice and vehicle-treated mice were given 6 oral gavages with 1.5% sodium bicarbonate in PBS (control buffer), which was the same buffer used for E. faecalis gavage. The reciprocal social interaction tested was performed before (first) and after gavage with E. faecalis or control buffer (second) (Fig. 4h). The subject mouse was placed in a novel sterilized cage without bedding for a five-minute acclimation period. After the second social interaction test, mice were left in the testing cage for one hour before blood collection. Cardiac puncture blood collection was performed one hour after social interaction. Bacterial genomic DNA from faecal samples was isolated using a commercial kit (Quick-DNA fecal microbe kits, Zymo Research) following the manufacturer’s instructions, and the relative densities of bacteria were determined by qPCR using E. faecalis-specific primers: forward 5′- CCCTTATTGTTAGTTGCCATCATT-3′, reverse 5′- ACTCGTTGTACTTCCCATTGT-3′.
Perinatal colonization of mice with enterococcal isolate
Three-week old C57BL/6J germ-free male and female mice were mono-colonized with our enterococcal isolate and set up as breeding pairs. Colonization was confirmed by plating faeces on Brucella blood agar plates (Teknova) and PCR of faecal DNA using 16S primers. Offspring from these colonized animals were reared and maintained in a gnotobiotic isolator into adulthood. At 10–11 weeks of age, male offspring were transferred out of the isolator and single-housed in standard, autoclaved cages (Lab Products) for 1 week. After 1 week, social behaviour was tested and tissues (brain, serum, faeces) were collected using the methods described above.
Faecal DNA extraction for digital PCR anchoring for AVM donors and recipients
DNA was extracted from all samples by following the Qiagen DNeasy Powersoil Pro Kit protocol (Qiagen). Bead-beating was performed with a FastPrep-24 (MP Biomedicals) Instrument for 1 min at 6.5 m/s. To ensure extraction columns were not overloaded, we used ~30–50 mg of stool as input. The elution volume was 100 μl. Stool from germ-free mice and extraction blanks were included to assist in the interpretation of low-abundance samples from antibiotic-treated mice. All samples were stored at −80 °C before downstream processing.
Absolute abundance of 16S rRNA for AVM donors and recipients
Absolute taxon abundances were calculated as described previously29,45,46. In brief, the total 16S rRNA gene copies per sample were measured using the Bio-Rad QX200 droplet dPCR system (Bio-Rad Laboratories). The dPCR mix contained the following: 1× EvaGreen Droplet Generation Mix (Bio-Rad), 500 nM forward primer and 500 nM reverse primer45. Universal primers were modified from the standard 515F-806R primers. Thermocycling was performed as follows: 95 °C for 5 min, 40 cycles of 95 °C for 30 s, 52 °C for 30 s, and 68 °C for 30 s, with a dye stabilization step of 4 °C for 5 min and 90 °C for 5 min. All ramp rates were 2 °C per second. Enterococcus-specific primers47 followed similar thermocycling conditions, except that the annealing temperature was set to 60 °C.
Concentrations of 16S rRNA gene per microlitre of extraction were corrected for elution volume and losses during extraction before normalizing to the input sample mass (equation (1)29).
| (1) |
Absolute abundance measurements of individual taxa were calculated either by dPCR with taxon-specific primers or by multiplying the total microbial load from equation (1) by the relative abundance from 16S rRNA gene amplicon sequencing. The lower limit of quantification (LLOQ) was defined by back-calculating (using equation (1)) the microbial load from a dPCR reading of 5 copies per μl and assuming a sample mass equal to the average sample mass input.
16S rRNA gene amplicon sequencing for absolute abundances for AVM-treated donors and recipients
Amplicon libraries were generated as described previously29,45,46. The variable 4 (V4) region of the 16S rRNA gene was amplified in duplicate with the following PCR reaction components: 1× 5Prime Hotstart mastermix, 1× Evagreen, 500 nM forward primer, and 500 nM reverse primer. Amplification was monitored in a CFX96 RT–PCR machine (Bio-Rad) and samples were removed once fluorescence measurements reached ~10,000 RFU (late exponential phase). Cycling conditions were as follows: 94 °C for 3 min, up to 45 cycles of 94 °C for 45 s, 54 °C for 60 s, and 72 °C for 90 s. Duplicate reactions that amplified were pooled together and quantified with Kapa library quantification kit (Kapa Biosystems, KK4824) before equimolar sample mixing. Libraries were concentrated and cleaned using AMPureXP beads (Beckman Coulter). The final library was quantified using a High Sensitivity D1000 Tapestation (Agilent) chip. Sequencing was performed by Fulgent Genetics using the Illumina MiSeq platform and 2 × 300-bp reagent kit for paired-end sequencing.
16S rRNA gene amplicon data processing for AVM donors and recipients
Processing of all sequencing data was performed using QIIME 2 2019.148. Raw sequence data were demultiplexed and quality filtered using the q2-demux plugin followed by denoising with DADA249. All samples were rarefied to the read depth of the sample with the minimum number of reads. Taxonomy was assigned to amplicon sequence variants (ASVs) using the q2-feature-classifier43 classify-sklearn naïve Bayes taxonomy classifier against the Silva50 132 99% OTUs references from the 515F/806R region. All data sets were collapsed to the genus level before downstream analyses. All downstream analyses were performed in IPython primarily through use of the Pandas, Numpy, Seaborn and Scikit-learn libraries. Two independent cohorts of AVM and AVNM donors and recipients were conducted in this study. Initially, we found that Enterococcaceae family was presented in only one cohort of AVM-treated donors (Fig. 4f) but not found in another cohort of AVM donors. This finding prompted us to investigate whether the distinct Enterococcus family was present in the AVM recipients. Notably, we found that Enterococcus genus was present in both set of AVM recipients. Therefore, the two cohorts of data from AVM recipients were compiled to generate Fig. 4g and Extended Data Fig. 10b–d.
Behaviour testing
All behaviour tests were performed at 8–16 weeks of age. Only male, sexually naive mice were used in this study to avoid the confounding effect of oestrous cycle, except for Extended Data Fig. 1k. All behaviour tests were conducted in standard sterilized cages. Cage bedding was not changed for three days before behavioural testing. Mice were acclimated to the testing room for at least 30 min before all behaviour tests.
Reciprocal social interaction.
RSI is a widely-used task that tests social activity towards another novel animal. Two strategies were adopted in this study. For the experiments not involving survival surgery, mice were group housed and isolated for 4–8 h before testing. The subject mouse was placed in a novel sterilized cage with bedding for a two-minute acclimation period. A same-sex, same strain, sexually naive, novel (stranger) mouse of similar age was introduced into the cage. All interactions between the two mice were video recorded for five minutes. For the experiments involving survival surgery, all mice were single-housed in accordance with IACUC protocols. On the day of behaviour testing, a novel mouse of similar age was introduced into the subject’s cage. All interactions between the two mice were video recorded for five minutes. Minimal aggressive behaviours were observed. Each novel mouse was used for testing up to two times per day. Subject mice undergoing repeated testing throughout the experiment were confronted with a novel mouse each time. The following social investigation behaviours constituted ‘social activity’ and were scored as such: anogenital sniffing, nose-nose sniffing, active approach, and push under/crawl. The following solitary behaviours during social interaction constituted ‘non-social activity’ and were scored as such: self-grooming, digging, and rearing. All behaviours were analysed using ETHOM software51.
Three-chamber social test.
This test was performed in a 40 (width) × 60 (length) × 20 (height)-cm Plexiglass box divided equally into three chambers by transparent walls made by Plexiglas with opening doors (10 cm width × 7 cm height). The procedure consists of two consecutive phases–habituation and sociability. In the habituation phase, test mice were placed in the centre of the social chamber for 10 min and allowed to freely explore each compartment. In the sociability phase, test mice were enclosed in the centre compartment with the doors closed. Two inverted steel wire cups were placed in each of the two side chambers. An unfamiliar, strain-, age- and sex- matched mouse was placed in one of the inverted wire cups. The other inverted wire cup represented a novel object. After setting up, doors were opened simultaneously, and the test mouse was allowed to investigate the chamber for 10 min. The behaviour was recorded with a video camera mounted above the apparatus. Ethovision (Noldus Information Technology) was used to analyse the time spent by the mouse in each chamber, frequency entering each chamber, and distance travelled in each phase.
Novel cage behaviour.
This is a widely-used test for measuring non-social activity in a novel environment. The subject mouse was placed in an unused, sterilized cage. Non-social activity was video recorded for 5 min. The following solitary behaviours during social interaction constituted ‘non-social activity’ and were scored as such: self-grooming, digging, and rearing. All behaviours were analysed using ETHOM software51.
Open-field test.
The open-field test is a widely used task that tests anxiety and general locomotion. The open-field apparatus is a square open arena (50 × 50 cm) bordered by opaque plastic walls. Each mouse was placed into the arena along the interior wall and behaviour was recorded for 60 min. The centre zone (17 × 17 cm) was defined as the middle of the open-field chamber. Behaviour in the open field was recorded by a video camera mounted over the arena. Ethovision (Noldus Information Technology) was used to analyse the number of entries to, and the duration in, the centre zone. Open-field chambers were cleaned with 70% ethanol followed by Rescue disinfectant (Virox Technologies) between subjects.
Olfactory habituation/dishabituation.
This test is widely used to assess a subject mouse’s ability to discriminate a novel odour from a familiar odour after repeated exposure. The mouse is repeatedly presented with the same odour and habituates to it, and distinguishes it from a novel odour that the animal has never been exposed to previously. A subject mouse was acclimated to a sterilized cotton applicator in a new sterilized cage without bedding during habituation to the testing room. The cotton applicator was inserted into the cage grid and fixed by a weigh dish. The cage lid was intact during the test. Odours were presented in the following order: water, almond extract (McCormick), banana extract (McCormick), C57BL/6J cage odour and BTBR cage odour (002282; Jackson Laboratory). The neutral (water) and non-social odours (almond, banana) were obtained by dipping the tip of cotton applicator into the solution. The social odours (C57BL/6J cage, BTBR cage) were obtained by swiping the used cage bottom in a zigzag fashion several times. Each odour was presented in triplicate for two minutes per trial. The inter-trial interval was one minute. After each trial, the used cotton applicators were placed in a closed container to prevent cross-trial contamination. The observer was seated a distance away from the testing area to avoid disturbing the mouse. Olfactory investigation behaviour was defined as the mouse orienting towards the cotton tip with its nose close to the tip. The behaviour was scored using a stopwatch to record the total time spent sniffing.
Statistical analysis
All data are represented as mean ± s.e.m. A two-tailed unpaired t-test was used to compare data between two independent groups. A two-tailed paired t-test was used to compare data from the same animal before and after treatment. A one-tailed paired t-test was used to compare data from the same animal staying in the mouse chamber and object chamber for the three-chamber social test. Data with more than two independent groups were analysed by one-way ANOVA with Bonferroni’s multiple comparison post hoc test. Data with two factors were analysed by two-way ANOVA with Bonferroni’s multiple comparison post hoc test. All data were analysed using Prism (Graphpad). A P value was used to define the significance of differences between groups. When P was smaller than 0.05, the groups were considered different. The number of biological replicates and statistical methods are listed in the figure legends. P values or asterisks indicate differences in the figures. See Supplementary information for more details on statistical tests and exact P values for each figure.
Extended Data
Extended Data Fig. 1 |. Social behaviours, non-social activity, c-Fos expression and corticosterone levels in GF and/or ABX-treated mice.

a–c, Social activity in SPF and GF test mice (subject), in the context of SPF (a) or GF (b) novel mice. a, Anogenital sniff ****P < 0.0001, nose–nose sniff ****P < 0.0001, active approach ***P = 0.0003, push-crawl **P = 0.0055; b, anogenital sniff ****P < 0.0001, nose–nose sniff **P = 0.003, active approach **P = 0.0023; c, novel mouse effect P = 0.1133 (data from Fig. 1b, c). n = 20 SPF, 19 GF (vs SPF); 8 SPF, 8 GF (vs GF) mice. d, e, Social activity in vehicle (VEH)- and ABX-treated test mice (subject), in the context of SPF (d) or ABX-treated (e) novel mice. d, Anogenital sniff ***P = 0.0005, nose–nose sniff **P = 0.0028, active approach ***P = 0.0004, push-crawl P = 0.4601. n = 26 mice per group. e, P = 0.7039, n = 10 VEH, 9 ABX mice. f, Non-social activity in the reciprocal social interaction (RSI) paradigm in SPF, GF and ABX-treated mice (subject), in the context of SPF or GF novel mice. GF vs SPF novel mouse: P = 0.8086, n = 20 SPF, 19 GF mice. GF vs GF novel mouse: P = 0.1205, n = 8 mice per group. ABX vs SPF novel mouse: P = 0.5044, n = 26 mice per group. g, Non-social behaviour in a novel cage without the presence of a novel mouse. Grooming P = 0.482, digging P = 0.8689, rearing P = 0.4608 or total P = 0.1743. n = 8 SPF, 10 GF mice. h, Timeline schematic of guide cannula stereotaxic surgery, intracerebroventricular (ICV) injection of vehicle, ampicillin (A) and metronidazole (M), social behaviour, and sample collection. Social activity was tested in SPF mice injected ICV with antibiotics (subject), in the context of SPF novel mice. Social activity P = 0.5294, nose-to-nose P = 0.1784, nose-to-tail P = 0.4477. n = 12 mice per group. i, j, Timeline schematic of intraperitoneal (i.p.) injection of vehicle, ampicillin and metronidazole, open-field (OF) test, social behaviour, and sample collection. RSI (i) and open-field (j) test were tested in antibiotic-injected SPF mice (subject), in the context of SPF novel mice. Social activity P = 0.5583 (i); locomotion P = 0.3705 (j). n = 6 VEH, 4 ampicillin, 6 metronidazole mice. k, Social activity was tested in SPF, GF, VEH-treated and ABX-treated female mice (subject), in the context of SPF female novel mice. GF **P = 0.0053 and ABX *P = 0.0191. n = 10 SPF, 9 GF, 5 VEH, 5 ABX mice. l, The length of isolation shown in Fig. 1b did not affect social activity in GF or SPF controls. Microbiota effect ****P < 0.0001. n = 4 SPF (4–5 h), 7 SPF (5–6 h), 5 SPF (6–7 h), 2 SPF (7–8 h), 5 SPF (8–9 h), 10 GF (4–5 h), 3 GF (5–6 h), 4 GF (6–7 h), 6 GF (7–8 h), 4 GF (8–9 h) mice (data from Fig. 1b, c). m, Age of GF mice had no effect on social activity. P = 0.379. n = 6 (11–12 w), 5 (13 w), 8 (14–15 w) GF mice (data from Fig. 1b,d). n–q, The distance travelled and social activity in the three-chamber social test for SPF and GF male mice (n, o) and VEH- and ABX-treated mice (p, q), in the context of SPF novel mice. n = 9 SPF, 10 GF, 10 VEH, 10 ABX mice. Distance moved in the sociability phase (n, GF **P = 0.0047; p, ABX P = 0.1246), time in chamber (o, left, SPF mouse (M) vs object (O) ****P < 0.0001, GF M vs O ***P = 0.0005; q, left, VEH M vs O P = 0.1220, ABX M vs O **P = 0.0063), and frequency entering chamber (o, right, SPF M vs O P = 0.1420, GF M vs O P = 0.0872; q, right, VEH M vs O P = 0.2194, ABX M vs O ***P = 0.0008). n = 9 SPF, 10 GF, 10 VEH, 10 ABX mice. r, Left, schematic of brain regions with high c-Fos expression after RSI (relevant to Fig. 1e–l). Right, representative images (from 6 SPF, 6 GF, 5 VEH, 5 ABX mice) of c-Fos staining in BLA in SPF, GF, VEH, and ABX after RSI. Scale bars, 200 μm. s, Quantification of c-Fos+ cells in BLA of GF and ABX mice. SPF vs GF P = 0.1014, VEH vs ABX P = 0.1095. n = 6 SPF, 6 GF, 5 VEH, 5 ABX mice. t, Quantification of c-Fos+ cells in various brain regions of SPF and GF mice. PVN P = 0.4239, adBNST P = 0.2571, DG P = 0.0818, BLA P = 0.2552. n = 5 SPF, 6 GF mice. u, Serum corticosterone levels in ABX-treated mice at isolation (iso), 0 h and 1 h post-RSI. VEH: Iso vs 0 h #P = 0.0129, Iso vs 1 h ##P = 0.0027, 0 h vs 1hr ##P = 0.0023; ABX: Iso vs 0 h P = 0.0624, Iso vs 1 h ##P = 0.0016, 0 h vs 1 h ##P = 0.0062. n = 5 mice per group. v, Serum corticosterone levels after novel cage exposure in GF and ABX-treated mice. ABX vs GF **P = 0.0085, SPF vs GF *P = 0.0125. n = 11 VEH, 11 ABX, 5 SPF, 4 GF mice. w, x, Serum corticosterone levels at different times of death in SPF and GF (w) and VEH and ABX mice (x) tested in Fig. 1m–o. GF ***P = 0.0005 (w), ABX **P = 0.0011 (x). w, n = 2 SPF (0–1 h), 5 SPF (1–2 h), 4 SPF (2–3 h), 4 SPF (3–4 h), 3 SPF (4–5 h), 9 GF (0–1 h), 3 GF (1–2 h), 4 GF (2–3 h), 6 GF (3–4 h), 4 GF (4–5 h) mice (data from Fig. 1m, n). x, n = 9 VEH (0–100 m), 17 VEH (100–200 m), 22 ABX (0–100 m), 4 ABX (100–200 m) mice (data from Fig. 1o). y, Social activity in SPF, GF and exGF test mice (subject), in the context of SPF novel mice. SPF vs GF ****P < 0.0001, SPF vs exGF ***P = 0.0001, GF vs exGF ****P < 0.0001. n = 20 SPF, 19 GF, 8 exGF mice (SPF and GF data from Fig. 1b, c). z, Serum corticosterone levels after RSI in exGF mice. SPF vs GF **P = 0.0012, GF vs exGF *P = 0.0467. n = 13 SPF, 18 GF, 8 exGF mice (SPF and GF data from Fig. 1b, c). Data shown as individual points with mean ± s.e.m. Data analysed by two-tailed unpaired t-test (a, b, d–g, k, n, p, s, t); one-tailed paired t-test (o, q); one-way ANOVA (i, j, m, y, z), repeated measures (h) with Bonferroni’s multiple comparison post hoc test; two-way ANOVA (c, l, v–x), repeated measures (u) with Bonferroni’s multiple comparison post hoc test. *P < 0.05, **P < 0.01, ***P < 0.001, ****P < 0.0001, ND: no difference. For more statistical details, see Supplementary Information.
Extended Data Fig. 2 |. The depletion of microbiota in GF and/or ABX-treated mice was demonstrated by absolute bacteria quantification, plating, microbiome analysis and profiling.

a, Bacterial DNA was detected using Femto DNA quantification methods. Bacterial DNA was completely absent from faecal samples collected from GF mice housed in closed IVC cages for one week (**P = 0.0038) and from adult mice treated with ABX for three weeks (**P = 0.0083). n = 4 mice per group. b, c, Colony-forming units (CFU) quantified by scoring colonies from faecal samples plated on brucella blood agar following three weeks ABX treatment. b, Aerobes were depleted at the first week of ABX treatment. VEH vs ABX: 1 w **P = 0.001, 2 w ***P = 0.0001, 3 w ****P < 0.0001. c, Anaerobes were completely depleted by the third week of ABX treatment. VEH vs ABX: 1 w P = 0.2237, 2 w *P = 0.0179, 3 w ****P < 0.0001. n = 4 mice per group. d, Representative images of caecum enlargement and brucella blood agar plating of caecal contents from VEH and ABX-treated mice. Plating of caecal contents showed that culturable bacteria were completely absent after 3 weeks of ABX treatment. e, f, Box plots of number of total reads (e) and total reads that matched sequences in 16S reference database (f) in VEH- and AVNM-treated mice, compared to negative controls. n = 8 VEH, 8 AVNM, 3 negative control. g, h, Box plots of alpha diversity as measured by number of observed ASVs (g) and Faith’s phylogenetic diversity (h) in VEH- and AVNM-treated mice, compared to negative controls. n = 8 VEH, 8 AVNM, 3 negative control. g, VEH vs AVNM ***P = 0.00093097; VEH vs negative control *P = 0.03169856. (h) VEH vs AVNM **P = 0.00113133; VEH vs negative control *P = 0.01430588. i, j, Principle coordinate analysis plots based on unweighted (i) and weighted (j) UniFrac distances between faecal samples from VEH- and AVNM-treated mice, compared to negative controls (rarified to 728 reads per sample). n = 8 VEH, 7 AVNM, 3 negative control. i, VEH vs AVNM ***P = 0.0002; VEH vs negative control **P = 0.0071. j, VEH vs AVNM ***P = 0.0005; VEH vs negative control **P = 0.0055. k, Relative abundance of major phyla in VEH- and AVNM-treated mice, compared to negative controls. n = 8 VEH, 7 AVNM, 3 negative control. i–k, One AVNM mouse was found to be contaminated and excluded for the generation of the graphs. Data shown as individual points with mean ± s.e.m. (a–c); box plots (e–h) show median (centre line) and interquartile range (IQR) (box limits); whiskers show either 1.5 × IQR of the lower and upper quartiles or range. Data analysed by two-tailed unpaired t-test (a); two-way ANOVA, repeated measures (b, c) with Bonferroni’s multiple comparison post hoc test; Kruskal–Wallis test (g, h); permutational multivariate analysis of variance (PERMANOVA) (i, j). *P < 0.05, **P < 0.01, ***P < 0.001, ****P < 0.0001, ND: no difference. For more statistical details, see Supplementary Information.
Extended Data Fig. 3 |. Anxiety-like behaviour, locomotion, water intake, and olfactory investigative behaviour in GF and/or ABX-treated mice.

a–h, Anxiety-like behaviour and locomotion were tested using the open-field test, light–dark box and elevated plus maze in SPF, GF, VEH-treated and ABX-treated mice. a, Locomotor activity measured in open-field test in GF mice showed no difference in distance travelled in open-field chamber. P = 0.8371. n = 9 SPF, 8 GF mice per group. b, Centre zone duration in open-field test in GF mice. GF mice spent longer in the centre of the open-field chamber than SPF mice. *P = 0.0108. n = 9 SPF, 8 GF mice per group. c, Light chamber duration measured in light–dark box for GF mice. GF mice spent longer in the light chamber than SPF mice. *P = 0.0442. n = 9 mice per group. d, Open arm duration measured in elevated plus maze for GF mice. GF mice spent longer in the open arm than SPF mice. *P = 0.0261. n = 9 mice per group. e, Locomotor activity measured in open-field test for ABX mice showed no difference in distance travelled in the open-field chamber. P = 0.3606. n = 10 mice per group. f, Duration in the centre zone measured in open-field test shows no difference in centre duration for ABX mice. P = 0.3372. n = 10 mice per group. g, Duration in the light chamber measured in light–dark box shows no difference in light chamber duration for ABX mice. P = 0.9381. n = 10 mice per group. h, Duration spent in open arm measured in elevated plus maze shows no difference in open arm duration for ABX mice. P = 0.8743. n = 10 mice per group. i, ABX mice show no change in the distance travelled in the open-field chamber. VEH vs ABX P = 0.6223. n = 15 mice per group. j, Water intake was monitored in GF mice housed in IVC cages for one week. GF mice showed no difference in water consumed. SPF vs GF P = 0.7591. n = 5 mice per group. k, The olfactory habituation/dishabituation test involves exposure to a series of odours: baseline (water), volatile non-social odours (almond and banana extracts), and social odours (C57BL/6 and BTBR cages). Time-course of sniffing time shows no difference for GF mice when exposed to water, almond extract, or banana extract. GF mice displayed increased sniffing time when exposed to the social odour from C57BL/6J mice, but not from BTBR mice. SPF vs GF: B6 Cage(1–1) *P = 0.0172, B6 Cage(1–2) *P = 0.0402. n = 10 SPF, 11 GF mice per group. l, Percentage investigation time in response to the first exposure to social odour was measured in the olfactory habituation/dishabituation test in SPF and GF mice. The percentage of investigation time decreased at the second and third exposures to the same social odour in both SPF and GF mice. The investigation time decreased when switched to BTBR odour in GF mice. SPF: B6 Cage 1–1 vs 1–2 **P = 0.0020, B6 Cage 1–1 vs 1–3 ***P = 0.0002, BTBR Cage 1–1 vs 1–2 ***P = 0.0002, BTBR Cage 1–1 vs 1–3 ****P < 0.0001; GF: B6 Cage 1–1 vs 1–2 *P = 0.0120, B6 Cage 1–1 vs 1–3 *P = 0.0397, BTBR Cage 1–1 vs 1–2 ****P < 0.0001, BTBR Cage 1–1 vs 1–3 ****P < 0.0001, B6 Cage 1–1 vs BTBR Cage 1–1 *P = 0.0143. n = 10 SPF, 11 GF mice per group. Data shown as individual points with mean ± s.e.m. Data analysed by two-tailed unpaired t-test (a–h) and two-way ANOVA, repeated measures (i–l) with Bonferroni’s multiple comparison post hoc test. *P < 0.05, **P < 0.01, ***P < 0.001, ****P < 0.0001, ND: no difference. For more statistical details, see Supplementary Information.
Extended Data Fig. 4 |. IEG expression in the brains of GF mice and stress-related gene expression in the hippocampus and hypothalamus of ABX-treated mice.
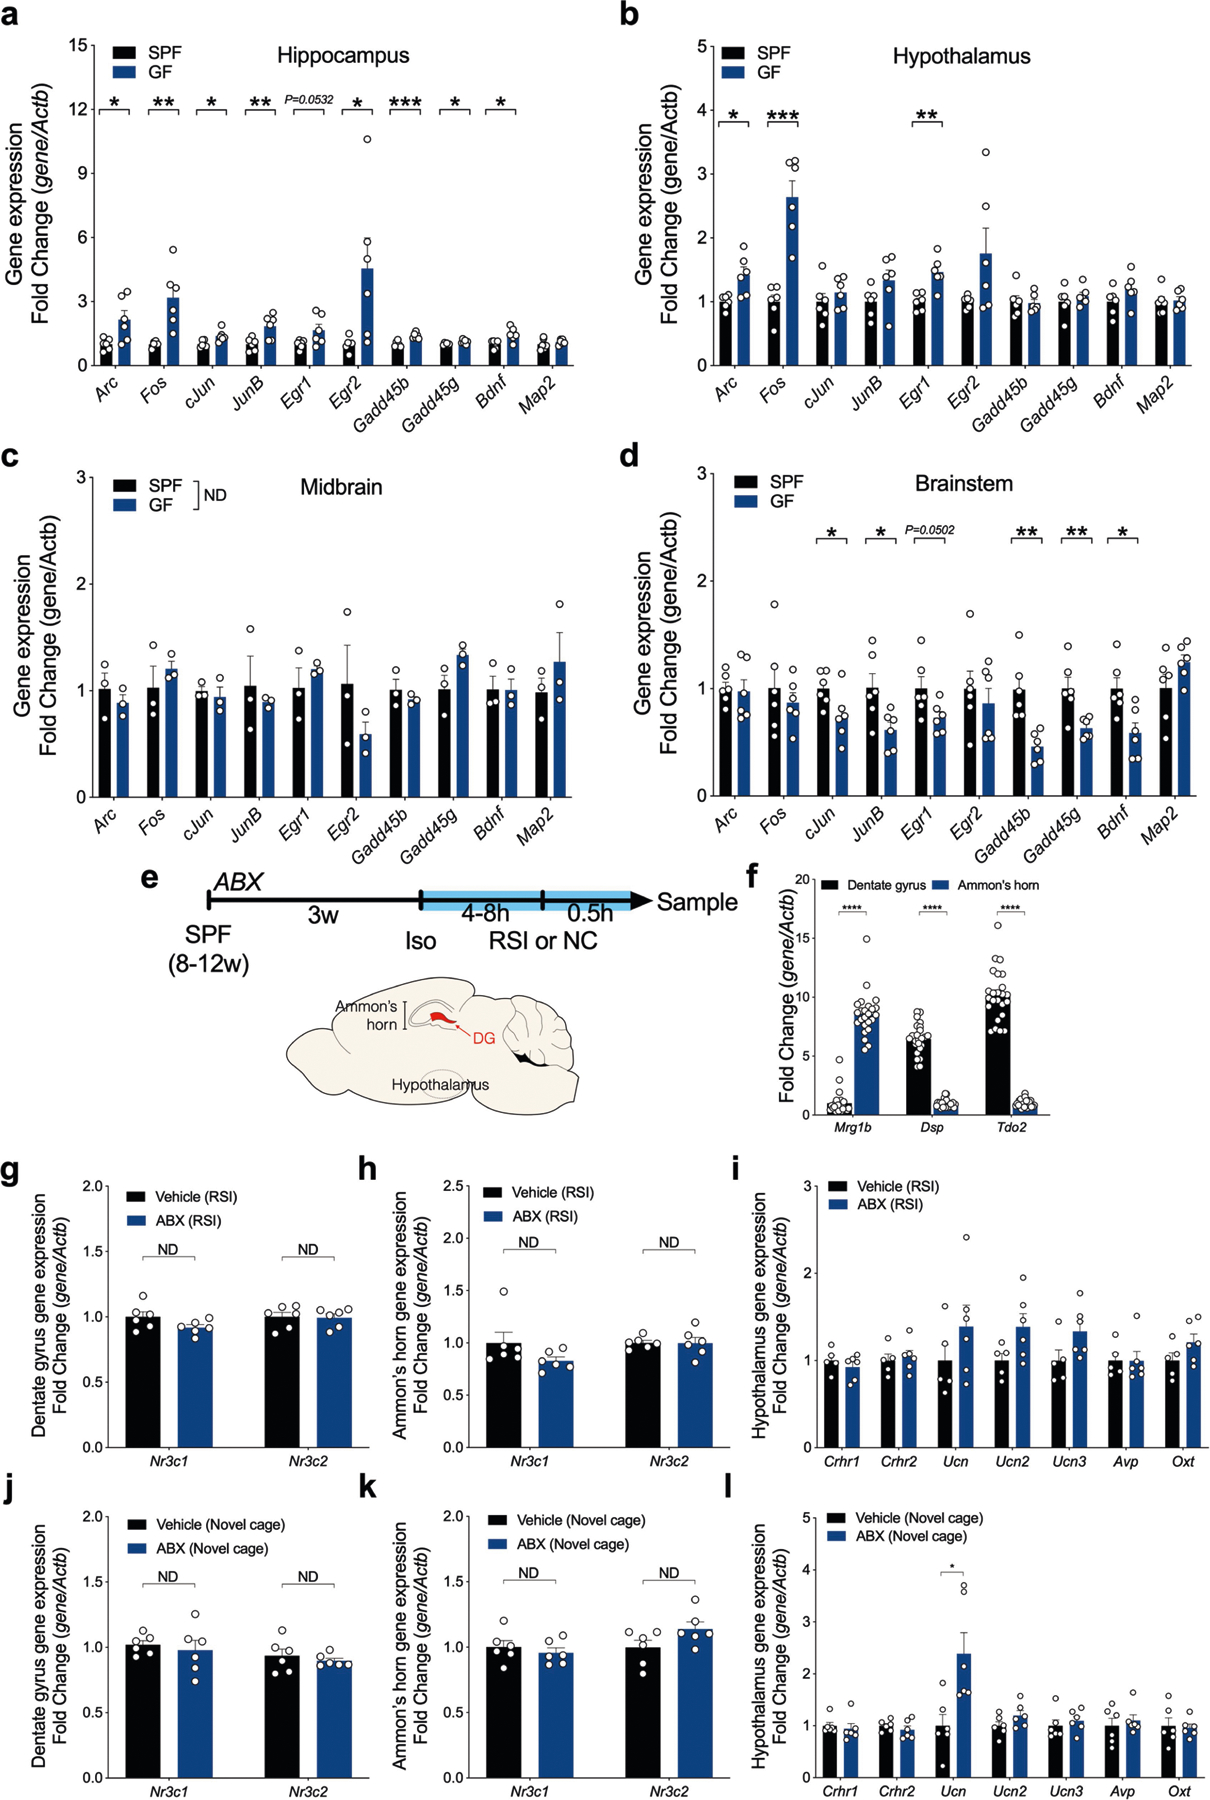
a–d, IEG expression was measured in GF mice taken from the isolator and temporarily mixed with other mice from different cages. SPF mice were sampled and handled following the same procedure. Mice were immediately killed and the brains were collected and analysed. Brains were dissected into hippocampus (a), hypothalamus (b), midbrain (c), and brainstem (d). IEG expression in each region was analysed by qRT–PCR. n = 6 mice per group. a, In the hippocampus, Arc (*P = 0.024), Fos (**P = 0.0036), cJun (*P = 0.0152), JunB (**P = 0.0077), Egr1 (P = 0.0532), Egr2 (*P = 0.0328), Gadd45b (***P = 0.0005), Gadd45g (*P = 0.0435), and Bdnf (*P = 0.0142) were upregulated in GF mice. Map2 P = 0.3874. n = 6 mice per group. b, In the hypothalamus, Arc (*P = 0.0108), Fos (***P = 0.0001), and Egr1 (**P = 0.0022) were upregulated in GF mice, with no change in Map2 gene expression. cJun P = 0.3859, JunB P = 0.106, Egr2 P = 0.0864, Gadd45b P = 0.8544, Gadd45g P = 0.4398, Bdnf P = 0.1517, Map2 P = 0.8255. n = 6 mice per group. c, No changes in IEG expression were found in the midbrains of GF mice. Arc P = 0.4733, Fos P = 0.455, cJun P = 0.6153, JunB P = 0.6154, Egr1 P = 0.4102, Egr2 P = 0.283, Gadd45b P = 0.424, Gadd45g P = 0.0852, Bdnf P = 0.9779, Map2 P = 0.4018. n = 3 mice per group. d, In the brainstem, cJun (*P = 0.0479), JunB (*P = 0.0244), Egr1 (P = 0.0502), Gadd45b (**P = 0.0022), Gadd45g (**P = 0.0075), and Bdnf (*P = 0.0127) were downregulated in GF mice. No change in Map2 was detected in all four brain regions in GF mice. Arc P = 0.8297, Fos P = 0.5208, Egr2 P = 0.5391, Map2 P = 0.1266. n = 6 mice per group. e, Timeline schematic of ABX treatment, single housing, behavioural manipulations, and tissue sampling. Tissues collected include hippocampal dentate gyrus (DG; red), hippocampal Ammon’s horn, and hypothalamus. f, Gene expression analysis in Ammon’s horn and DG was performed by qRT–PCR. Mgr1b is enriched in Ammon’s horn. Dsp and Tdo2 are specific to the DG. Analysis confirmed the specific dissection of the hippocampus into Ammon’s horn and DG. All ****P < 0.0001. n = 24 mice per group. g, h, Gene expression of glucocorticoid receptor (Nr3c1) and mineralocorticoid receptor (Nr3c2) in the hippocampus analysed by qRT–PCR. There was no difference between vehicle and ABX mice in DG (g, Nr3c1 P = 0.1016, Nr3c2 P = 0.8947) or Ammon’s horn (h, Nr3c1 P = 0.1379, Nr3c2 P = 0.9764) after RSI. n = 6 mice per group. i, Expression of stress-related genes (Crhr1 P = 0.4032, Crhr2 P = 0.6778, Ucn P = 0.2477, Ucn2 P = 0.0636, and Ucn3 P = 0.0797) and neuropeptide genes (Avp P = 0.9861 and Oxt P = 0.1445) were unchanged after reciprocal social interaction in ABX mice. n = 5 vehicle, 6 ABX mice per group. j, k, Expression of Nr3c1 and Nr3c2 does not differ between vehicle and ABX mice in DG (j, Nr3c1 P = 0.6206, Nr3c2 P = 0.5075) or Ammon’s horn (k, Nr3c1 P = 0.4873, Nr3c2 P = 0.0931) after novel cage exposure. n = 6 mice per group. l, Ucn gene expression is upregulated after novel cage exposure in ABX mice (*P = 0.013). Other stress-related genes (Crh1 P = 0.649, Crhr2 P = 0.3875, Ucn2 P = 0.1409, and Ucn3 P = 0.511) and neuropeptide genes (Avp P = 0.5809 and Oxt P = 0.8216) were unchanged. n = 6 mice per group. Data shown as individual points with mean ± s.e.m. Data analysed by two-tailed unpaired t-test (a–d, f–l). *P < 0.05, **P < 0.01, ***P < 0.001, ****P < 0.0001, ND: no difference. For more statistical details, see Supplementary Information.
Extended Data Fig. 5 |. Expression of oxytocin, vasopressin, and their receptors in the hypothalamus of GF mice and Fluorogold labelling of neurons in the PVN and median eminence (ME) of GF and/or ABX-treated mice.
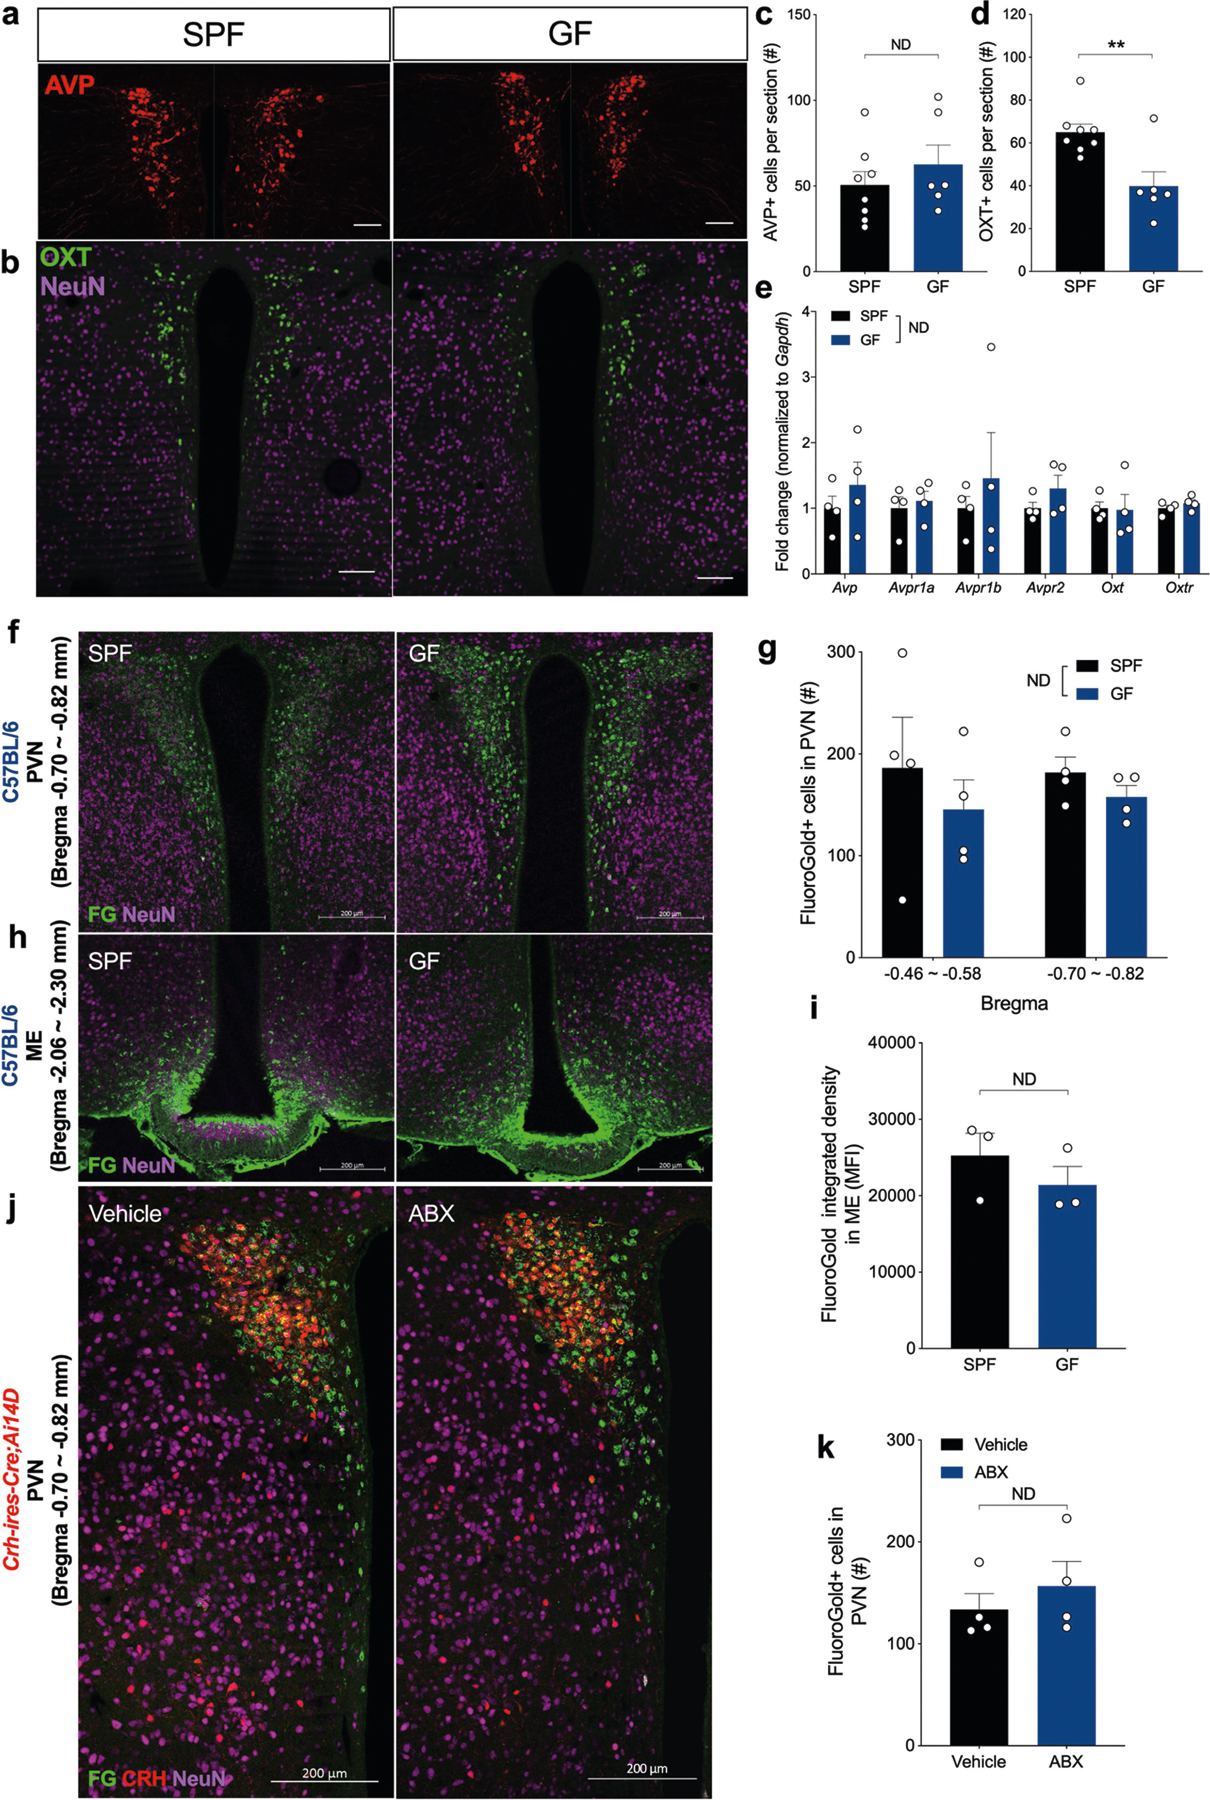
a, b, Representative images (from 8 SPF and 6 GF mice) of vasopressin (a, AVP; red) and oxytocin (b, OXT; green) staining in brain sections after reciprocal social interaction. Scale bars, 100 μm. c, d, Quantification of AVP (c) and OXT (d) distribution in PVN of SPF and GF mice. No difference in the number of AVP neurons in PVN was detected in GF mice (P = 0.3869). OXT-positive cells were lower in GF mice (**P = 0.0049). n = 8 SPF, 6 GF mice per group. e, Gene expression of AVP, OXT, and their receptors analysed by qRT–PCR. No difference was found between naive SPF and GF mice. Avp P = 0.3992, Avpr1a P = 0.6361, Avpr1b P = 0.5471, Avpr2 P = 0.2168, Oxt P = 0.9281, Oxtr P = 0.3252. n = 4 mice per group. f–i, GF and SPF mice were intraperitoneally injected with Fluorogold and killed six days later. PVN and ME were retrogradely labelled. f, Representative Fluorogold retrograde tracing and immunohistochemistry images of the PVN. Green, anti-Fluorescent Gold (Fluorogold); magenta: anti-NeuN. n = 4 mice per group. g, Number of Fluorogold+ cells in the PVN shows no difference between GF and SPF mice. SPF vs GF P = 0.2362. n = 4 mice per group. h, Representative Fluorogold retrograde tracing and immunohistochemistry images of the ME. Green: anti-Fluorescent Gold (Fluorogold); magenta: anti-NeuN. n = 3 mice per group. i, Integrated density of Fluorogold in the ME shows no difference between GF and SPF mice. P = 0.3723. n = 3 mice per group. j, k, ABX- or vehicle-treated Crh-ires-Cre;Ai14D mice were intraperitoneally injected with Fluorogold and killed six days later. PVN neurons were retrogradely labelled with Fluorogold. j, Representative Fluorogold retrograde tracing and immunohistochemistry images of the PVN. Green: anti-Fluorescent Gold (Fluorogold); red: corticotropin-releasing hormone (CRH); magenta: anti-NeuN. n = 4 mice per group. k, Number of Fluorogold+ cells in the PVN shows no difference between ABX and vehicle mice. P = 0.4545. n = 4 mice per group. Scale bars, 200 μm. Data analysed by two-tailed unpaired t-test (c–e, i, k) and two-way ANOVA, repeated measures (g) with Bonferroni’s multiple comparison post hoc test. **P < 0.01; ND: no difference. For more statistical details, see Supplementary Information.
Extended Data Fig. 6 |. Perturbation of glucocorticoid and vagus-dependent signalling in GF and/or ABX-treated mice.

a, b, Social activity was tested using the RSI paradigm in VEH-sham, ABX-sham, and ABX-ADX mice injected with corticosterone (subject), in the context of SPF novel mice. Acute administration of corticosterone produced no difference between groups in social activity (a, P = 0.5697) or non-social activity (b, P = 0.6781). n = 5 VEH-sham, 7 ABX-sham, and 4 ABX-ADX mice per group (subject only). c, d, Non-social activity was recorded using the RSI paradigm in SPF and GF (c), VEH-sham, ABX-sham, and ABX-ADX mice (d) (subject), in the context of SPF novel mice. c, Non-social activity was analysed during the social interaction test in SPF and GF mice injected with metyrapone. Equally decreased non-social activity was detected in GF and SPF mice injected with metyrapone. SPF-CMC vs SPF-MET *P = 0.041, GF-CMC vs GF-MET *P = 0.0274. n = 5 SPF-CMC, 5 GF-CMC, 6 SPF-MET, 5 GF-MET mice per group (subject only). d, Non-social activity was analysed during the social interaction test in VEH-sham, ABX-sham, and ABX-ADX test mice injected with CMC, RU-486, or metyrapone (subject), in the context of SPF novel mice. Lower non-social activity was detected in ABX-ADX animals injected with RU-486 and ABX animals injected with metyrapone. First CMC: VEH-sham vs ABX-sham **P = 0.0034; RU-486: VEH-sham vs ABX-ADX *P = 0.0215; MET: VEH-sham vs ABX-sham ***P = 0.0006, VEH-sham vs ABX-ADX *P = 0.0145. n = 11 mice for VEH-sham, 18 ABX-sham and 11 ABX-ADX sham mice per group (subject only). e, The completeness of subdiaphragmatic vagotomy (SDV) was validated by fasting-induced food consumption for 2 h following intraperitoneal CCK-8 injection. Food intake was normalized by body weight. SDV mice showed increased food intake compared to sham mice. SPF naive control vs SPF naive CCK-8 **P = 0.0038, ABX-sham CCK-8 vs ABX-SDV CCK-8 **P = 0.0084. n = 6 control saline, 6 control CCK-8, 7 ABX-sham, and 4 ABX-SDV mice per group. f, Measurement of serum corticosterone concentrations showed no difference after social interaction in ABX-SDV mice, compared to ABX-sham mice. P = 0.8436. n = 9 ABX-sham, 8 ABX-SDV mice per group. g, Quantification of c-Fos+ cells in anterodorsal bed nucleus of stria terminalis (adBNST) and dentate gyrus (DG) of ABX-sham and ABX-SDV mice. Increased c-Fos+ cells were detected in adBNST (left, *P = 0.0451), but not in DG (right, P = 0.2577), after social interaction in ABX-SDV mice, compared to ABX-sham mice. n = 5 sham, 5 SDV mice per group. Data shown as individual points with mean ± s.e.m. Data analysed by one-way ANOVA with Bonferroni’s multiple comparison post hoc test (a, b); two-way ANOVA (c), repeated measures with mixed effect (d), with Bonferroni’s multiple comparison post hoc test; two-tailed unpaired t-test (e–g). *P < 0.05, **P < 0.01, ***P < 0.001, ****P < 0.0001, ND: no difference. For more statistical details, see Supplementary Information.
Extended Data Fig. 7 |. Knockout of glucocorticoid receptors in specific brain regions in ABX-treated and SPF mice.

a, d, g Diagrams of virus injection into the DG (Nr3c1ΔDG; relevant to Fig. 2h, i), BNST (Nr3c1ΔBNST; relevant to Fig. 2j, k) and hypothalamus (Nr3c1ΔHYPO; relevant to Fig. 2l, m). b, e, h, Non-social activity recorded using the RSI paradigm in ABX mice (subject), in the context of SPF novel mice. b, No difference in non-social activity was detected in ABX Nr3c1ΔDG mice. Control vs Nr3c1ΔDG P = 0.1191. n = 7 mice per group (subject only). e, Minimal difference in non-social activity was detected in ABX Nr3c1ΔBNST mice. A decrease in non-social activity was detected only at the second CMC injection (*P = 0.0363). n = 7 mice per group (subject only). h, No difference in non-social activity was detected in Nr3c1ΔHYPO mice. Control vs Nr3c1ΔHYPO P = 0.0652. n = 6 control, 5 Nr3c1HYPO mice per group (subject only). c, Quantification of c-Fos+ cells in various brain regions of ABX Nr3c1ΔDG and control mice. Decreased c-Fos+ cells were detected in the PVN and adBNST after social interaction in ABX Nr3c1ΔDG mice compared to control mice. There was no change in c-Fos expression in the DG of ABX Nr3c1ΔDG mice. PVN ****P < 0.0001, adBNST **P = 0.0022, DG P = 0.9714. n = 7 mice per group. f, Quantification of c-Fos+ cells in various brain regions of ABX Nr3c1ΔBNST and control mice. Decreased c-Fos+ cells were detected in the PVN and adBNST after social interaction in ABX Nr3c1ΔBNST mice compared to control mice. There was no change in c-Fos staining in the DG. PVN ****P < 0.0001, adBNST ***P = 0.0002, DG P = 0.4187. n = 7 mice per group. i, Quantification of c-Fos+ cells in various brain regions of ABX Nr3c1ΔHYPO and control mice. Increased c-Fos+ cells were detected in DG and adBNST after social interaction in ABX Nr3c1ΔHYPO mice compared to control mice. There was no change in c-Fos expression in the PVN. PVN P = 0.1163, adBNST P = 0.0688, DG *P = 0.0389. n = 6 control, 5 Nr3c1ΔHYPO mice per group. j, Neuronal activity was measured by c-Fos staining of various brain sections. Representative images of c-Fos staining after social interaction in PVN, adBNST, and DG in Nr3c1ΔDG (from 7 animals each group), Nr3c1ΔBNST (from 7 animals each group) and Nr3c1ΔHYPO mice (from 6 control and 5 Nr3c1ΔHYPO animals), and their corresponding control groups. Scale bars, 100 μm. k, l, Social activity (k) and non-social activity (l) were tested using the RSI paradigm in SPF test mice (subject), in the context of SPF novel mice. SPF Nr3c1ΔDG mice did not display altered social activity (P = 0.4323) or non-social activity (P = 0.8234) compared to control mice with vehicle injection. n = 5 mice per group (subject only). m, Serum corticosterone concentrations show no change after social interaction in SPF Nr3c1ΔDG mice. P = 0.9935. n = 5 mice per group. n, o, Social activity (n) and non-social activity (o) were tested using the RSI paradigm in SPF test mice (subject) in the context of SPF novel mice. SPF Nr3c1ΔBNST mice showed reduced social activity compared to control mice with vehicle injection (*P = 0.0473). No change was observed in non-social activity between SPF control and Nr3c1ΔBNST mice (P = 0.4742). n = 5 mice per group (subject only). p, Serum corticosterone concentrations show no change after social interaction in SPF Nr3c1ΔBNST mice. P = 0.9312. n = 5 mice per group. q, r, Social activity (q) and non-social activity (r) were tested using the RSI paradigm in SPF test mice (subject), in the context of SPF novel mice. SPF Nr3c1HYPO mice did not display altered social activity (P = 0.1823) or non-social activity (P = 0.2339) compared to control mice with vehicle injection. n = 5 mice per group (subject only). s, Serum corticosterone concentrations show no change after social interaction in SPF Nr3c1ΔHYPO mice. P = 0.0701. n = 5 mice per group. Data shown as individual points with mean ± s.e.m. Data analysed by two-way ANOVA, repeated measures (b, e) with mixed effect (h) with Bonferroni’s multiple comparison post hoc test; two-tailed unpaired t-test (c, f, i, k–s). *P < 0.05, **P < 0.01, ***P < 0.001, ****P < 0.0001, ND: no difference. For more statistical details, see Supplementary Information.
Extended Data Fig. 8 |. Manipulations of CRH neurons and glucocorticoidsensing neurons in ABX-treated and SPF mice.
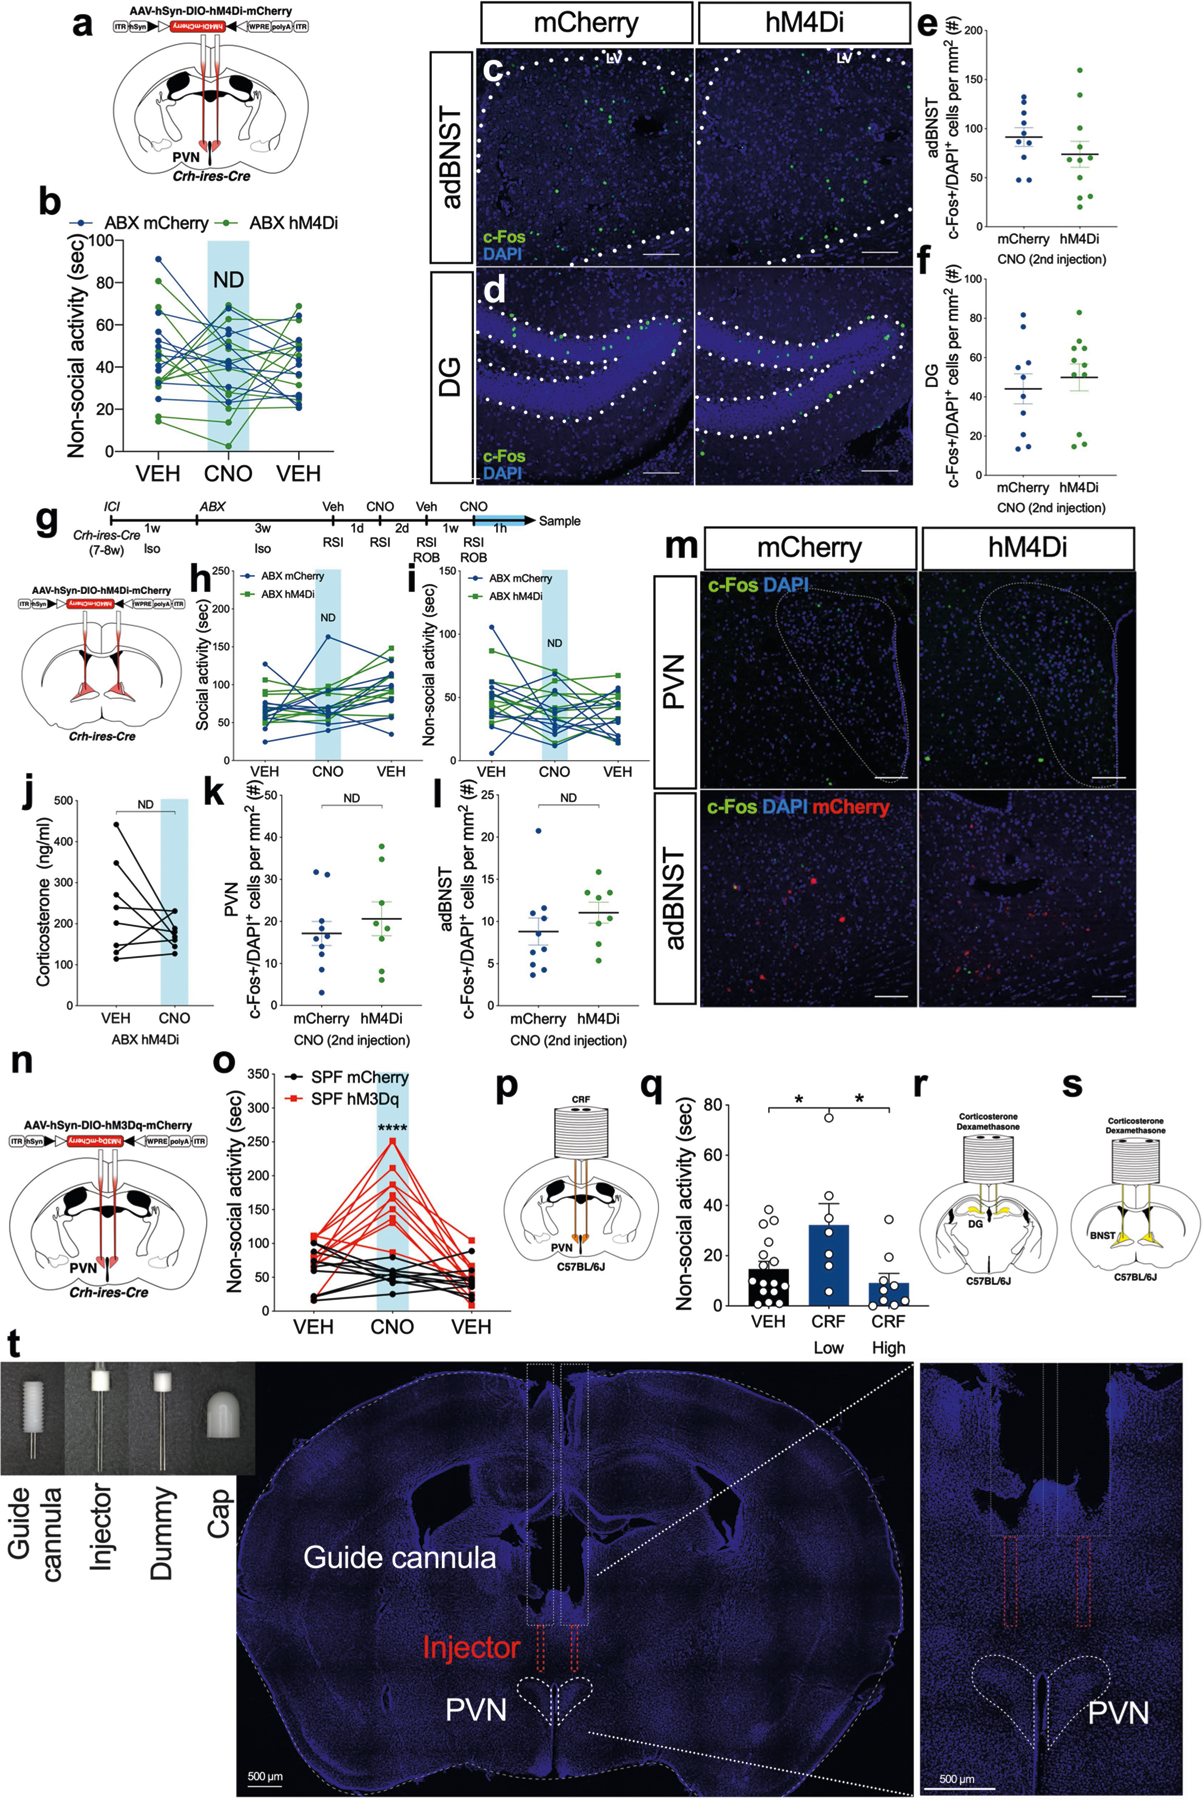
a, Diagram of AAV-hSyn-DIO-hM4Di-mCherry (hM4Di) or AAV-hSyn-DIO-mCherry (mCherry) virus injection into the PVN of Crh-ires-Cre mice. b, Non-social activity in ABX-treated mCherry and hM4Di mice, with and without CNO (subject). hM4Di effect P = 0.4909. n = 10 mCherry, 11 hM4Di mice. c, d, Neuronal activity was measured by c-Fos staining of brain sections. Representative images (from 10 mCherry and 11 hM4Di mice) of c-Fos, mCherry and DAPI staining in the adBNST (c) and DG (d) in hM4Di and mCherry mice upon CNO injection after social interaction. Scale bars, 100 μm. e, f, Quantification of c-Fos+ cells in various brain regions of ABX hM4Di and mCherry mice. There was no change in c-Fos in the adBNST (e, P = 0.301) or DG (f, P = 0.5745) of ABX hM4Di mice upon CNO injection. n = 10 mCherry, 11 hM4Di mice per group. g, Top, timeline scheme of stereotaxic surgery, ABX treatment, drug administration, social behaviour, and sample collection. Crh-ires-Cre mice were stereotaxically injected with viruses into the BNST one week before ABX treatment at the age of 7–8 weeks. After three weeks of ABX treatment, social behaviour was tested in VEH- or CNO-injected mice. Bottom, diagram of virus injection into the BNST of Crh-ires-Cre mice to deliver AAV-hSyn-DIO-hM4Di-mCherry (hM4Di) or AAV-hSyn-DIO-mCherry (mCherry). h, Social activity was tested using the RSI paradigm in ABX test mice (subject), in the context of SPF novel mice. With VEH and CNO injection, there was no difference in social activity between mice injected with hM4Di and mice injected with mCherry. mCherry vs hM4Di P = 0.4722. n = 10 mCherry, 9 hM4Di mice per group (subject only). i, Non-social activity was recorded using the RSI paradigm in ABX mice (subject), in the context of SPF novel mice. With VEH and CNO injection, there was no difference in non-social activity between mice injected with hM4Di and mice injected with mCherry at the BNST. mCherry vs hM4Di P = 0.1921. n = 10 mCherry, 9 hM4Di mice per group (subject only). j, Serum corticosterone concentrations show no change after social interaction in ABX hM4Di mice when injected with CNO. P = 0.2063. n = 8 mice per group. k, l, Quantification of c-Fos+ cells in various brain regions of ABX hM4Di and mCherry mice. No change in c-Fos+ cells was detected in the PVN (k, P = 0.4792) or adBNST (l, P = 0.3054) after social interaction in ABX hM4Di mice with CNO injection, compared to mCherry mice. n = 10 mCherry, 8 hM4Di mice per group. m, Neuronal activity was measured by c-Fos staining of brain sections. Representative images (from 10 mCherry, 8 hM4Di mice) of c-Fos, mCherry and DAPI staining in the PVN and adBNST of hM4Di and mCherry mice with CNO injection after social interaction. Scale bars, 100 μm. a–m, All mice received antibiotics. n, Diagram of AAV-hSyn-DIO-hM3Dq-mCherry (hM3Dq) or AAV-hSyn-DIO-mCherry (mCherry) injection into the PVN. o, Relevant to Fig. 3h–j. Non-social activity was recorded using the RSI paradigm in SPF mice (subject), in the context of SPF novel mice. With VEH injection, there was no difference in non-social activity between mice injected with AAV-hSyn-DIO-hM3Dq-mCherry (hM3Dq) and mice injected with AAV-hSyn-DIO-mCherry (mCherry). Injection of CNO increased non-social activity in hM3Dq mice but not mCherry mice. SPF mCherry CNO vs SPF hM3Dq CNO ****P < 0.0001. n = 10 mCherry, 11 hM3Dq mice per group (subject only). p, Relevant to Fig. 3k–m. Diagram of guide cannula implantation into the PVN to deliver VEH or CRF. q, Non-social activity was recorded using the RSI paradigm in SPF mice (subject), in the context of SPF novel mice. Injection of CRF (low) increased non-social activity, whereas injection of CRF (high) did not alter non-social activity compared to VEH mice. VEH vs CRF(low) *P = 0.0427, CRF(low) vs CRF(high) *P = 0.0134. n = 16 VEH, 7 CRF (low), 9 CRF (high) mice per group (subject only). r, s, Relevant to Fig. 3n–p. Diagram of guide cannula implantation into the DG (r) or BNST (s) to deliver VEH, CORT, or DEX. t, Relevant to Fig. 3k–m. Correct guide cannula implantation into the PVN was validated by histological sectioning and DAPI staining for visualization of the PVN to confirm CRF injection. The customized guide cannula set includes guide cannula, injector, dummy, and cap (left). The guide cannula was implanted 0.5 mm above the PVN. The tip of the guide cannula track can be visualized in the thalamus region in each implanted mouse. The injector was designed to reach 0.5 mm below the tip of the guide cannula. As the injector was made of 33G fine needle, the needle track of the injector was not visible in the brain slice and is depicted in the image (middle). Enlarged image to show the guide cannula track and the depicted needle track above the PVN (right). Scale bars, 500 μm. Data shown as individual points with mean ± s.e.m. Data analysed by two-way ANOVA, repeated measures (b, h, i, o) with Bonferroni’s multiple comparison post hoc test; two-tailed unpaired (e, f, k, l) or paired t-test (j); one-way ANOVA with Bonferroni’s multiple comparison post hoc test (q). *P < 0.05, ****P < 0.0001, ND: no difference. For more statistical details, see Supplementary Information.
Extended Data Fig. 9 |. Retrograde neural tracing of the PVN and adBNST of GF and ABX-treated mice.

a, CTB-488 was stereotaxically injected into the PVN of GF and SPF C57BL/6J mice. The brains were removed seven days after injection. CTB-488 retrograde tracing was visualized by confocal imaging of brain sections counterstained with an antibody against NeuN. GF mice were treated with ABX after surgery. b, Quantification of CTB-488+ cells in various brain regions of SPF and GF mice. adBNST (P = 0.229); LS (P = 0.1373); MeA (P = 0.358). No difference in CTB-488 retrograde-labelled cells was detected between SPF and GF mice. n = 4 mice per group. c, Representative images (from 4 animals each group) of CTB-488 (green) labelling and NeuN (magenta) staining in the adBNST, MeA, and LS of SPF and GF mice. Scale bars, 100 μm. d, CTB-488 and Fluorogold were stereotaxically injected into the PVN and adBNST, respectively, in vehicle and ABX Crh-ires-Cre;Ai14D mice. Brains were removed 7 days after injection. Retrograde tracers were visualized by confocal imaging of brain sections counterstained with antibodies. e, Quantification of CTB-488+ cells in various brain regions of vehicle and ABX mice. No difference in CTB-488 retrograde-labelled cells was detected between vehicle and ABX mice. adBNST P = 0.2064, LS P = 0.4332, MeA P = 0.4366. n = 4 mice per group. f, Quantification of Fluorogold (FG)+ cells in various brain regions of vehicle and ABX mice. No difference in Fluorogold retrograde-labelled cells was detected between vehicle and ABX mice. adBNST P = 0.8922, LS P = 0.8715, MeA P = 0.7284. n = 4 mice per group. g, Representative images (from 4 animals each group) of CTB-488 (green) labelling, Fluorogold (blue) staining, and CRH+ tdTomato (red) cells in the adBNST, MeA, LS, and PVN of vehicle and ABX mice. Scale bars, 100 μm. Data shown as individual points with mean ± s.e.m. Data analysed by two-tailed unpaired t-test (b, e, f). ND: no difference. For more statistical details, see Supplementary Information.
Extended Data Fig. 10 |. Microbiome analysis of AVNM and AVM mice, and identification and effects of E. faecalis.

a, Quantification of c-Fos+ cells in PVN of AVNM and AVM mice. Decreased c-Fos+ cells are detected in PVN after social interaction in AVM mice compared to AVNM mice. ***P = 0.0003. n = 8 mice per group. b, Total microbial loads of faecal pellets from GF mice receiving faecal microbial transplants from AVM- or AVNM-treated mice. All measurements performed with digital PCR and normalized to faecal pellet weights. n = 11 GF-AVM, 9 GF-AVNM mice per group. c, Correlation between the log10abundance of Enterococcus as determined by taxon-specific dPCR and 16S rRNA gene amplicon sequencing with dPCR anchoring (relative abundance of Enterococcus measured by sequencing × total 16S rRNA gene copies measured by dPCR). n = 8 mice per group. d, Percentage abundance of taxa from faecal pellets of GF mice that received faecal microbial transplants from AVM- or AVNM-treated mice. n = 9 GF-AVNM, 11 GF-AVM mice per group. e, Social activity shown in Fig. 4i in vehicle (VEH) and ABX mice (subject) in the first RSI test. *P = 0.0321. n = 8 VEH, 15 ABX mice (data from Fig. 4i). f, Enterococcus faecalis-specific 16S rRNA gene copy number in faecal pellets from ABX mice colonized with E.f. for 3 weeks and VEH or ABX mice gavaged with control buffer. All measurements performed with qPCR and normalized to faecal bacteria 16S rRNA gene. High E.f. values in ABX + E.f. compared to VEH + Ctrl mice probably reflect reduced competition by other bacteria following antibiotic treatment. The dashed line represents E.f. expression in VEH + Ctrl mice. VEH + Ctrl vs ABX + E.f. **P = 0.002, ABX + Ctrl vs ABX + E.f. **P = 0.0015. n = 3 mice per group, subset selected from Extended Data Fig. 10g. g, Social activity (relevant to Fig. 4i) following three weeks of E. faecalis colonization using the RSI paradigm in VEH + Ctrl, ABX + Ctrl, and ABX + E.f. mice (subject). ABX + Ctrl vs ABX + E.f. *P = 0.0336. n = 8 VEH + Ctrl, 8 ABX + Ctrl, 7 ABX + E.f. mice. Note, ABX + Ctrl mice are half the same group used in i, and therefore show a baseline reduction in social activity (data from Fig. 4i). h, Social activity was tested using the RSI paradigm in SPF and GF mice and in GF mice colonized with E.f. at the perinatal stage (subject), in the context of SPF novel mice. GF mice colonized with E.f. display increased social activity, compared to GF control mice. SPF vs GF *P = 0.028, GF vs GF + E.f. **P = 0.0066. n = 6 SPF, 11 GF, 10 GF + E.f. mice per group (subject only). i–k, Quantification of c-Fos+ cells in various brain regions of GF and GF + E.f. mice. Decreased c-Fos+ cells were detected in PVN (i, *P = 0.0167), adBNST (j, *P = 0.0467), and DG (k, **P = 0.0076) after social interaction in GF + E.f. mice compared to GF mice. n = 9 mice per group for PVN; n = 10 mice per group for DG; n = 10 GF, 9 GF + E.f. mice per group for adBNST. l, Serum corticosterone concentrations show no change after social interaction in GF + E.f. mice compared to GF mice. SPF vs GF P = 0.959, SPF vs GF + E.f. P = 0.0585, GF vs GF + E.f. P = 0.2642. n = 6 SPF, 11 GF, 10 GF + E.f. mice per group. Data shown as individual points with mean ± s.e.m. Data analysed by two-tailed unpaired t-test (a, e, i–k); one-way ANOVA with Bonferroni’s multiple comparison post hoc test (f–h, l). *P < 0.05, **P < 0.01, ***P < 0.001, ND: no difference. For more statistical details, see Supplementary Information.
Supplementary Material
Acknowledgements
We thank H.-N. Huang for support and planning in the initial staged of this study; H. Chu, J. Boktor, members of the Mazmanian laboratory and B. E. Deverman for critically reviewing the manuscript; Y. Garcia-Flores for administrative assistance; T. M. Thron, OLAR at Caltech, and LAC at NCKU for animal husbandry; D. J. Anderson and L. C. Hsieh-Wilson for stereotaxic instruments; L.-C. Lo and H. Huang for technical assistance; and J.-W. Chen for biological materials. M. Costa-Mattioli, M. Sgritta and K. Imanbayev provided advice on vagotomy. The BIF at Caltech provided use of confocal microscopes. The CLOVER Center at Caltech provided viral vectors. This work was supported by funds from the Ministry of Science and Technology in Taiwan (MOST 107–2320-B-006–072-MY3; 108–2321-B-006–025-MY2; 109–2314-B-006–046), the Higher Education Sprout Project, Ministry of Education to the Headquarters of University Advancement (NCKU) to W.-L.W.; an NIH Biotechnology Leadership Pre-doctoral Training Program (BLP) Fellowship (T32GM112592) to J.T.B.; the National Science Foundation Graduate Research Fellowship Program (NSF GRFP No. DGE-1745301) to J.O.; a grant from the Jacobs Institute for Molecular Engineering for Medicine (Caltech), the Kenneth Rainin Foundation Innovator Award (2018–1207) to R.F.I.; and Lynda and Blaine Fetter, Charlie Trimble, the Heritage Medical Research Institute, and the NIH (MH100556) to S.K.M.
Footnotes
Online content
Any methods, additional references, Nature Research reporting summaries, source data, extended data, supplementary information, acknowledgements, peer review information; details of author contributions and competing interests; and statements of data and code availability are available at https://doi.org/10.1038/s41586–021-03669-y.
Reporting summary
Further information on research design is available in the Nature Research Reporting Summary linked to this paper.
Competing interests W-L.W., M.D.A., B.D.N., and S.K.M. have filed a provisional patent on this work. All other authors declare no competing interests.
Additional information
Supplementary information The online version contains supplementary material available at https://doi.org/10.1038/s41586–021-03669-y.
Correspondence and requests for materials should be addressed to W.-L.W.
Peer review information Nature thanks Ioana Carcea and the other, anonymous, reviewer(s) for their contribution to the peer review of this work.
Reprints and permissions information is available at http://www.nature.com/reprints.
Data availability
All data generated and analysed during this study are included in this published article and its Supplementary Information files. Raw data for 16S rRNA gene sequencing and data analysis have been deposited in the ENA database under BioProject PRJNA632893. Source data are provided with this paper.
References
- 1.Anderson DJ Circuit modules linking internal states and social behaviour in flies and mice. Nat. Rev. Neurosci 17, 692–704 (2016). [DOI] [PubMed] [Google Scholar]
- 2.Chen P & Hong W Neural circuit mechanisms of social behavior. Neuron 98, 16–30 (2018). [DOI] [PMC free article] [PubMed] [Google Scholar]
- 3.Buffington SA et al. Microbial reconstitution reverses maternal diet-induced social and synaptic deficits in offspring. Cell 165, 1762–1775 (2016). [DOI] [PMC free article] [PubMed] [Google Scholar]
- 4.Desbonnet L, Clarke G, Shanahan F, Dinan TG & Cryan JF Microbiota is essential for social development in the mouse. Mol. Psychiatry 19, 146–148 (2014). [DOI] [PMC free article] [PubMed] [Google Scholar]
- 5.Rogers GB et al. From gut dysbiosis to altered brain function and mental illness: mechanisms and pathways. Mol. Psychiatry 21, 738–748 (2016). [DOI] [PMC free article] [PubMed] [Google Scholar]
- 6.Sharon G, Sampson TR, Geschwind DH & Mazmanian SK The central nervous system and the gut microbiome. Cell 167, 915–932 (2016). [DOI] [PMC free article] [PubMed] [Google Scholar]
- 7.Dinan TG & Cryan JF The impact of gut microbiota on brain and behaviour: implications for psychiatry. Curr. Opin. Clin. Nutr. Metab. Care 18, 552–558 (2015). [DOI] [PubMed] [Google Scholar]
- 8.Diaz Heijtz R et al. Normal gut microbiota modulates brain development and behavior. Proc. Natl Acad. Sci. USA 108, 3047–3052 (2011). [DOI] [PMC free article] [PubMed] [Google Scholar]
- 9.Sudo N et al. Postnatal microbial colonization programs the hypothalamic-pituitary-adrenal system for stress response in mice. J. Physiol. (Lond.) 558, 263–275 (2004). [DOI] [PMC free article] [PubMed] [Google Scholar]
- 10.Bercik P et al. The intestinal microbiota affect central levels of brain-derived neurotropic factor and behavior in mice. Gastroenterology 141, 599–609.e3 (2011). [DOI] [PubMed] [Google Scholar]
- 11.Arentsen T, Raith H, Qian Y, Forssberg H & Diaz Heijtz R Host microbiota modulates development of social preference in mice. Microb. Ecol. Health Dis 26, 29719 (2015). [DOI] [PMC free article] [PubMed] [Google Scholar]
- 12.Clarke G et al. The microbiome-gut-brain axis during early life regulates the hippocampal serotonergic system in a sex-dependent manner. Mol. Psychiatry 18, 666–673 (2013). [DOI] [PubMed] [Google Scholar]
- 13.Neufeld KM, Kang N, Bienenstock J & Foster JA Reduced anxiety-like behavior and central neurochemical change in germ-free mice. Neurogastroenterol. Motil 23, 255–e119 (2011). [DOI] [PubMed] [Google Scholar]
- 14.Hsiao EY et al. Microbiota modulate behavioral and physiological abnormalities associated with neurodevelopmental disorders. Cell 155, 1451–1463 (2013). [DOI] [PMC free article] [PubMed] [Google Scholar]
- 15.Hanstock TL, Clayton EH, Li KM & Mallet PE Anxiety and aggression associated with the fermentation of carbohydrates in the hindgut of rats. Physiol. Behav 82, 357–368 (2004). [DOI] [PubMed] [Google Scholar]
- 16.Crumeyrolle-Arias M et al. Absence of the gut microbiota enhances anxiety-like behavior and neuroendocrine response to acute stress in rats. Psychoneuroendocrinology 42, 207–217 (2014). [DOI] [PubMed] [Google Scholar]
- 17.Golubeva AV et al. Microbiota-related changes in bile acid & tryptophan metabolism are associated with gastrointestinal dysfunction in a mouse model of autism. EBioMedicine 24, 166–178 (2017). [DOI] [PMC free article] [PubMed] [Google Scholar]
- 18.Buffington SA et al. Dissecting the contribution of host genetics and the microbiome in complex behaviors. Cell 184, 1740–1756.e6 (2021). [DOI] [PMC free article] [PubMed] [Google Scholar]
- 19.Sgritta M et al. Mechanisms underlying microbial-mediated changes in social behavior in mouse models of autism spectrum disorder. Neuron 101, 246–259.e6 (2019). [DOI] [PMC free article] [PubMed] [Google Scholar]
- 20.Gorrindo P et al. Gastrointestinal dysfunction in autism: parental report, clinical evaluation, and associated factors. Autism Res 5, 101–108 (2012). [DOI] [PMC free article] [PubMed] [Google Scholar]
- 21.Buie T et al. Recommendations for evaluation and treatment of common gastrointestinal problems in children with ASDs. Pediatrics 125 (Suppl 1), S19–S29 (2010). [DOI] [PubMed] [Google Scholar]
- 22.Kang DW et al. Reduced incidence of Prevotella and other fermenters in intestinal microflora of autistic children. PLoS ONE 8, e68322 (2013). [DOI] [PMC free article] [PubMed] [Google Scholar]
- 23.Adams JB, Johansen LJ, Powell LD, Quig D & Rubin RA Gastrointestinal flora and gastrointestinal status in children with autism—comparisons to typical children and correlation with autism severity. BMC Gastroenterol 11, 22 (2011). [DOI] [PMC free article] [PubMed] [Google Scholar]
- 24.Theis KR et al. Symbiotic bacteria appear to mediate hyena social odors. Proc. Natl Acad. Sci. USA 110, 19832–19837 (2013). [DOI] [PMC free article] [PubMed] [Google Scholar]
- 25.Nielsen BL et al. Sexual responses of male rats to odours from female rats in oestrus are not affected by female germ-free status. Behav. Brain Res 359, 686–693 (2019). [DOI] [PubMed] [Google Scholar]
- 26.Donaldson ZR & Young LJ Oxytocin, vasopressin, and the neurogenetics of sociality. Science 322, 900–904 (2008). [DOI] [PubMed] [Google Scholar]
- 27.Urban DJ & Roth BL DREADDs (designer receptors exclusively activated by designer drugs): chemogenetic tools with therapeutic utility. Annu. Rev. Pharmacol. Toxicol 55, 399–417 (2015). [DOI] [PubMed] [Google Scholar]
- 28.Füzesi T, Daviu N, Wamsteeker Cusulin JI, Bonin RP & Bains JS Hypothalamic CRH neurons orchestrate complex behaviours after stress. Nat. Commun 7, 11937 (2016). [DOI] [PMC free article] [PubMed] [Google Scholar]
- 29.Barlow JT, Bogatyrev SR & Ismagilov RF A quantitative sequencing framework for absolute abundance measurements of mucosal and lumenal microbial communities. Nat. Commun 11, 2590 (2020). [DOI] [PMC free article] [PubMed] [Google Scholar]
- 30.Kwong WK et al. Dynamic microbiome evolution in social bees. Sci. Adv 3, e1600513 (2017). [DOI] [PMC free article] [PubMed] [Google Scholar]
- 31.Sharon G et al. Commensal bacteria play a role in mating preference of Drosophila melanogaster. Proc. Natl Acad. Sci. USA 107, 20051–20056 (2010). [DOI] [PMC free article] [PubMed] [Google Scholar]
- 32.Foster JA, Rinaman L & Cryan JF Stress & the gut-brain axis: regulation by the microbiome. Neurobiol. Stress 7, 124–136 (2017). [DOI] [PMC free article] [PubMed] [Google Scholar]
- 33.Paxinos G & Franklin KBJ. The Mouse Brain in Stereotaxic Coordinates 2nd edn (Academic, 2001). [Google Scholar]
- 34.Hagihara H, Toyama K, Yamasaki N & Miyakawa T Dissection of hippocampal dentate gyrus from adult mouse. J. Vis. Exp (33):1543 (2009). [DOI] [PMC free article] [PubMed] [Google Scholar]
- 35.Yoshioka W et al. Fluorescence laser microdissection reveals a distinct pattern of gene activation in the mouse hippocampal region. Sci. Rep 2, 783 (2012). [DOI] [PMC free article] [PubMed] [Google Scholar]
- 36.Spandidos A, Wang X, Wang H & Seed B PrimerBank: a resource of human and mouse PCR primer pairs for gene expression detection and quantification. Nucleic Acids Res 38, D792–D799 (2010). [DOI] [PMC free article] [PubMed] [Google Scholar]
- 37.Wamsteeker Cusulin JI, Füzesi T, Watts AG & Bains JS Characterization of corticotropin-releasing hormone neurons in the paraventricular nucleus of the hypothalamus of Crh-IRES-Cre mutant mice. PLoS ONE 8, e64943 (2013). [DOI] [PMC free article] [PubMed] [Google Scholar]
- 38.Bolyen E et al. Reproducible, interactive, scalable and extensible microbiome data science using QIIME 2. Nat. Biotechnol 37, 852–857 (2019). [DOI] [PMC free article] [PubMed] [Google Scholar]
- 39.Rognes T, Flouri T, Nichols B, Quince C & Mahé F VSEARCH: a versatile open source tool for metagenomics. PeerJ 4, e2584 (2016). [DOI] [PMC free article] [PubMed] [Google Scholar]
- 40.Amir A et al. Deblur rapidly resolves single-nucleotide community sequence patterns. mSystems 2, e00191–16 (2017). [DOI] [PMC free article] [PubMed] [Google Scholar]
- 41.McDonald D et al. An improved Greengenes taxonomy with explicit ranks for ecological and evolutionary analyses of bacteria and archaea. ISME J 6, 610–618 (2012). [DOI] [PMC free article] [PubMed] [Google Scholar]
- 42.Janssen S et al. Phylogenetic placement of exact amplicon sequences improves associations with clinical information. mSystems 3, e00021–18 (2018). [DOI] [PMC free article] [PubMed] [Google Scholar]
- 43.Bokulich NA et al. Optimizing taxonomic classification of marker-gene amplicon sequences with QIIME 2’s q2-feature-classifier plugin. Microbiome 6, 90 (2018). [DOI] [PMC free article] [PubMed] [Google Scholar]
- 44.Lozupone C & Knight R UniFrac: a new phylogenetic method for comparing microbial communities. Appl. Environ. Microbiol 71, 8228–8235 (2005). [DOI] [PMC free article] [PubMed] [Google Scholar]
- 45.Bogatyrev SR & Ismagilov RF Quantitative microbiome profiling in lumenal and tissue samples with broad coverage and dynamic range via a single-step 16S rRNA gene DNA copy quantification and amplicon barcoding Preprint at 10.1101/2020.01.22.914705 (2020). [DOI]
- 46.Bogatyrev SR, Rolando JC & Ismagilov RF Self-reinoculation with fecal flora changes microbiota density and composition leading to an altered bile-acid profile in the mouse small intestine. Microbiome 8, 19 (2020). [DOI] [PMC free article] [PubMed] [Google Scholar]
- 47.Balamurugan R, Rajendiran E, George S, Samuel GV & Ramakrishna BS Real-time polymerase chain reaction quantification of specific butyrate-producing bacteria, Desulfovibrio and Enterococcus faecalis in the feces of patients with colorectal cancer. J. Gastroenterol. Hepatol 23, 1298–1303 (2008). [DOI] [PubMed] [Google Scholar]
- 48.Bolyen E et al. Reproducible, interactive, scalable and extensible microbiome data science using QIIME 2. Nat. Biotechnol 37, 852–857 (2019). [DOI] [PMC free article] [PubMed] [Google Scholar]
- 49.Callahan BJ et al. DADA2: high-resolution sample inference from Illumina amplicon data. Nat. Methods 13, 581–583 (2016). [DOI] [PMC free article] [PubMed] [Google Scholar]
- 50.Quast C et al. The SILVA ribosomal RNA gene database project: improved data processing and web-based tools. Nucleic Acids Res 41, D590–D596 (2013). [DOI] [PMC free article] [PubMed] [Google Scholar]
- 51.Shih HT & Mok HK ETHOM: rvent-recording computer software for the study of animal behavior. Acta Zool. Taiwan 11, 47–61 (2000). [Google Scholar]
Associated Data
This section collects any data citations, data availability statements, or supplementary materials included in this article.
Supplementary Materials
Data Availability Statement
All data generated and analysed during this study are included in this published article and its Supplementary Information files. Raw data for 16S rRNA gene sequencing and data analysis have been deposited in the ENA database under BioProject PRJNA632893. Source data are provided with this paper.