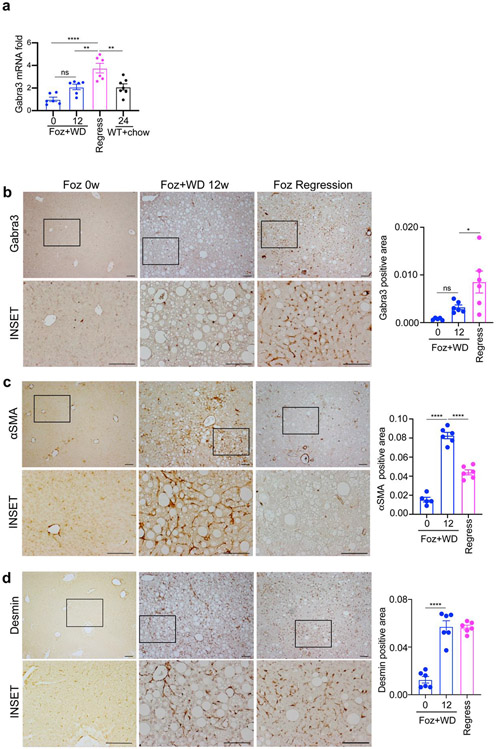
Figure 7. Inactivated hepatic stellate cells are characterized by high GABRA3, low aSMA expression.
a) GABRA3 gene expression in the indicated groups was analyzed by qPCR. Liver sections from the indicated groups were stained with b) anti-GABRA3, c) anti-aSMA and d) anti-DESMIN, antibody and quantified as normalized to the non-steatotic area. Scale bar: 100 μm. Data are represented as fold induction versus foz/foz mice on standard chow (0w WD group). Bar graphs represent mean ± SEM, *p <0.05, **p <0.01, ***p <0.001, ****p <0.0001 by ANOVA.

