ECOLOGY Correction for “Predicting future invaders and future invasions,” by Alice Fournier, Caterina Penone, Maria Grazia Pennino, and Franck Courchamp, which was first published March 29, 2019; 10.1073/pnas.1803456116 (Proc. Natl. Acad. Sci. U.S.A. 116, 7905–7910).
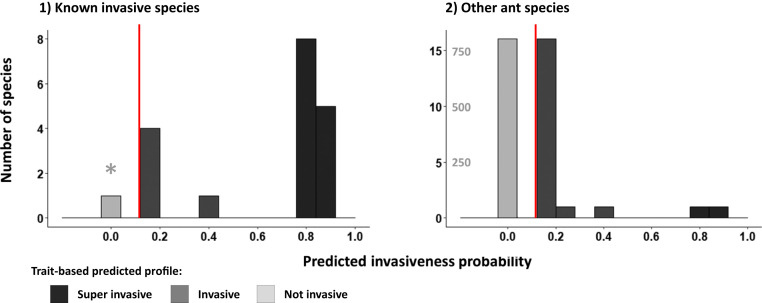
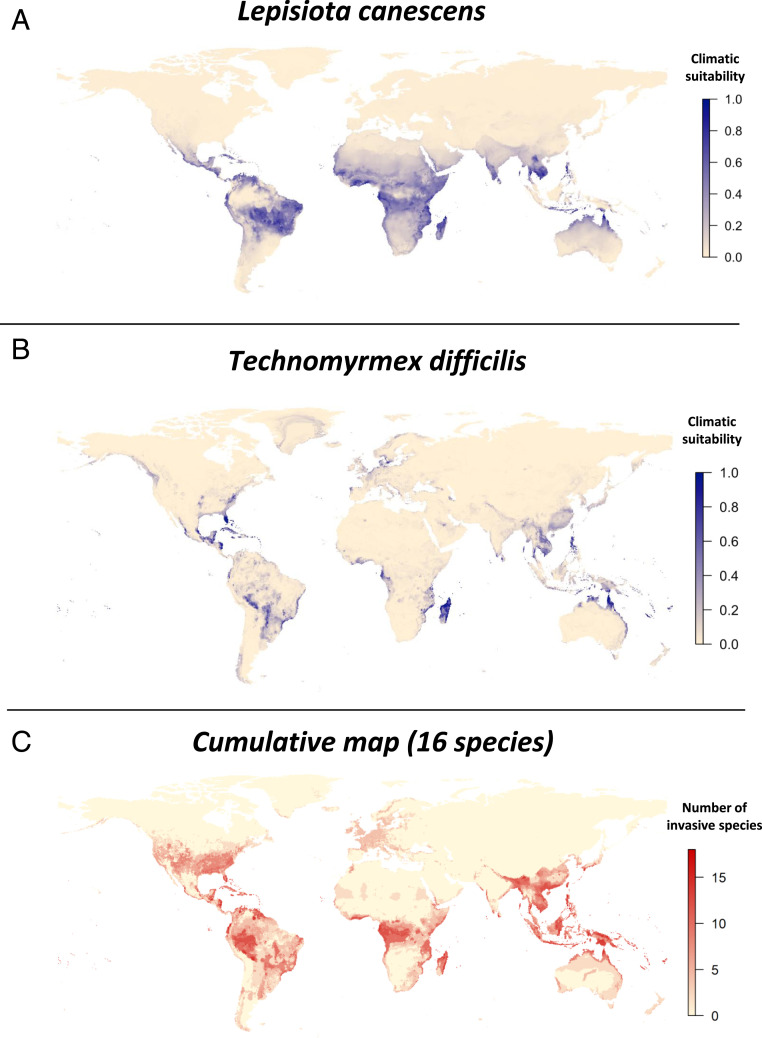
The authors note that due to a technical error in the script that selected the species based on their amount of missing values, the species names did not match their trait values. This resulted in the wrong set of species to be evaluated for their invasive potential. This error affects the invasiveness probabilities and invasive identity in Table 1 and Fig. 1, and associated numbers in text; the cumulative map in Fig. 2C; and, in the SI Appendix, Figs. S1, S5, S8A, S9, and S11 and Tables S1, S3, S4, and S5.
Table 1.
Predicted invasiveness probabilities, or “invasion profiles,” of 19 invasive species from the IUCN red list (in boldface) and 18 potential future invaders identified with our model
| Species | P | ± | % |
| Superinvasive profiles | |||
| Technomyrmex difficilis | 0.87 | 0.02 | 100 |
| Lasius neglectus | 0.87 | 0.02 | 100 |
| Solenopsis geminata | 0.87 | 0.02 | 100 |
| Solenopsis invicta | 0.87 | 0.02 | 100 |
| Technomyrmex albipes | 0.87 | 0.02 | 100 |
| Trichomyrmex destructor | 0.87 | 0.02 | 100 |
| Lepisiota canescens | 0.83 | 0.01 | 100 |
| Anoplolepis gracilipes | 0.83 | 0.01 | 100 |
| Linepithema humile | 0.83 | 0.01 | 100 |
| Monomorium pharaonis | 0.83 | 0.01 | 100 |
| Myrmica rubra | 0.83 | 0.01 | 100 |
| Nylanderia pubens | 0.83 | 0.01 | 100 |
| Paratrechina longicornis | 0.83 | 0.01 | 100 |
| Tapinoma melanocephalum | 0.83 | 0.01 | 100 |
| Wasmannia auropunctata | 0.83 | 0.01 | 100 |
| Invasive profiles | |||
| Pheidole megacephala | 0.39 | 0.04 | 100 |
| Anoplolepis custodiens | 0.38 | 0.04 | 98 |
| Formica yessensis | 0.23 | 0.01 | 100 |
| Tapinoma litorale | 0.17 | 0.01 | 100 |
| Tapinoma sessile | 0.17 | 0.01 | 100 |
| Brachyponera chinensis | 0.17 | 0.01 | 100 |
| Solenopsis richteri | 0.17 | 0.01 | 100 |
| Ochetellus glaber | 0.17 | 0.16 | 100 |
| Lasius fuliginosus | 0.14 | 0.02 | 100 |
| Aphaenogaster spinosa | 0.13 | 0.01 | 100 |
| Cardiocondyla emeryi | 0.13 | 0.01 | 100 |
| Cardiocondyla minutior | 0.13 | 0.01 | 100 |
| Dolichoderus bispinosus | 0.13 | 0.01 | 100 |
| Lasius sabularum | 0.13 | 0.01 | 100 |
| Monomorium minimum | 0.13 | 0.01 | 100 |
| Neivamyrmexnigrescens | 0.13 | 0.01 | 100 |
| Neivamyrmex pilosus | 0.13 | 0.01 | 100 |
| Tetramorium bicarinatum | 0.13 | 0.01 | 100 |
| Tetramorium simillimum | 0.13 | 0.01 | 100 |
| Monomorium floricola | 0.13 | 0.01 | 100 |
| Solenopsis papuana | 0.13 | 0.01 | 100 |
| Acromyrmex octospinosus | 0.00 | 0.00 | 100 |
“P”: invasiveness probability (mean: 100 models); “±”: invasiveness variability (SD: 100 models); “%”: percentage of models. Note that the values of A. octospinosus are P = 0.0001 ± 9.07E-05.
Fig. 1.
Predicted invasiveness probability distributions for (1) ant species recognized as invasive by IUCN and (2) ant species for which no information on invasive status exists. Dark gray bars on the right of the red lines correspond to superinvasive profiles, medium gray bars to invasive, and light gray bars to noninvasive. The asterisk (*) points to A. octospinosus, which the model shows to be wrongly classified as invasive by the IUCN. For the sake of clarity, the Right graph has two y axes: the light-gray axis corresponds to the light-gray bar of noninvasive species only.
Fig. 2.
Global distribution of predicted invasive species for (A) the predicted superinvasive L. canescens, (B) the predicted superinvasive T. difficilis, and (C) the cumulation of the individual climatic suitability of the 11 species with sufficient data (see main text). Since the exact native range is often unknown, the projected climatic suitability includes the native range of species.


