

First Paragraph
The immune system employs two distinct defense strategies against infections: microbe-directed pathogen destruction characterized by type 1 immunity1 and host-directed pathogen containment exemplified by type 2 immunity in induction of tissue repair2. Akin to infectious diseases, cancer progresses with self-propagating cancer cells inflicting host tissue damage. While the immunological mechanisms of cancer cell destruction are well defined3–5, whether immune-mediated cancer cell containment can be induced is poorly understood. Here we show that depletion of transforming growth factor-β receptor II (TGF-βRII) from CD4+, but not CD8+, T cells halts cancer progression as a result of tissue healing and blood vasculature remodeling, causing cancer cell hypoxia and death in distant avascular regions. Notably, the host-directed protective response is dependent on the T helper (Th) 2 cytokine interleukin 4 (IL-4), but not the Th1 cytokine interferon γ (IFN-γ). Therefore, type 2 immunity can be mobilized as an effective tissue-level defense mechanism against cancer.
Cancer arises from malignant transformation of self-cells with immunological mechanisms of self-tolerance including those mediated by Foxp3+ regulatory T (Treg) cells, co-inhibitory receptors PD-1 and CTLA-4, and the regulatory cytokine TGF-β maladapted to repress cancer immunity6–8. Depletion of tumor-infiltrating Treg cells or blockade of PD-1 and CTLA-4 revives cytotoxic T lymphocyte (CTL) responses to suppress cancer progression9,10. Blockage of TGF-β signaling in T cells as well inhibits tumor development11,12, in correlation with enhanced CTL activity in vitro12. Nonetheless, as TGF-β exerts pleiotropic effects on multiple T cell lineages13, its functional target in vivo and the underlying mechanism of cancer regulation remain obscure.
TGF-β acts on CD4+ T cells to foster tumor growth
To examine whether TGF-β directly targets CTLs to promote tumor immune evasion, we utilized an MMTV-PyMT (PyMT) transgenic model of breast cancer. Mice carrying a floxed allele of the Tgfbr2 gene (Tgfbr2fl/fl) encoding the TGF-β receptor II (TGF-βRII) were crossed with CD8Cre transgenic mice and bred to the PyMT background. Loss of TGF-βRII was observed in CD8+ T cells (Extended Data Fig. 1a), which led to enhanced effector/memory differentiation in tumor-draining lymph nodes (Extended Data Fig. 1b). Increased expression of the cytolytic enzyme granzyme B among PD-1-expressing CD8+ T cells was also detected in the tumor (Extended Data Fig. 1c). Nonetheless, tumor growth was not inhibited (Fig. 1a).
Fig. 1 |. Blockage of TGF-β signaling in CD4+ T cells suppresses tumor development independent of CD8+ T cells.
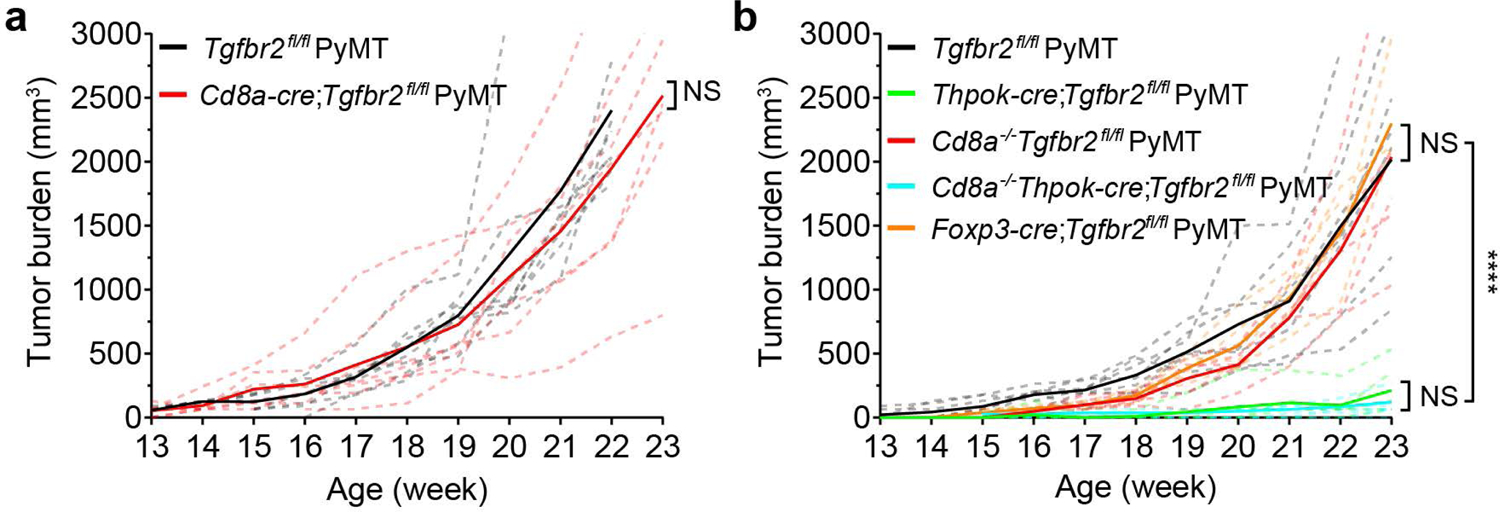
a, Tumor measurements of Tgfbr2fl/flPyMT (n=8) and CD8CreTgfbr2fl/flPyMT (n=7) mice. Two-tailed unpaired t-test. b, Tumor measurements of Tgfbr2fl/flPyMT (n=7), ThPOKCreTgfbr2fl/flPyMT (n=6), CD8−/−Tgfbr2fl/flPyMT (n=5), CD8−/−ThPOKCreTgfbr2fl/flPyMT (n=6) and Foxp3CreTgfbr2fl/flPyMT (n=5) mice. Two-tailed unpaired t-test. Dashed lines indicate total tumor burden from individual mice and solid lines indicate mean of total tumor burden from all mice in a group. ****: P<0.0001 and ns: not significant.
To investigate whether TGF-β acts on CD4+ T cells to indirectly suppress CTLs, we crossed Tgfbr2fl/flPyMT mice with ThPOKCre mice in which a Thpok silencer was inserted into a Cd4 enhancer-promoter locus to drive Cre expression in mature CD4+ T cells (Extended Data Fig. 2a-2b). ThPOKCreTgfbr2fl/flPyMT mice exhibited enhanced effector/memory differentiation of CD4+, but not CD8+, T cells, in tumor-draining lymph nodes (Extended Data Fig. 2c). However, tumor-infiltrating CD8+ T cells expressed higher levels of granzyme B and lower levels of PD-1 (Extended Data Fig. 2d), in correlation with potent tumor repression (Fig. 1b). Surprisingly, the tumor repression phenotype was unaffected in ThPOKCreTgfbr2fl/flPyMT mice crossed onto the CD8-deficient background (Fig. 1b), while depletion of CD4+ T cells restored tumor growth (Extended Data Fig. 2e-2f). These findings reveal that CTLs are dispensable for cancer suppression triggered by TGF-βRII-deficient CD4+ T cells.
Vessel reorganization triggers cancer cell death
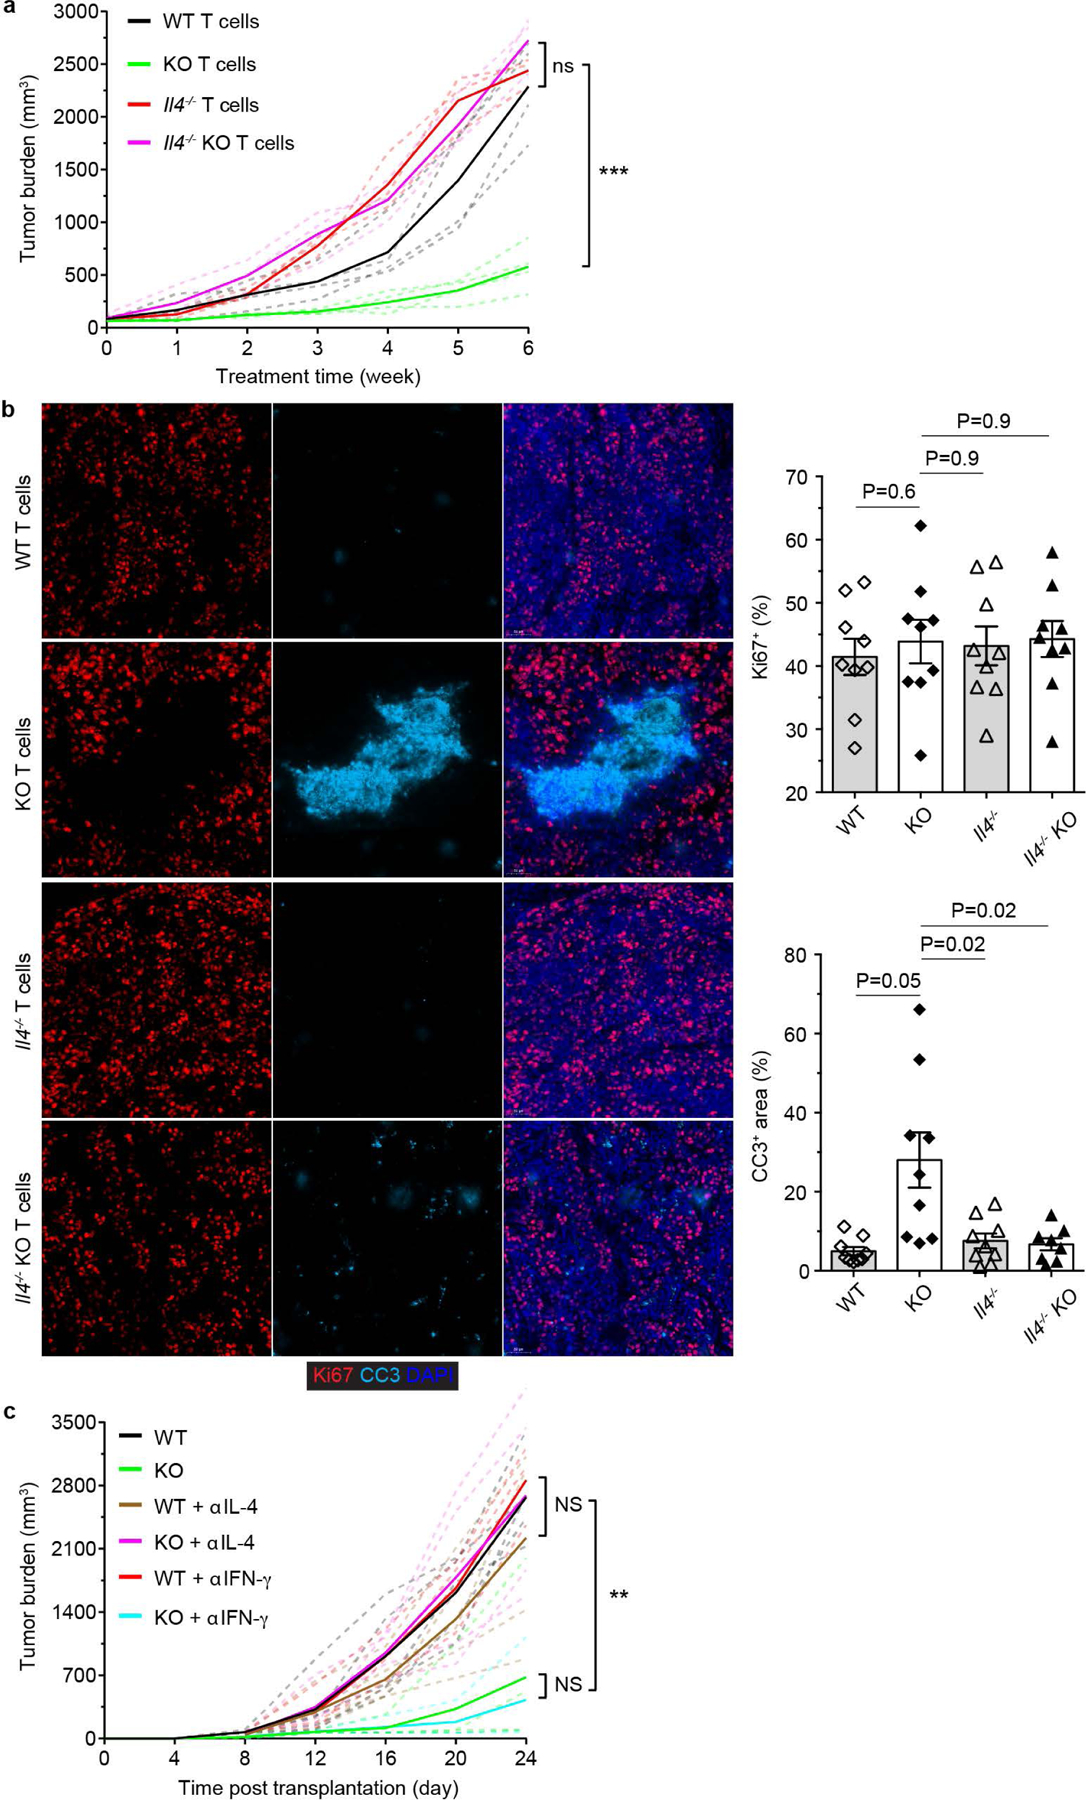
To define the underlying mechanism of cancer suppression in ThPOKCreTgfbr2fl/flPyMT mice, we assessed cancer cell proliferation and death by Ki67 and cleaved Caspase 3 (CC3) staining. Ki67 expression was comparable in Tgfbr2fl/flPyMT and ThPOKCreTgfbr2fl/flPyMT mice (Fig. 2a), while an approximate 13-fold increase of CC3+ cancer cells was observed in ThPOKCreTgfbr2fl/flPyMT mice (Fig. 2a). Notably, dying cancer cells had a clustered distribution pattern (Fig. 2a), which was not observed in CD8CreTgfbr2fl/flPyMT mice (Extended Data Fig. 3a), but was preserved in ThPOKCreTgfbr2fl/flPyMT mice on the CD8-deficient background (Extended Data Fig. 3b). Notably, while CD4+ T cells were distributed in the tumor parenchyma of Tgfbr2fl/flPyMT mice (Fig. 2b), they were preferentially localized in the tumor stroma of ThPOKCreTgfbr2fl/flPyMT mice distant to dying cancer cells (Fig. 2b). In addition, CD45+ leukocytes were predominantly localized in the tumor stroma (Extended Data Fig. 4a), suggesting that TGF-βRII-deficient CD4+ T cells do not induce cancer cell death directly or indirectly through other cytotoxic leukocyte effectors.
Fig. 2 |. Blockage of TGF-β signaling in CD4+ T cells triggers cancer cell death in association with T cell stromal localization.
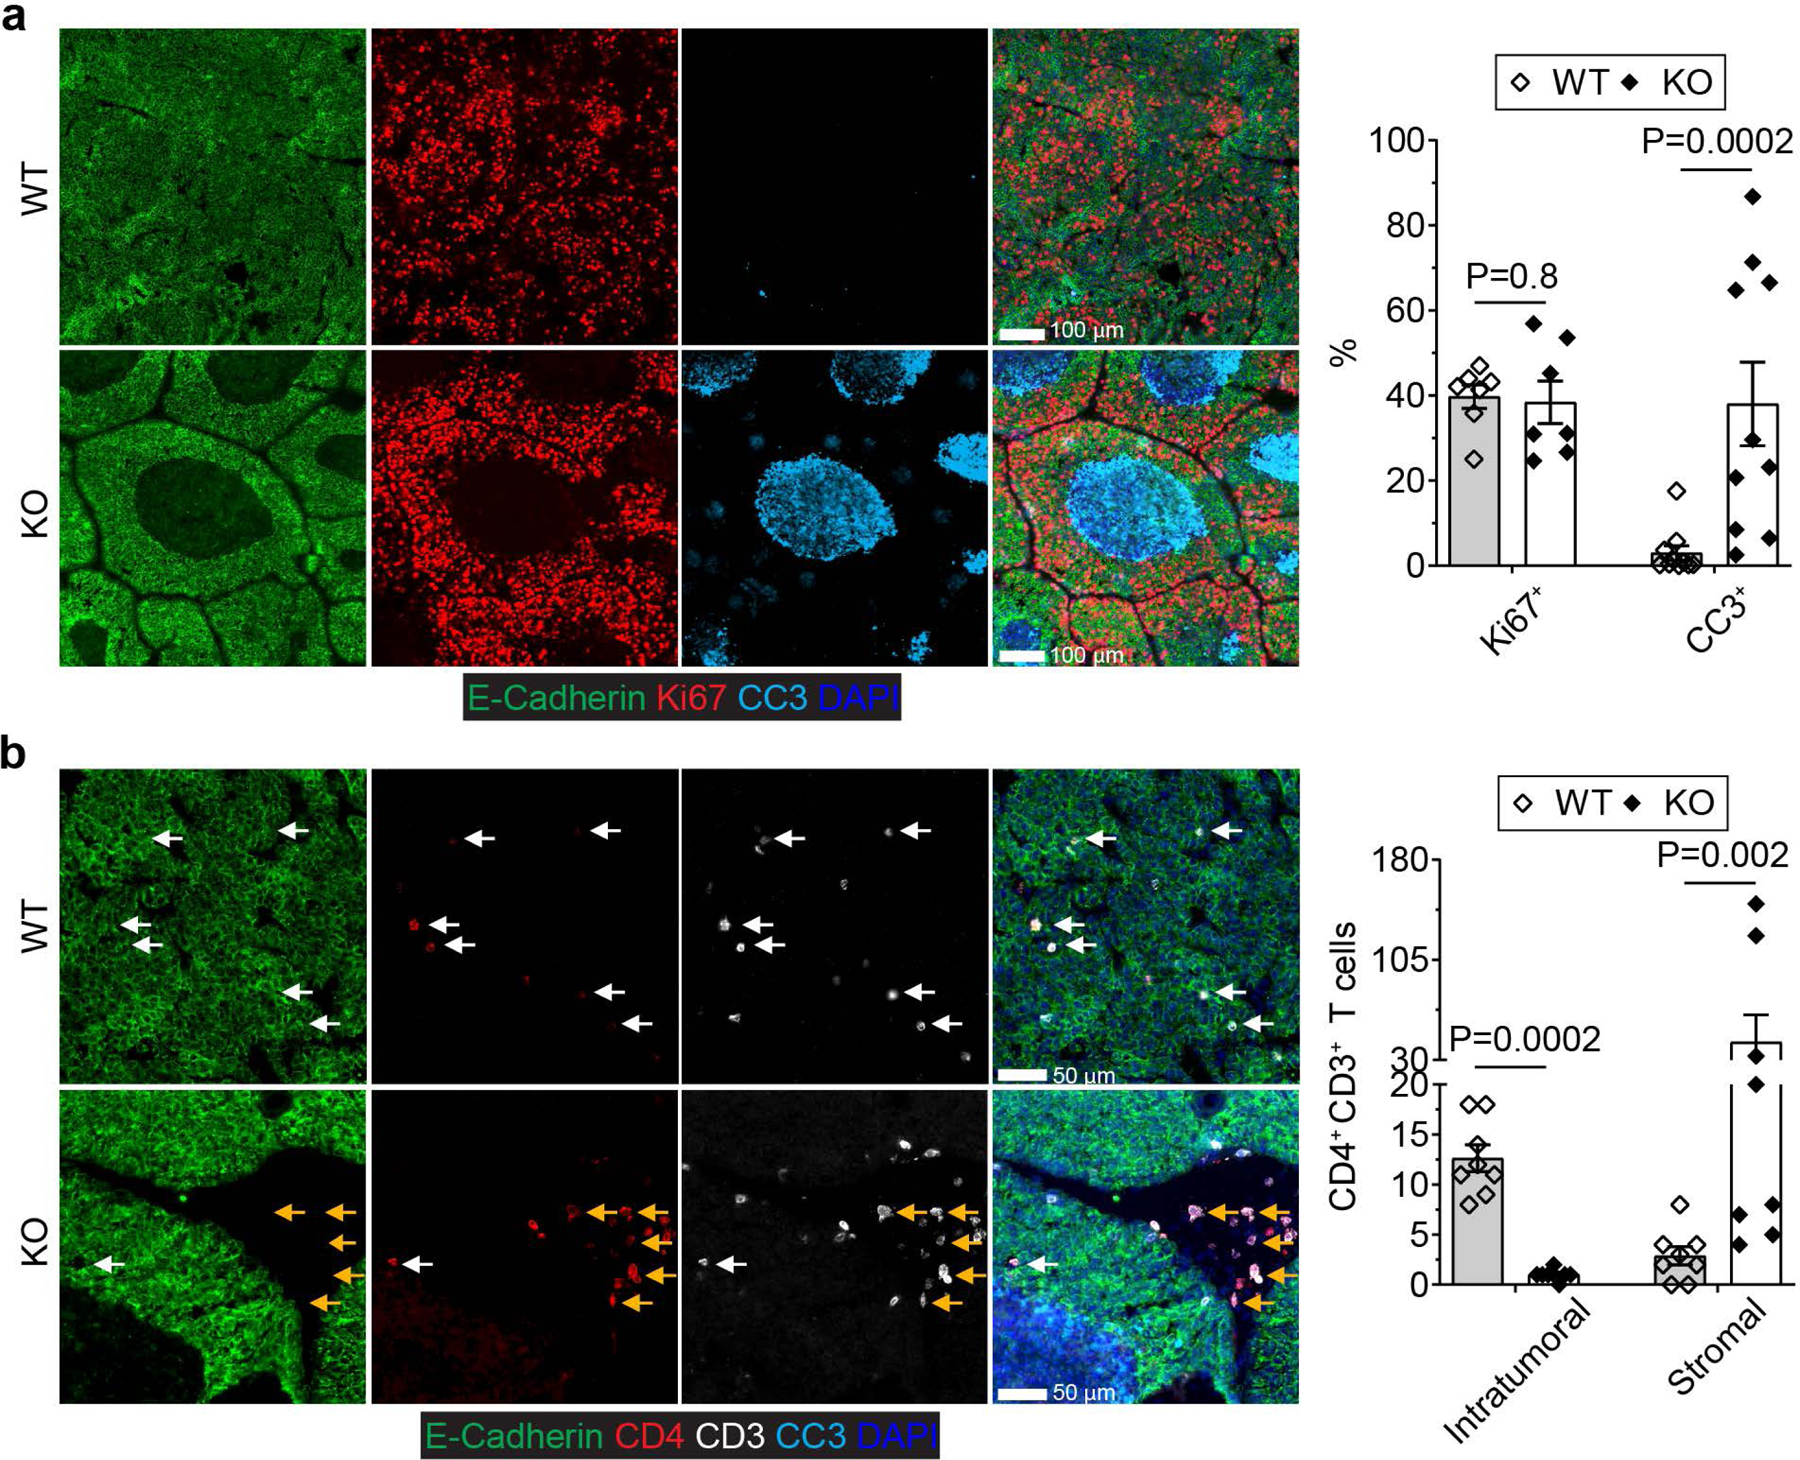
a, Representative immunofluorescence images of E-Cadherin (green), Ki67 (red) and cleaved Caspase 3 (CC3, cyan) in tumor tissues from 23-week-old Tgfbr2fl/flPyMT (wild-type, WT) and ThPOKCreTgfbr2fl/flPyMT (knockout, KO) mice. The percentage of Ki67+E-Cadherin+ cells over total E-Cadherin+ epithelial cells was calculated from 0.02 mm2 regions (n=10 and 7 for WT and KO tumor tissues, respectively). The percentage of CC3+ areas over total E-Cadherin+ areas was calculated from 0.02 mm2 regions (n=10 for WT and KO tumor tissues). b, Representative immunofluorescence images of E-Cadherin (green), CD4 (red), CD3 (white) and CC3 (cyan) in tumor tissues from 23-week-old WT and KO mice. Intratumoral (white arrows) and stromal (yellow arrows) CD4+ T cells were counted from 0.1 mm2 regions (n=8 for WT and KO tumor tissues). Data are represented as the mean ± SEM (biologically independent mice in a, b). Two-tailed unpaired t-test (a, b).
The stromal localization of TGF-βRII-deficient CD4+ T cells indicates that they may regulate the host to endure the negative impact of a growing tumor with cancer cell death being a secondary outcome. In line with the notion that tumors resemble “wounds that do not heal”14, the tumor tissue from Tgfbr2fl/flPyMT mice had extensive extravascular deposition of fibrinogen (Fig. 3a). In contrast, fibrinogen was predominantly intravascular in tumors from ThPOKCreTgfbr2fl/flPyMT mice (Fig. 3a). Perfusion with a biotinylation probe confirmed an overt leaky blood vasculature in tumors from Tgfbr2fl/flPyMT, but not ThPOKCreTgfbr2fl/flPyMT mice (Extended Data Fig. 4b). The vasculature damage phenotype occurred concurrently with an irregularly shaped tumor microvasculature manifested by isolated CD31 staining in Tgfbr2fl/flPyMT, but not ThPOKCreTgfbr2fl/flPyMT mice (Fig. 3a). Pericytes and fibroblasts stabilize capillaries and control perfusion15,16. While approximately 12% or 63% endothelial cells with isolated CD31+ staining were not bound by NG2+ pericytes or GP38+ fibroblasts, respectively, in tumors from Tgfbr2fl/flPyMT mice (Fig. 3b), the endothelium was tightly ensheathed by pericytes and fibroblasts in tumors from ThPOKCreTgfbr2fl/flPyMT mice (Fig. 3b). In addition to a supportive cellular compartment, acellular components including extracellular matrix proteins regulate vasculature integrity17. The vessel basement membrane proteins collagen IV and fibronectin were fragmented and scattered in tumors from Tgfbr2fl/flPyMT, but not ThPOKCreTgfbr2fl/flPyMT, mice (Fig. 3c). These observations demonstrate that blockage of TGF-β signaling in CD4+ T cells promotes the generation of a mature and organized tumor vasculature.
Fig. 3 |. Blockage of TGF-β signaling in CD4+ T cells induces tumor tissue healing, vessel reorganization and hypoxia-associated cancer cell death.
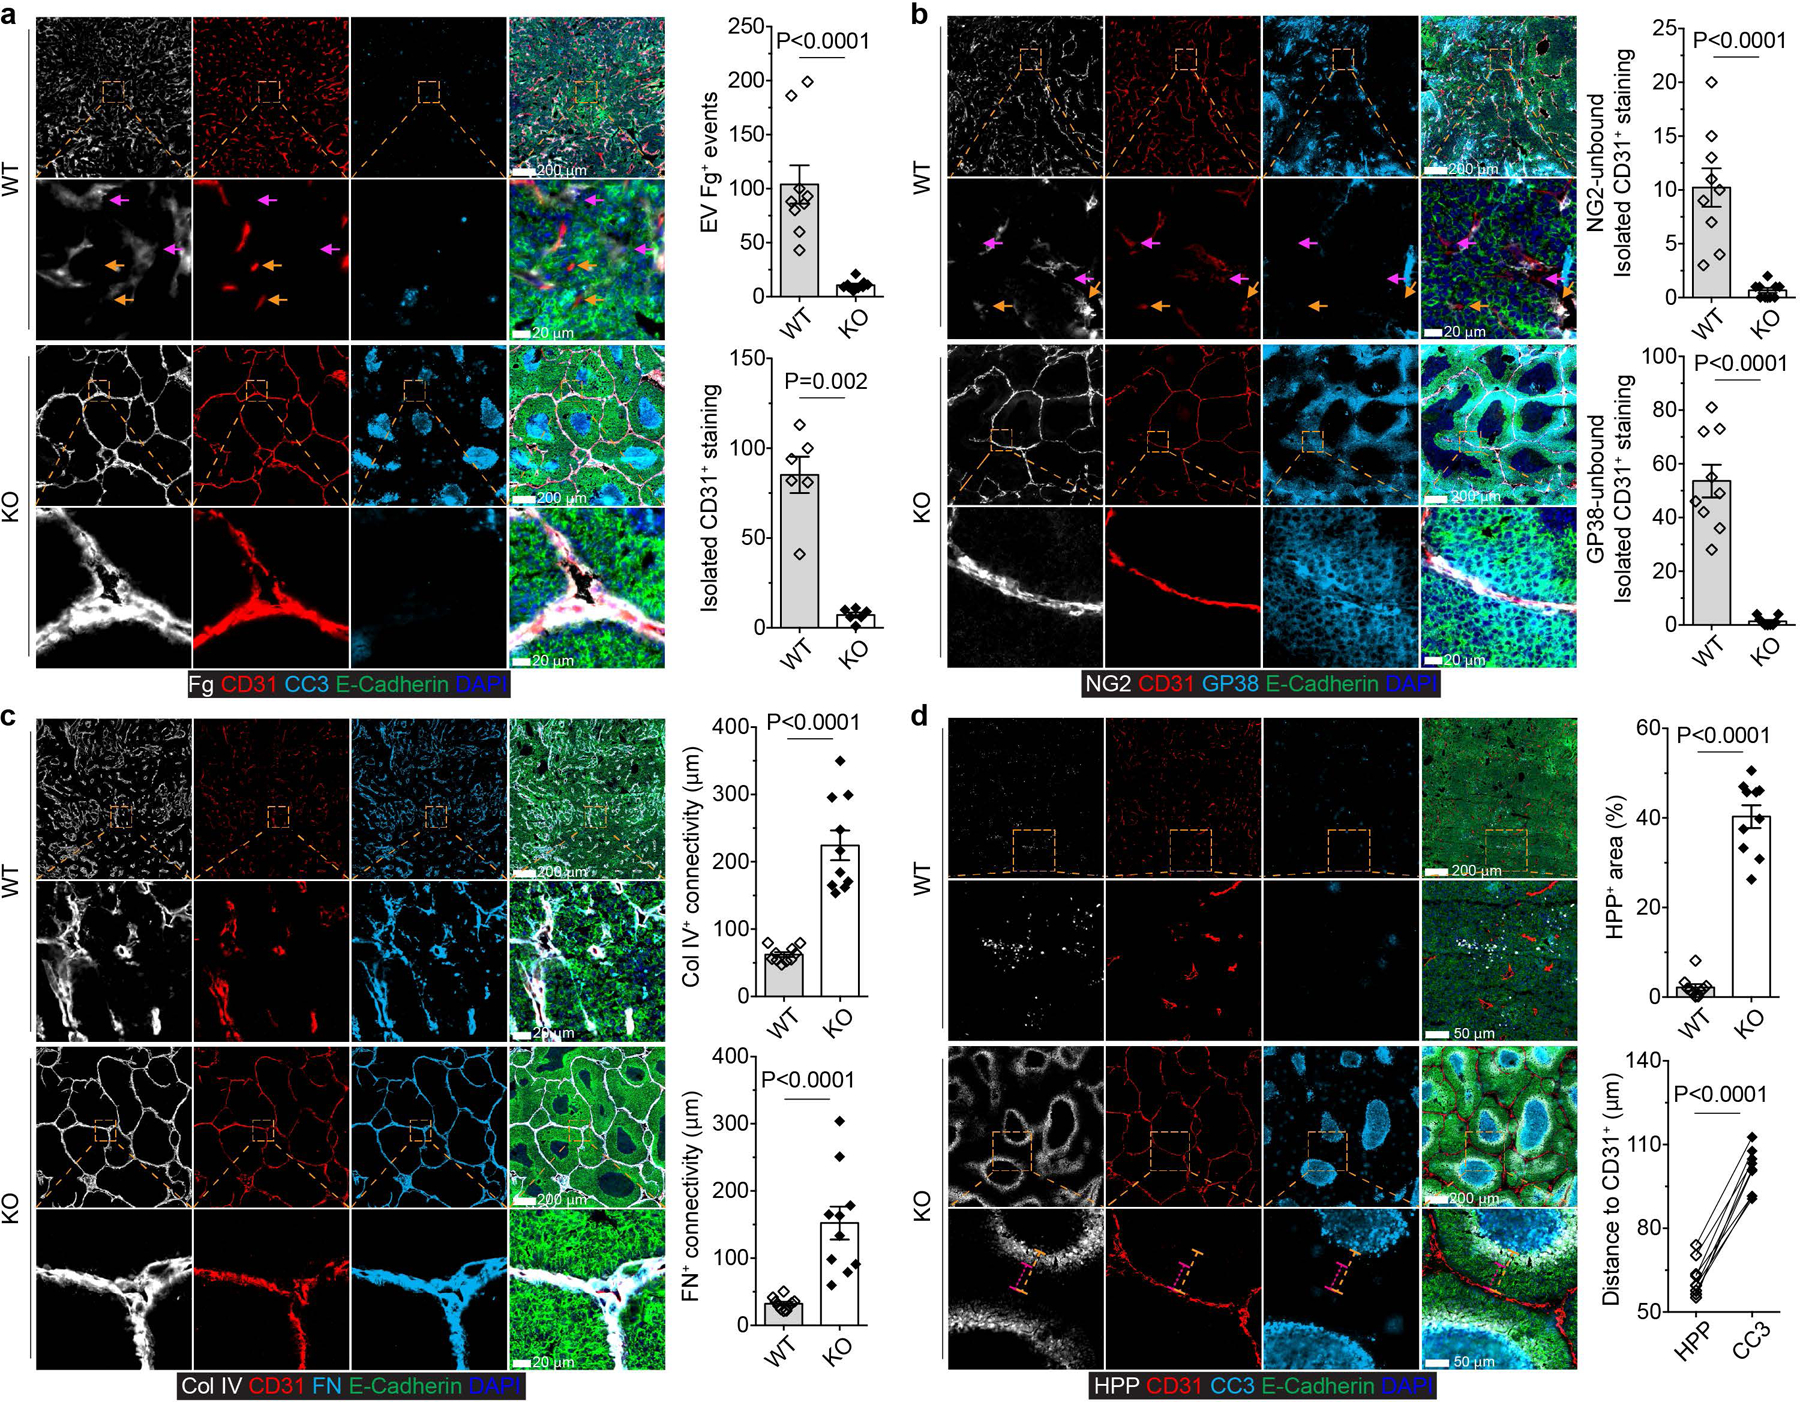
a, Representative immunofluorescence images of fibrinogen (Fg, white), CD31 (red), cleaved Caspase 3 (CC3, cyan) and E-Cadherin (green) in comparable individual tumors with sizes around 8×8 mm in length and width from 23-week-old Tgfbr2fl/flPyMT (wild-type, WT) and ThPOKCreTgfbr2fl/flPyMT (knockout, KO) mice. Extravascular (EV) Fg deposition events (magenta arrows) were calculated from 1 mm2 regions (n=9 for WT and KO tumor tissues). Isolated CD31+ staining (yellow arrows) was counted from 1 mm2 regions (n=6 for WT and KO tumor tissues). b, Representative immunofluorescence images of NG2 (white), CD31 (red), GP38 (cyan) and E-Cadherin (green) in tumors from WT and KO mice. NG2-unbound (magenta arrows) or GP38-unbound (yellow arrows) isolated CD31+ staining was counted from 1 mm2 regions (n=9 for WT and KO tumor tissues). c, Representative immunofluorescence images of collagen IV (Col IV, white), CD31 (red), fibronectin (FN, cyan) and E-Cadherin (green) in tumors from WT and KO mice. The average continuous lengths of Col IV and FN were measured in 1 mm2 regions (n=9 for WT and KO tumor tissues). d, Representative immunofluorescence images of a hypoxia probe (HPP, white), CD31 (red), CC3 (cyan) and E-Cadherin (green) in tumors from WT and KO mice. The percentage of HPP+E-Cadherin+ regions over E-Cadherin+ epithelial regions was calculated from 1 mm2 regions (n=9 for WT and KO tumor tissues). The shortest distance of HPP+ regions (magenta dashed lines) or CC3+ regions (yellow dashed lines) to CD31+ endothelial cells was measured in tumor tissues from KO mice (n=9). Data are represented as the mean ± SEM (biologically independent mice in a-d). Two-tailed unpaired (a-d) or paired (d) t-test. The dashed boxes coupled with dashed lines show high magnification of selected tissue regions.
Sprouting angiogenesis is induced in malignant tissues in response to hypoxia and metabolic stresses, which resupplies oxygen and nutrients to augment tumor growth18,19. Indeed, excessive vessel branching in tumors from Tgfbr2fl/flPyMT mice was associated with few hypoxic spots (Fig. 3d). In contrast, much larger areas were positive for the hypoxic probe in tumors from ThPOKCreTgfbr2fl/flPyMT mice (Fig. 3d). The hypoxic areas exhibited a circular pattern and were positioned approximately 60 µm inward from the adjacent vasculature and peripheral to the cancer cell death region (Fig. 3d). Three-dimensional microscopic imaging experiments revealed on average 0.0042 mm3 and 0.35 mm3 avascular regions in tumors from Tgfbr2fl/flPyMT and ThPOKCreTgfbr2fl/flPyMT mice, respectively (Supplementary Video 1-2 and Extended Data Fig. 4c). These observations are in line with the finding that tumors implanted to the avascular anterior chamber of rabbit eyes grow less than 0.5 mm3 with catastrophic cancer cell death detected in the tumor core20. Thus, blockage of TGF-β signaling in CD4+ T cells reconfigures the tumor vasculature with cancer cell hypoxia and death instigated in large avascular regions.
Type 2 immunity supports vessel remodeling
To define how TGF-βRII-deficient CD4+ T cells might reprogram the tumor microenvironment to fortify vasculature reorganization, we analyzed tumor-infiltrating T cells from Tgfbr2fl/flPyMT and ThPOKCreTgfbr2fl/flPyMT mice. Although tumor-associated CD4+Foxp3+ Treg cells were not significantly changed, conventional CD4+Foxp3- T cells expanded at the expense of CD8+ T cells in ThPOKCreTgfbr2fl/flPyMT mice (Extended Data Fig. 5). Importantly, Treg cell-specific ablation of Tgfbr2 with Foxp3Cre mice did not inhibit cancer progression (Fig. 1b), supporting that TGF-β targets helper T cells to promote tumor immune evasion.
TGF-β potently suppresses Th1 and Th2 cell differentiation13 characterized by IFN-γ and IL-4 expression, respectively. Indeed, increased frequencies of CD4+Foxp3- T cells from ThPOKCreTgfbr2fl/flPyMT mice produced IFN-γ and IL-4 (Fig. 4a). In transplantation cancer models, Th1 cells and IFN-γ promote pericyte coverage21 and vessel regression22. However, IFN-γ deficiency did not impair the enhanced CD4+ T cell response in ThPOKCreTgfbr2fl/flPyMT mice (Extended Data Fig. 6a-6b), nor was the vessel leakage and pattering phenotype affected (Extended Data Fig. 6c). Importantly, IFN-γ deficiency did not impair the hypoxia and cancer cell death response (Extended Data Fig. 6d), or the tumor repression phenotype (Fig. 4b). These observations exclude IFN-γ as a mediator of cancer immunity triggered by TGF-βRII-deficient CD4+ T cells.
Fig. 4 |. Cancer immunity triggered by blockage of TGF-β signaling in CD4+ T cells is dependent on IL-4, but not IFN-γ.
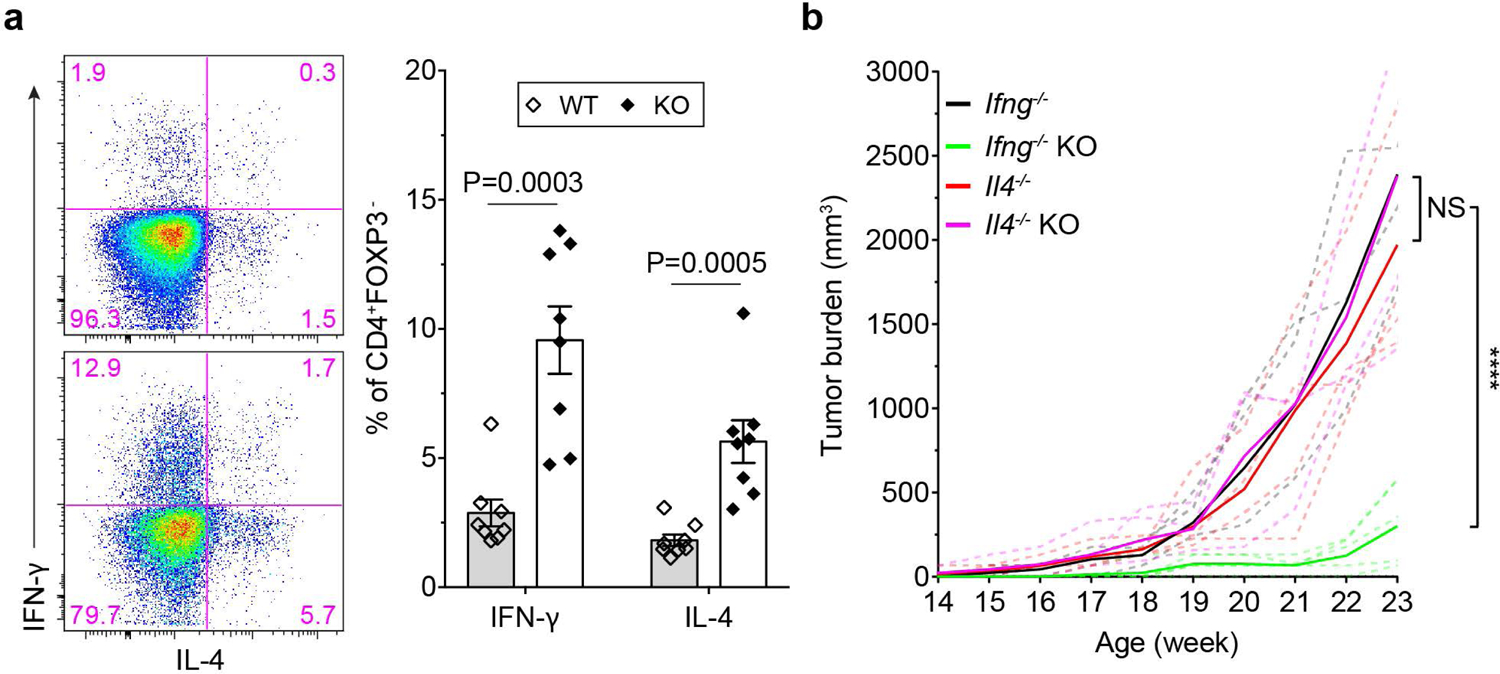
a, Representative flow cytometry plots and statistical analyses of IL-4 and IFN-γ expression in CD4+Foxp3- T cells from the tumor-draining lymph nodes of 23-week-old Tgfbr2fl/flPyMT (wild-type, WT; n=8) and ThPOKCreTgfbr2fl/flPyMT (knockout, KO; n=8) mice. Data are represented as the mean ± SEM (biologically independent mice). Two-tailed unpaired t-test. b, Tumor measurements of Ifng−/−Tgfbr2fl/flPyMT (Ifng−/−, n=5), Ifng−/−ThPOKCreTgfbr2fl/flPyMT (Ifng−/−KO, n=7), Il4−/−Tgfbr2fl/flPyMT (Il4−/−, n=5) and Il4−/−ThPOKCreTgfbr2fl/flPyMT (Il4−/−KO, n=6) mice. Dashed lines indicate tumor burden from individual mice and solid lines indicate mean of tumor burden from all mice in a group. ****: P<0.0001; and ns: not significant.
To probe a role of Th2 cells, we crossed ThPOKCreTgfbr2fl/flPyMT mice onto the IL-4-deficient background. IL-4 deficiency did not substantially affect activation of TGF-βRII-deficient CD4+ T cells in the tumor-draining lymph nodes, but their expansion in the tumor was attenuated (Extended Data Fig. 7a-7b). In contrast to Ifng−/−ThPOKCreTgfbr2fl/flPyMT mice, Il4−/−ThPOKCreTgfbr2fl/flPyMT mice had widespread extravascular deposition of fibrinogen associated with an irregularly shaped vasculature (Extended Data Fig. 7c). Furthermore, the hypoxia and cancer cell death phenotype observed in ThPOKCreTgfbr2fl/flPyMT mice was abolished in the absence of IL-4 (Extended Data Fig. 7d), concomitant with accelerated tumor growth (Fig. 4b). In adoptive cell transfer experiments, conventional CD4+ T cells from ThPOKCreTgfbr2fl/fl, but not Tgfbr2fl/fl, Il4−/−, or Il4−/−ThPOKCreTgfbr2fl/fl mice triggered cancer cell death and halted tumor growth in PyMT recipients (Extended Data Fig. 8a-8b). Furthermore, in an M38 model, tumor growth was suppressed in ThPOKCreTgfbr2fl/fl recipients in an IL-4-dependent manner (Extended Data Fig. 8c). Together, these findings reveal an essential function of IL-4 produced by TGF-βRII-deficient CD4+ T cells in reprogramming the tumor vasculature and inhibiting cancer progression.
A type 2 gene signature stratifies cancer risk
Aside from being a signature Th2 effector cytokine, IL-4 potently regulates T cell differentiation. To explore the TGF-β-regulated IL-4-dependent gene expression program in helper T cells, we isolated tumor-infiltrating CD4+CD25- T cells from Tgfbr2fl/flPyMT, ThPOKCreTgfbr2fl/flPyMT, Il4−/−PyMT, and Il4−/−ThPOKCreTgfbr2fl/flPyMT mice, and performed RNAseq experiments. Compared to wild-type T cells, TGF-βRII-deficient T cells upregulated and downregulated 919 and 1507 genes, respectively, among which 238 and 879 were dependent on IL-4 (Supplementary Table 1). We were particularly interested in transcripts induced in TGF-βRII-deficient T cells in an IL-4-depenent manner, as they might define the functional program of cancer suppression. Among these targets were those encoding co-stimulatory receptors and adhesion molecules such as Icam1, Il1r2, Il3ra, Tnfrsf18, and Tnfrs4; signaling molecules such as Jak3, Map2k3, Map3k10, Map3k11, Mapkapk2, Pik3c2b, Sh3bp2, and Zap70; calcium, glucose and amino acid transporters including Orai1, Slc2a1, Slc2a8, and Slc7a5; as well as glycolytic enzymes including Hk2, Ldha, Pgk1, and Pkm (Fig. 5), which may collectively promote expansion of TGF-βRII-deficient CD4+ T cells. In addition, a number of transcripts encoding secreted molecules were upregulated in TGF-βRII-deficient T cells in an IL-4-depenent manner, which comprised of Th2 cytokines Il13, Il4, and Il5 as well as type 2 effector molecules including Areg, Metrnl, R3hdml, and Retnlg (Fig. 5). In agreement with these observations, transcripts including Batf, Bhlhe40, and Pparg encoding transcription factors resided in major regulatory nodes of T cell activation and Th2 cell differentiation23 were induced in an IL-4-dependent manner in TGF-βRII-deficient T cells (Fig. 5). Collectively, these observations suggest that IL-4 promotes cancer immunity by engaging a positive feedback loop of Th2 cell regulation, although IL-4 targets other than T cells may also be involved.
Fig. 5 |. IL-4 promotes a Th2 cell gene expression program in TGF-βRII-deficient CD4+ T cells.
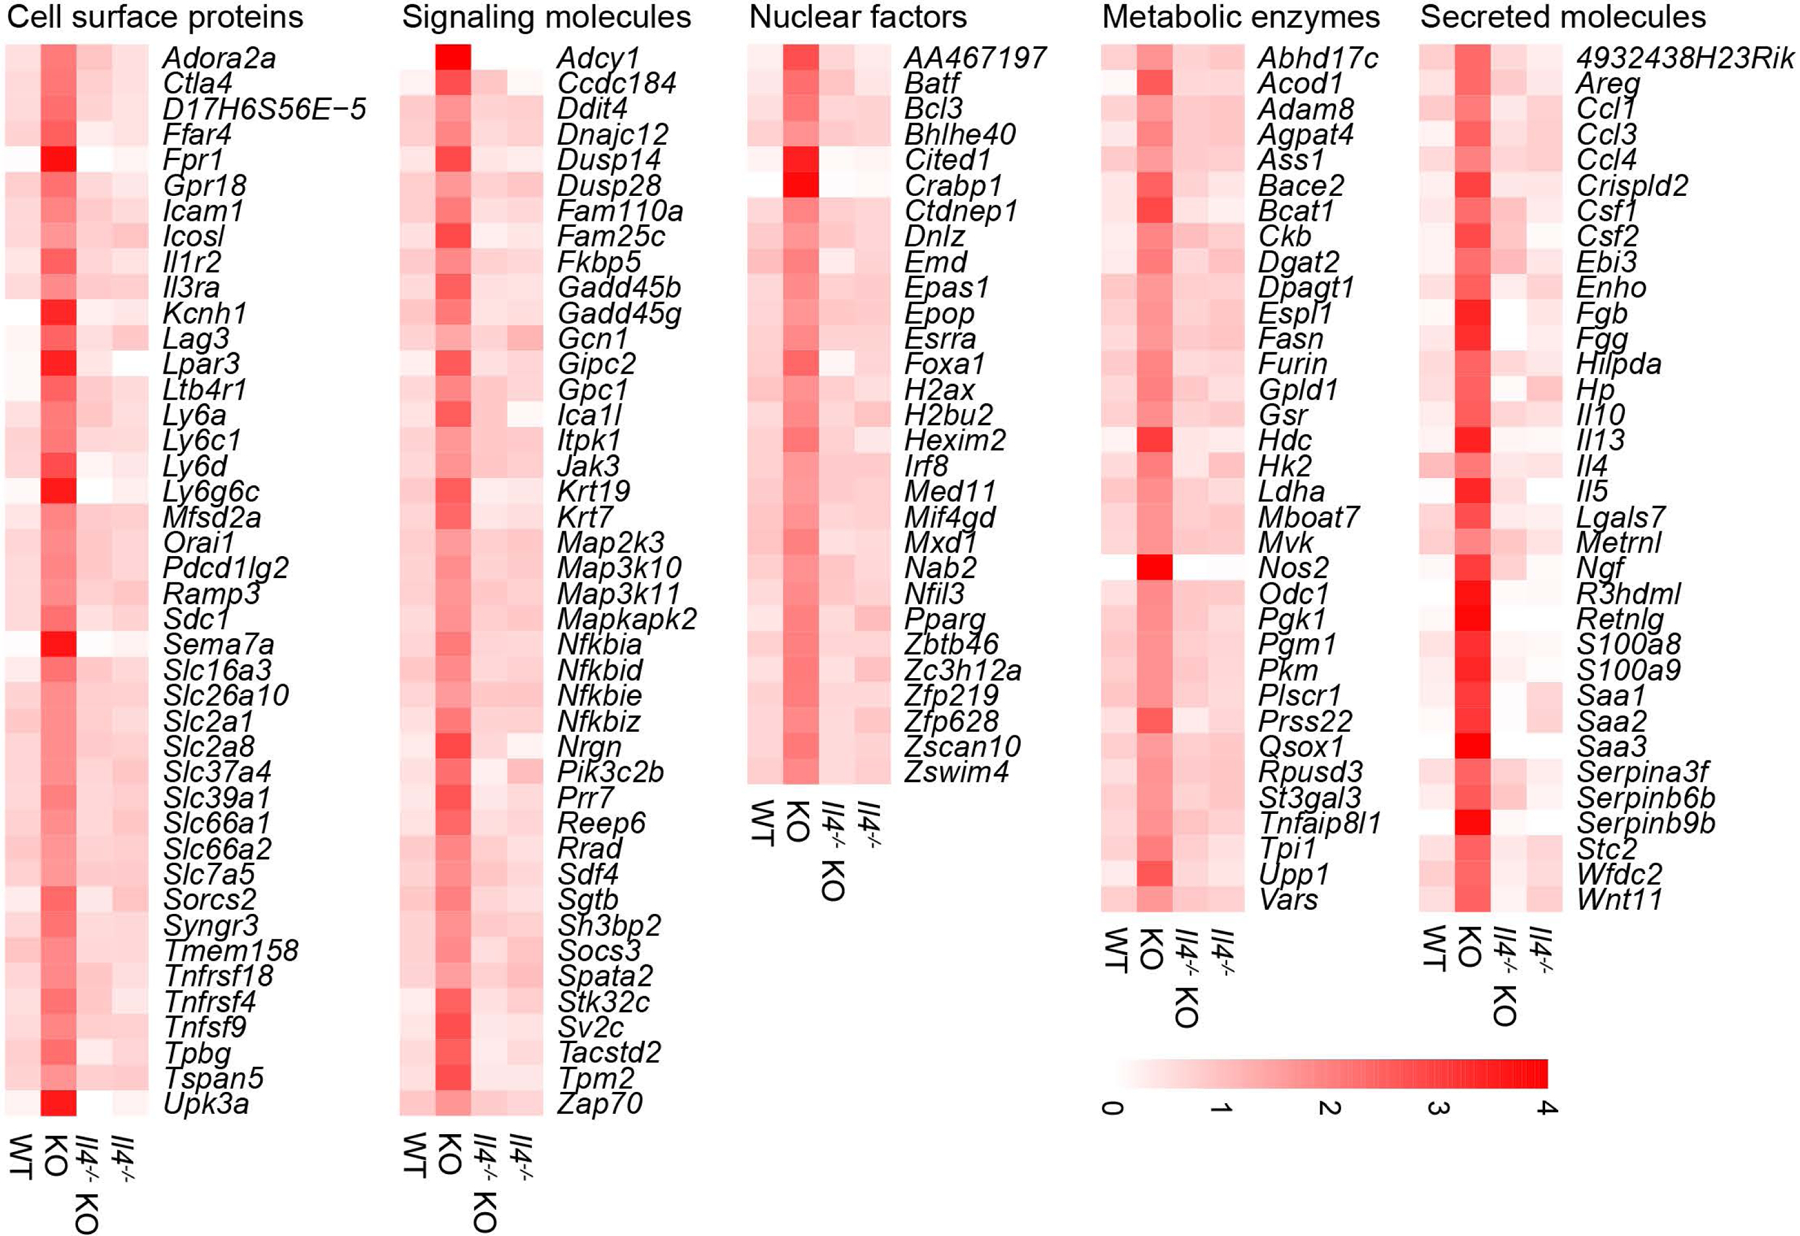
The transcriptome of tumor-infiltrating CD4+CD25- T cells from 23-week-old Tgfbr2fl/flPyMT (wild-type, WT), ThPOKCreTgfbr2fl/flPyMT (knockout, KO), Il4−/−Tgfbr2fl/flPyMT (Il4−/−) and Il4−/−ThPOKCreTgfbr2fl/flPyMT (Il4−/−KO) mice were assessed by RNA sequencing. The mean expression FPKM value of differentially expressed genes (DEGs) that were upregulated in KO compared to WT or Il4−/−KO samples were calculated and plotted. The ratio between mean FPKM value of one group and average of mean FPKM values of all 4 groups were further calculated. Representative DEGs were grouped based on the localization and function of their encoded proteins.
To determine whether type 2 immune responses suppress tumor development in human patients, we refined the TGF-β-regulated IL-4-dependent target genes by excluding transcripts abundant in non-hematopoietic cancer cell lines, tumor-infiltrating myeloid cells or type 1 lymphocytes, and derived a putative type 2 immune signature consisting of 28 genes (Supplementary Table 2). Notably, when applied to a pan-cancer gene expression database, the signature stratified patients for survival probability (Extended Data Fig. 9a). In fact, clinically indolent cancers, such as pheochromocytoma and paraganglioma (PCPG), were among the cancer types with highest gene signature value, while aggressive cancers including esophageal carcinoma (ESCA) had low scores (Extended Data Fig. 9b). Likewise, clinically less aggressive low grade glioma (LGG) or kidney chromophobe (KICH) had higher signature scores than ontologically related glioblastoma multiforme (GBM) or kidney renal clear cell carcinoma (KIRC) (Extended Data Fig. 9b), and their signature values further stratified patients for better survival probability (Extended Data Fig. 9c). Histological analysis revealed that compared to KIRC, KICH had a more organized vasculature with discernable stromal demarcation and lower isolated CD31 staining (Extended Data Fig. 9d). These findings imply a prominent role for type 2 immunity in restraining angiogenesis and tumor progression in subsets of cancer patients.
Discussion
TGF-β is a pleiotropic regulator of numerous pathophysiological processes including carcinogenesis and immune responses. Herein, we uncovered a crucial role of TGF-β signaling in repressing Th2 cell responses that reprogram the tumor vasculature and suppress cancer progression (Extended Data Fig. 10). These findings question the prominent view of pro-tumor functions of type 2 immunity revealed, for instance, in models of cancer cell lung colonization24,25, but are in agreement with the anti-tumor effects of ectopically administered Th2 cells or overexpression of the Th2 cell-polarizing alarmin TSLP26–28. Enhanced activation of TGF-βRII-deficient CD4+ T cells in tumor-draining lymph nodes and their tumor stroma localization are in line with the finding that TGF-β1 produced by CD4+ T cells, but not cancer cells, suppresses cancer immunity12,29,30; yet, the antigens and accessory signals that promote Th2 cell polarization remain to be determined. Type 2 effector mechanisms that promote vasculature remodeling are also open for future investigation. Notably, in a rat corneal neovascularization model, administration of IL-4 potently suppresses angiogenesis31. Furthermore, “tumor-promoting inflammation”, considered as a cancer enabling characteristic32, can be proangiogenic, and the broad tumor immune cell exclusion phenotype observed in ThPOKCreTgfbr2fl/flPyMT mice may as well contribute to vasculature reorganization consequent to the inflammation-resolving activities of Th2 cells. Interestingly, a similar tumor immune cell exclusion phenotype was observed in a subset of human breast cancer patients33, which is associated with expansion of CD4+ T cells and, importantly, predicts better patient survival. Thus, type 2 immunity can be a general cancer defense strategy at the tissue-level34,35, and pharmacological inhibition of TGF-β signaling in helper T cells (cite accompanying paper from Li S et al.) may define a novel cancer environment immunotherapy approach.
Methods
Mice.
CD8−/−, Ifng−/−, Il4−/− and YFP mice were purchased from the Jackson Laboratory. ThPOKCre mice were previously reported36. CD8Cre, Foxp3Cre, Tgfrbr2fl/fl and MMTV-PyMT (PyMT) mice were maintained in the laboratory as previously described37–39. All mice were backcrossed to the C57BL/6 background, and maintained under specific pathogen-free conditions. Animal experimentation was conducted in accordance with procedures approved by the Institutional Animal Care and Use Committee of Memorial Sloan Kettering Cancer Center. We have complied with all relevant ethical regulations for animal use.
Tumor measurement.
Starting from 13-week of age, mammary tumors in female PyMT mice were measured weekly with a caliper. For CD4+ T cell depletion, 500 µg anti-CD4 (BioXcell) was intraperitoneally injected into tumor-bearing mice twice a week. Tumor burden was calculated using the equation [(LxW2) x (π/6)], in which L and W denote length and width. Total tumor burden was calculated by summing up individual tumor volumes of each mouse with an end-point defined when total burden reached 3,000 mm3 or one tumor reached 2,000 mm3, typically around 23-week of age. MC38 cells were a gift from Dr. Jedd Wolchok40. 0.5 million MC38 cells were transplanted subcutaneously into Tgfbr2fl/fl and ThPOKCreTgfbr2fl/fl mice followed or not by twice a week treatment with 100 µg anti-IFN-γ (XMG1.2) or anti-IL-4 (11B11). Tumor growth was monitored. Researchers were blinded to genotypes of mice during measurements.
Leukocyte isolation.
Single-cell suspensions were prepared from lymph nodes by tissue disruption with glass slides. The dissociated cells were passed through 70 µm filters and pelleted. Tumor-infiltrating immune cells were isolated from mammary tumors as previously described41. Briefly, tumor tissues were minced with a razor blade, and digested in 280 U/mL Collagenase Type 3 (Worthington Biochemical) and 4 µg/mL DNase I (Sigma) in HBSS at 37°C for 1 h and 15 min with periodic vortex every 20 min. Digested tissues were passed through 70 µm filters and pelleted. Cells were resuspended in 40% Percoll (Sigma) and layered above 60% Percoll. Sample was centrifuged at 1,900 g at 4°C for 30 min without brake. Cells at interface were collected and used for flow cytometry analysis or sorting.
Flow cytometry.
Fluorochrome-conjugated antibodies against mouse CD25 (Car. 11–0251-82; clone PC61.5; dilution 1:200), CD44 (Cat. 45–0411-80; clone IM7; dilution 1:1000), CD62L (Cat. 17–0621-81; clone MEL-14; dilution 1:800), Foxp3 (Cat. 72–5775-40; clone FJK-16s; dilution 1:300), IFN-γ (Cat. 48–7311-82; clone XMG1.2; dilution 1:300), IL-4 (Cat. 25–7042-41; clone BVD6–24G2; dilution 1:100), NK1.1 (Cat. 25–5941-82; clone PK136; dilution 1:300), PD-1 (Cat. 11–9981-82; clone RMP1–130; dilution 1:200), TCRγδ (Cat. 46–5711-82; clone eBioGL3; dilution 1:200) were purchased from eBioscience. Antibody against mouse CD45 (Cat. 563053; clone 30-F11; dilution 1:400), TCRβ (Cat. 563135; clone H57–595; dilution 1:400), CD4 (Cat. 563727; clone RM4–5; dilution 1:300), CD8 (Cat. 563254; clone 53–6.7; dilution 1:100), were from BD Biosciences. Antibody against granzyme B (Cat. GRB05; clone GB11; dilution 1:100) was obtained from Invitrogen. All antibodies were tested with their respective isotype controls. Cell-surface staining was conducted by incubating cells with antibodies for 30 min on ice in the presence of 2.4G2 mAb to block FcγR binding. For Foxp3 and granzyme B staining, a transcription factor-staining kit (Tonbo Biosciences) was used. To assess cytokine production, T cells were stimulated with 50 ng/mL phorbol 12-myristate 13-acetate (Sigma), 1 mM ionomycin (Sigma) in the presence of Golgi-Stop (BD Biosciences) for 4 h at 37°C as previously described42. T cells were subsequently stained for cell surface markers before intracellular cytokine staining. All data were acquired using an LSRII flow cytometer (Becton Dickinson) and analyzed with FlowJo software (Tree Star, Inc.).
Cell sorting, RNA extraction and sequencing.
T cells were FACS sorted to Trizol LS (Invitrogen) and snap frozen in liquid nitrogen. RNA was prepared with a miRNeasy Mini Kit according to the manufacturer’s instructions (Qiagen), and subject to quality control by Agilent BioAnalyzer. 0.7–1 ng total RNA with an integrity index from 8.3 to 9.9 was amplified using the SMART-Seq v4 Ultra Low Input RNA Kit (Clontech), with 12 cycles of amplification. 2.7 ng of amplified cDNA was used to prepare libraries with the KAPA Hyper Prep Kit (Kapa Biosystems KK8504). Samples were barcoded and used for 50bp/50bp paired end runs with the TruSeq SBS Kit v4 (Illumina) on a HiSeq 2500 sequencer. An average of 45 million paired reads were generated per sample. The percentage of mRNA bases per sample ranged from 75% to 81%.
Transcriptome analysis of differentially expressed genes.
The raw sequencing FASTQ files were aligned against the mm10 assembly by STAR43. Gene level count values were computed by the summarizeOverlaps function from the R package “GenomicAlignments” with mm10 KnownGene as the base gene model for mouse samples44,45. The Union counting mode was used and only mapped paired-reads were considered. FPKM (Fragments Per Kilobase Million) values were then computed from gene level counts by using fpkm function from the R package DESeq2 (Ref46). Differentially expressed gene analysis was performed through the R DESeq2 package. Given the raw count data and gene model used, DESeq2 normalized the expression raw count data by sample specific size factor and took specified covariates into account while testing for genes found with significantly different expression between 2 sample groups. The comparisons included ThPOKCreTgfbr2fl/flPyMT (KO) group vs. Tgfbr2fl/flPyMT (WT) group, KO group vs. Il4−/−ThPOKCreTgfbr2fl/flPyMT (Il4−/−KO) group, Il4−/−KO group vs. Il4−/−Tgfbr2fl/flPyMT (Il4−/−) group, and Il4−/−KO group vs. WT group. The “log2FoldChange” column is the log2 value of the ratio between target sample group and the reference sample group. Differentially expressed genes were included if passed the following filters: baseMean > 50; Log2Foldchange > 0.9 or < −0.9 (depending on the desired direction) and P value < 0.11. For heatmap generation, the mean expression FPKM value in each mouse sample group was calculated. The ratio between the sample group specific mean expression FPKM value and the average of 4 sample group mean expression FPKM values was used and plotted in the heatmap through the R heatmap package.
Gene signature building.
The differentially expressed genes in the same regulation direction from comparing ThPOKCreTgfbr2fl/flPyMT (KO) group vs. Tgfbr2fl/flPyMT (WT) group and KO group vs. Il4−/−ThPOKCreTgfbr2fl/flPyMT (Il4−/−KO) group were subjected for human homologous gene search. The corresponding human homologous gene of mouse gene was identified through referencing the Mouse Genome Informatics (MGI, http://www.informatics.jax.org/) database as well as the NCBI Orthologs database (ftp://ftp.ncbi.nlm.nih.gov/gene/DATA/gene_orthologs.gz). Any mouse gene with missing human homolog was excluded from building the human gene signature. Any human gene found with expression greater than 25 FPKM in any non-hematopoietic Cancer Cell Line sample from Broad Institute (https://portals.broadinstitute.org/ccle) or with expression greater than 25 FPKM in any follow cytometry-sorted human RCC-infiltrated myeloid and type 1 lymphocyte samples were excluded from the signature building.
Gene signature applied to TCGA Pan cancer cohort.
Single-Sample Gene Set Enrichment Analysis (ssGSEA) was done by applying the gene signature against the FPKM expression values of TCGA Pan cancer samples through the R package “GSVA” which estimates the signature enrichment score for each of RNASeq sample47. The TCGA Pan cancer cohort data were downloaded from the GDC (https://gdc.cancer.gov/aboutdata/publications/pancanatlas) including RNA-seq expression matrix as well as the clinical data resource file.
Survival analysis K-M plot.
Survival analyses and curves were performed and generated according to the Kaplan–Meier method using SAS v.9.4 (SAS Institute Inc., Cary, North Carolina). The log-rank test was used to determine the statistical significance of the overall survival (OS) distributions between signature high and signature low groups defined by the median signature ssGSEA score in TCGA Pan cancer cohort.
Immunofluorescence staining.
Antibodies against mouse CD31 (Cat. 102516; clone MEC13.3; dilution 1:100), CD3 (Cat. 100240; clone 17A2; dilution 1:100), CD4 (Cat. 100530; clone RM4–5; dilution 1:100) and GP38 (Cat. 127408; clone 8.1.1; dilution 1:200) were purchased from Biolegend. Antibody against mouse CD45 (Cat. 553079; clone 30-F11; dilution 1:200) was from BD Pharmingen. Antibodies against mouse Col IV (Cat. 2150–1470; dilution 1:200), Fibrinogen (Cat. 4440–8004; dilution 1:200) were obtained from Bio-rad. Antibody against mouse Fibronectin (Cat. AB2033; dilution 1:100) and NG2 (Cat. AB5320; dilution 1:200) were from EMD. Antibody against mouse Cleaved caspase 3 (Cat. 9661S; dilution 1:200) was purchased from CST. Antibodies against mouse E-Cadherin (Cat. 53–3249-82; clone DECMA-1; dilution 1:100) and Ki67 (Cat. 41–5698-10; clone SolA15; dilution 1:300) were obtained from eBioscience. Antibodies against human E-Cadherin (Cat. ab40772; clone EP700Y; dilution 1:200) and CD31 (Cat. ab76533; clone EPR3094; dilution 1:200) were purchased from Abcam. Hypoxia detection kit was purchased from Hypoxyprobe. Mouse tumor tissues with comparable size from control and experimental groups were frozen in O.C.T. medium (Sakura Finetek USA) and sectioned at the thickness of 10 µm, before they were fixed and stained with antibodies or probes. Immunofluorescence images were analyzed with CaseViewer and Fiji software. For three-dimensional confocal microscopic imaging, tumor tissues were collected and fixed in 4% PFA over night at 4°C. Tumor tissues were permeabilized, blocked and stained with anti-CD31, cleared in Cubic solution, and immediately imaged in Leica SP5 inverted confocal microscope. Acquired images were analyzed and processed in LAS AF Lite and Imaris. The volume of CD31-depleted avascular tumor regions were calculated with the equation: [(LxW2) x (4/3) x π]. Human clear cell and chromophobe renal cell carcinoma paraffin sections with 5 µm thickness were dewaxed, rehydrated, blocked and stained with antibodies. All renal cell carcinoma samples were collected from patients who had provided informed consent, and all the related procedures were performed with the approval from Institutional Review Board of Memorial Sloan Kettering Cancer Center. We have complied with all relevant ethical regulations for human research participants. Slide sections were mounted with VECTORSHIELD anti-fade mounting media (Vector Laboratories) and scanned by Pannoramic Digital Slide Scanners (3DHISTECH LTD).
T cell activation and adoptive T cell transfer.
CD4+CD25- T cells isolated from Tgfbr2fl/fl, ThPOKCreTgfbr2fl/fl, Il4−/−Tgfbr2fl/fl and Il4−/−ThPOKCreTgfbr2fl/fl mice were activated with plate-bound anti-CD3 (Bio X Cell; Cat. BP-0001–1; clone 145–2C11; working concentration 5 µg/mL) and soluble anti-CD28 (Bio X Cell; Cat. BE0015–1; Clone 37.51; working concentration 1 µg/mL) for 24 h. One million T cells were intravenously transferred to tumor-bearing PyMT mice on a weekly basis.
Sulfo-NHS-biotin labeling.
Deeply anesthetized mice were perfused with 10 mL Sulfo-NHS-LC-Biotin (Thermo Scientific; 21335) dissolved in PBS at 0.3 mg/mL, followed by 10 mL 2% PFA in PBS as previously described48.
Statistical analysis.
Related to Fig. 5 and Supplementary Table 1, differentially expressed genes were compared between tumor-infiltrating CD4+CD25- T cells from Tgfbr2fl/flPyMT, ThPOKCreTgfbr2fl/flPyMT, Il4−/−Tgfbr2fl/flPyMT, and Il4−/−ThPOKCreTgfbr2fl/flPyMT mice. A gene list was generated if passing the filters mentioned above. All statistical measurements are displayed as mean ± SEM. For comparisons, two-tailed unpaired student t-test was conducted using GraphPad Prism software; for paired distance comparisons, paired t-test was conducted using GraphPad Prism software.
Reporting Summary
Further information on research design is available in the Nature Research Reporting Summary linked to this paper.
Extended Data
Extended Data Fig. 1 |. Blockage of TGF-β signaling in CD8+ T cells impacts their activation and differentiation.
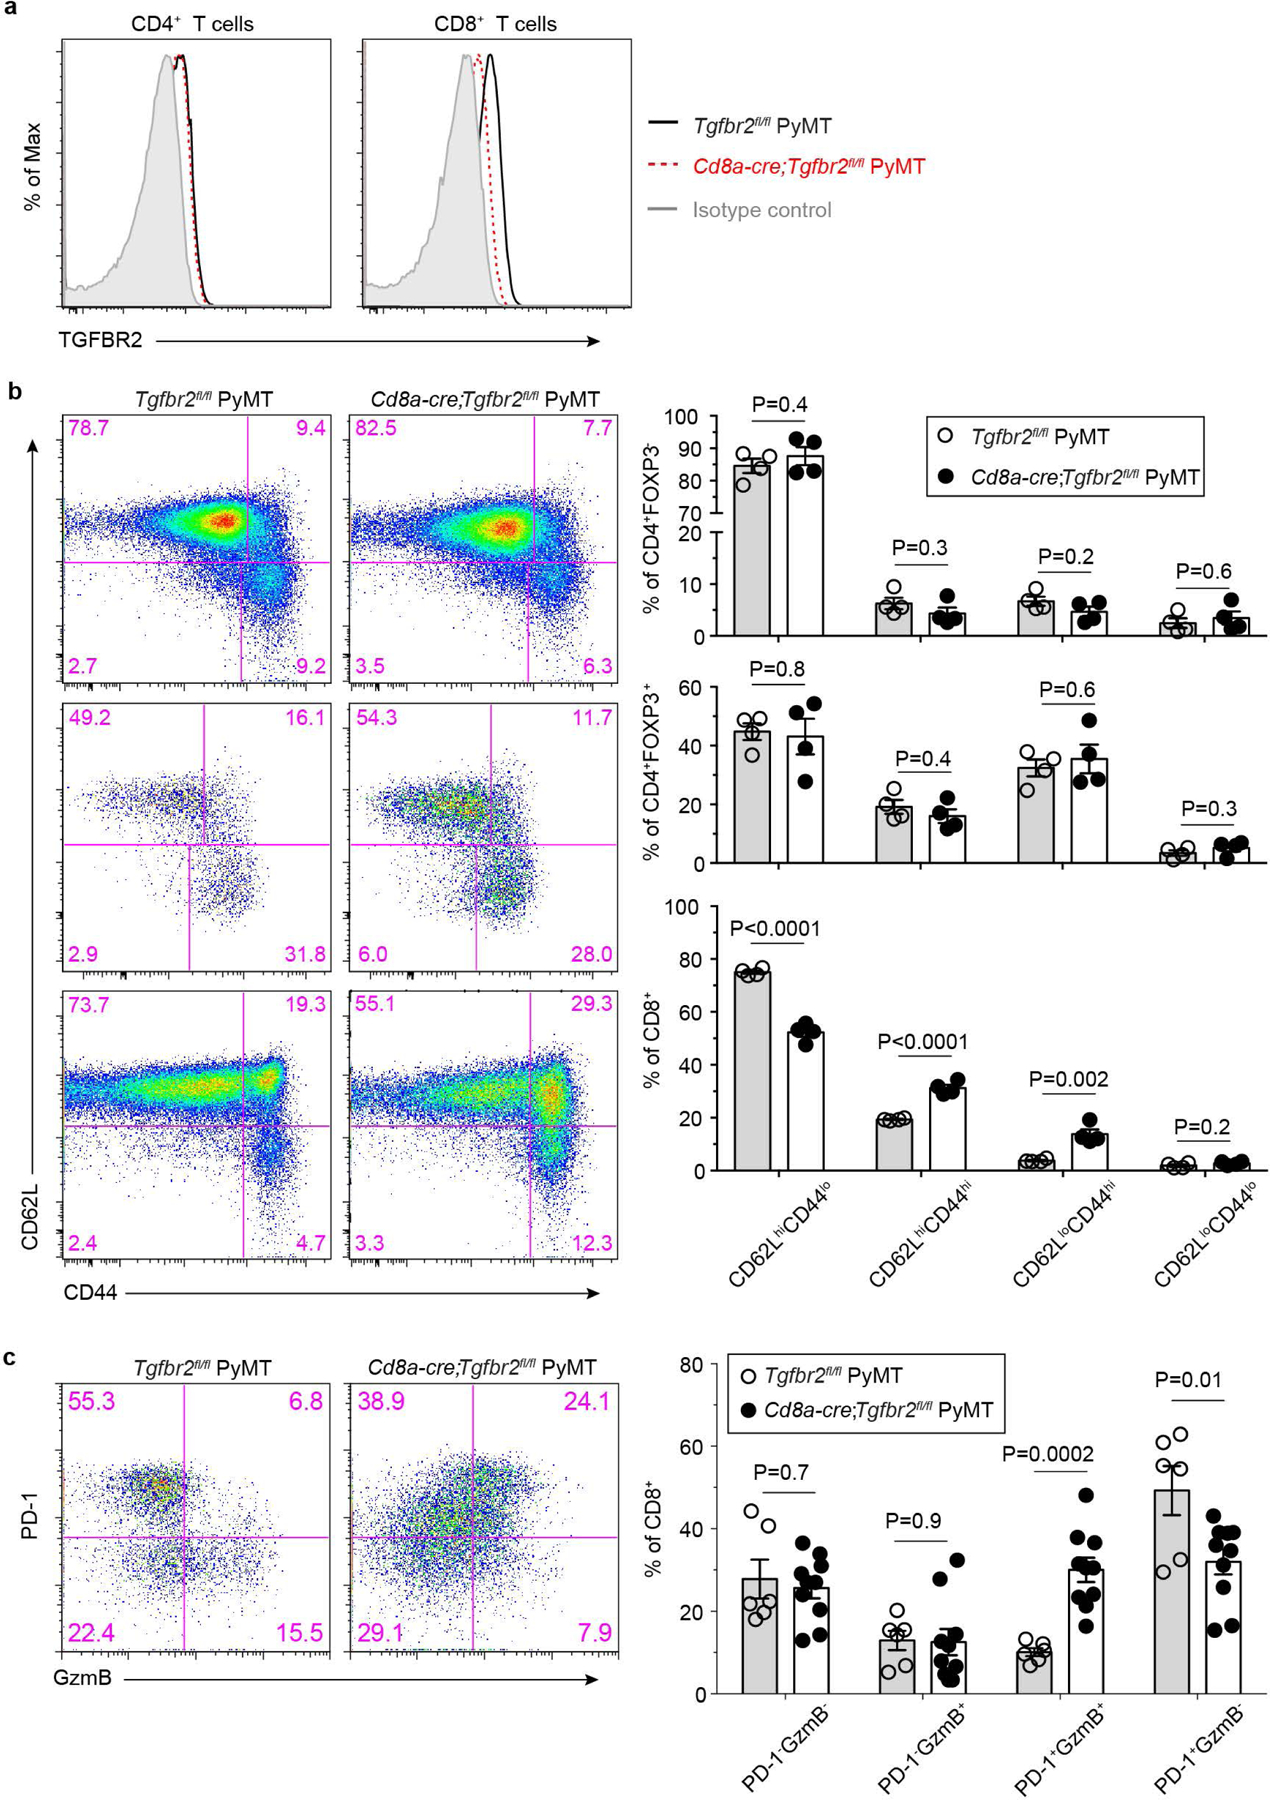
a, Representative flow cytometry plots showing transforming growth factor-β receptor II (TGF-βRII) expression on CD4+ T cells and CD8+ T cells from the tumor-draining lymph nodes of Tgfbr2fl/flPyMT and CD8CreTgfbr2fl/flPyMT mice. The experiments were performed independently three times with similar results. b, Representative flow cytometry plots of CD62L and CD44 expression and statistical analyses of the gated populations among CD4+Foxp3- T cells (top panel), CD4+Foxp3+ T cells (middle panel) and CD8+ T cells (bottom panel) from the tumor-draining lymph nodes of Tgfbr2fl/flPyMT (n=4) and CD8CreTgfbr2fl/flPyMT (n=4) mice. c, Representative flow cytometry plots and statistical analyses of programmed cell death protein 1 (PD-1) and granzyme B (GzmB) expression in tumor-infiltrating CD8+ T cells from Tgfbr2fl/flPyMT (n=6) and CD8CreTgfbr2fl/flPyMT (n=10) mice. Data are represented as the mean ± SEM (biologically independent mice in b, c). Two-tailed unpaired t-test (b, c).
Extended Data Fig. 2 |. Blockage of TGF-β signaling in CD4+ T cells impacts their activation and differentiation and represses tumor growth.
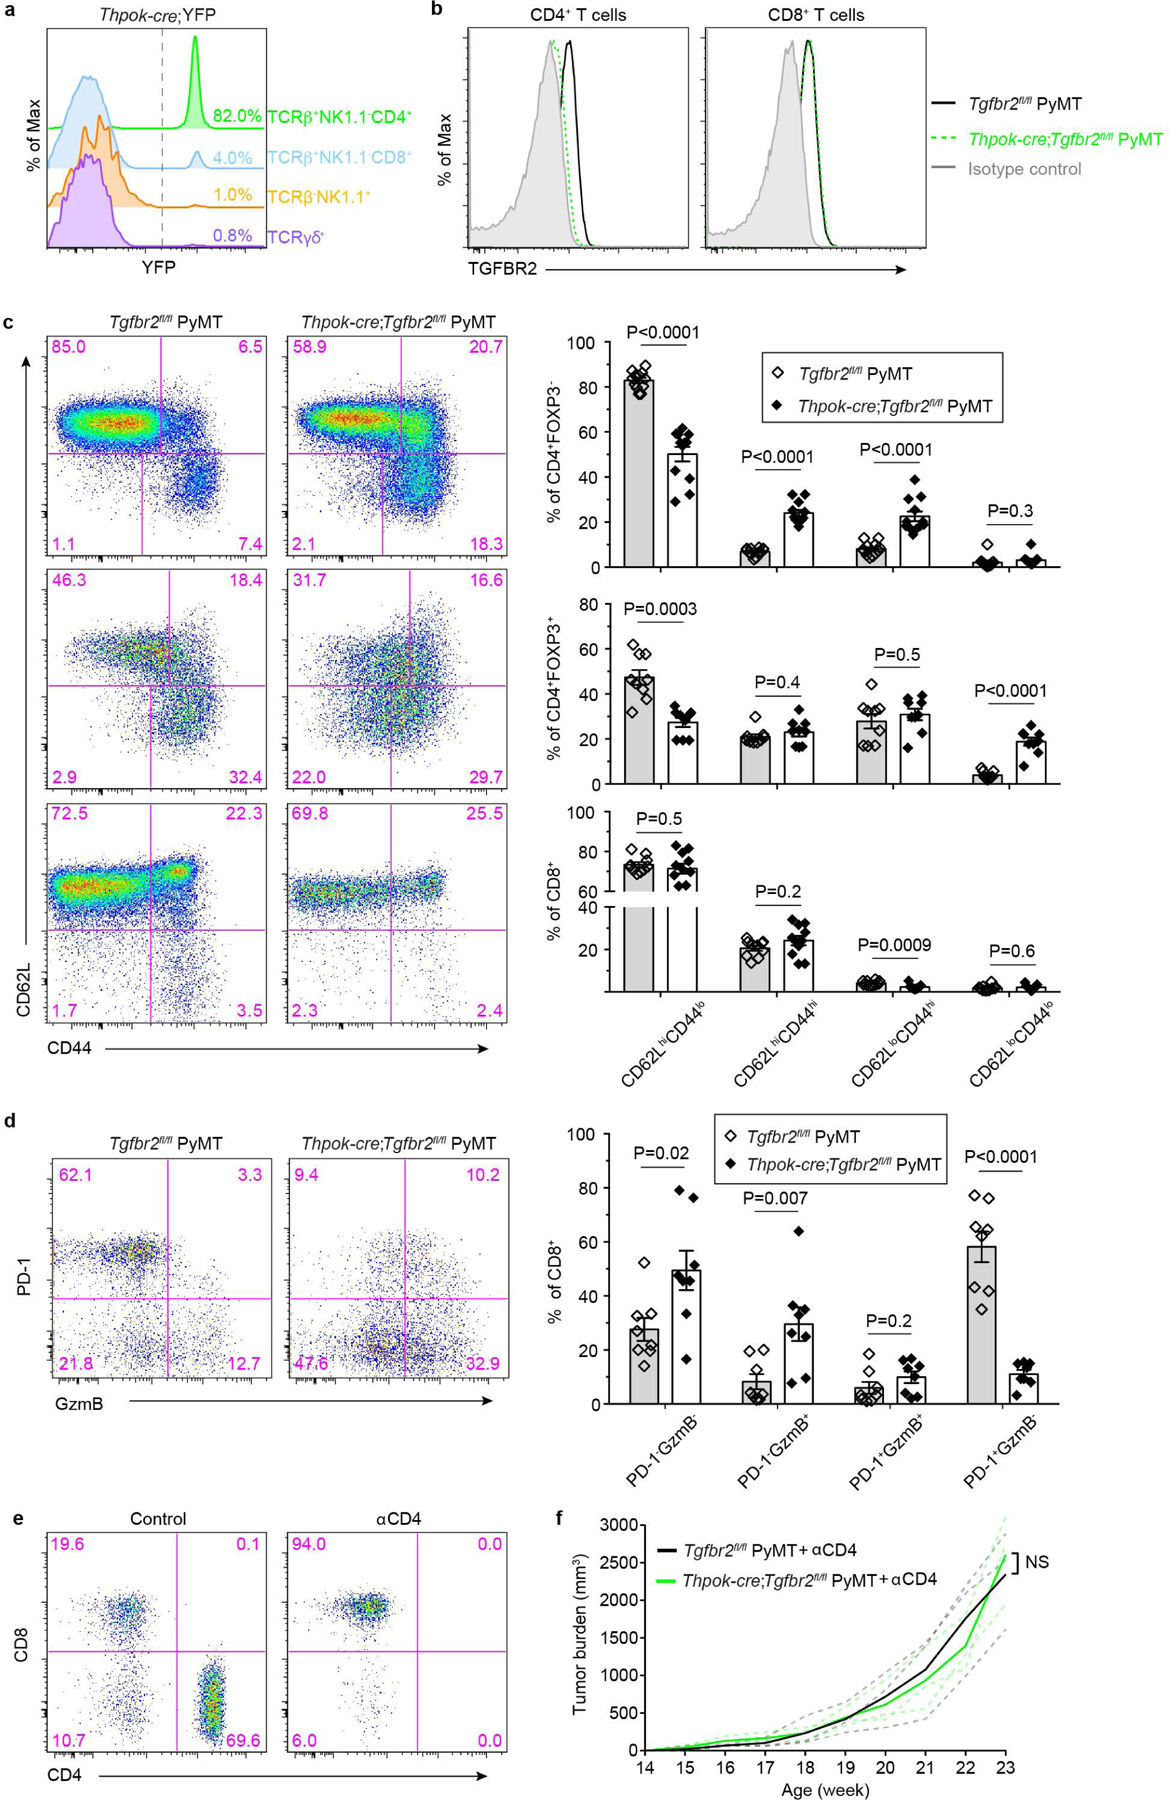
a, Representative flow cytometry plots of YFP expression in lymph node TCRb+NK1.1-CD4+, TCRb+NK1.1-CD8+, TCRb-NK1.1+ and TCRγδ+ T cells isolated from ThPOKCreYFP mice. The experiments were performed independently three times with similar results. b, Transforming growth factor-β receptor II (TGF-βRII) expression on CD4+ T cells and CD8+ T cells from the tumor-draining lymph nodes of Tgfbr2fl/flPyMT and ThPOKCreTgfbr2fl/flPyMT mice. The experiments were performed independently three times with similar results. c, Representative flow cytometry plots of CD62L and CD44 expression and statistical analyses of the gated populations among CD4+Foxp3- T cells (top panel), CD4+Foxp3+ T cells (middle panel) and CD8+ T cells (bottom panel) from the tumor-draining lymph nodes of Tgfbr2fl/flPyMT (wild-type, WT; n=9) and ThPOKCreTgfbr2fl/flPyMT (knockout, KO; n=8) mice. d, Representative flow cytometry plots and statistical analyses of programmed cell death protein 1 (PD-1) and granzyme B (GzmB) expression in tumor-infiltrating CD8+ T cells from Tgfbr2fl/flPyMT (n=8) and ThPOKCreTgfbr2fl/flPyMT (n=8) mice. e, Representative flow cytometry plots of CD4 and CD8 expression in T cells from control mice or mice treated with anti-CD4 (αCD4). The experiments were performed independently twice with similar results. f, Tumor measurements of WT (n=3) and KO (n=3) mice treated with αCD4. Dashed line denote tumor burden of individual mice and solid lines indicate mean of tumor burden in a group of mice. Data are represented as the mean ± SEM (biologically independent mice in c, d). Two-tailed unpaired t-test (c, d, f). ns: not significant.
Extended Data Fig. 3 |. CD8 deficiency does not affect cancer cell death triggered by blockage of TGF-β signaling in CD4+ T cells.
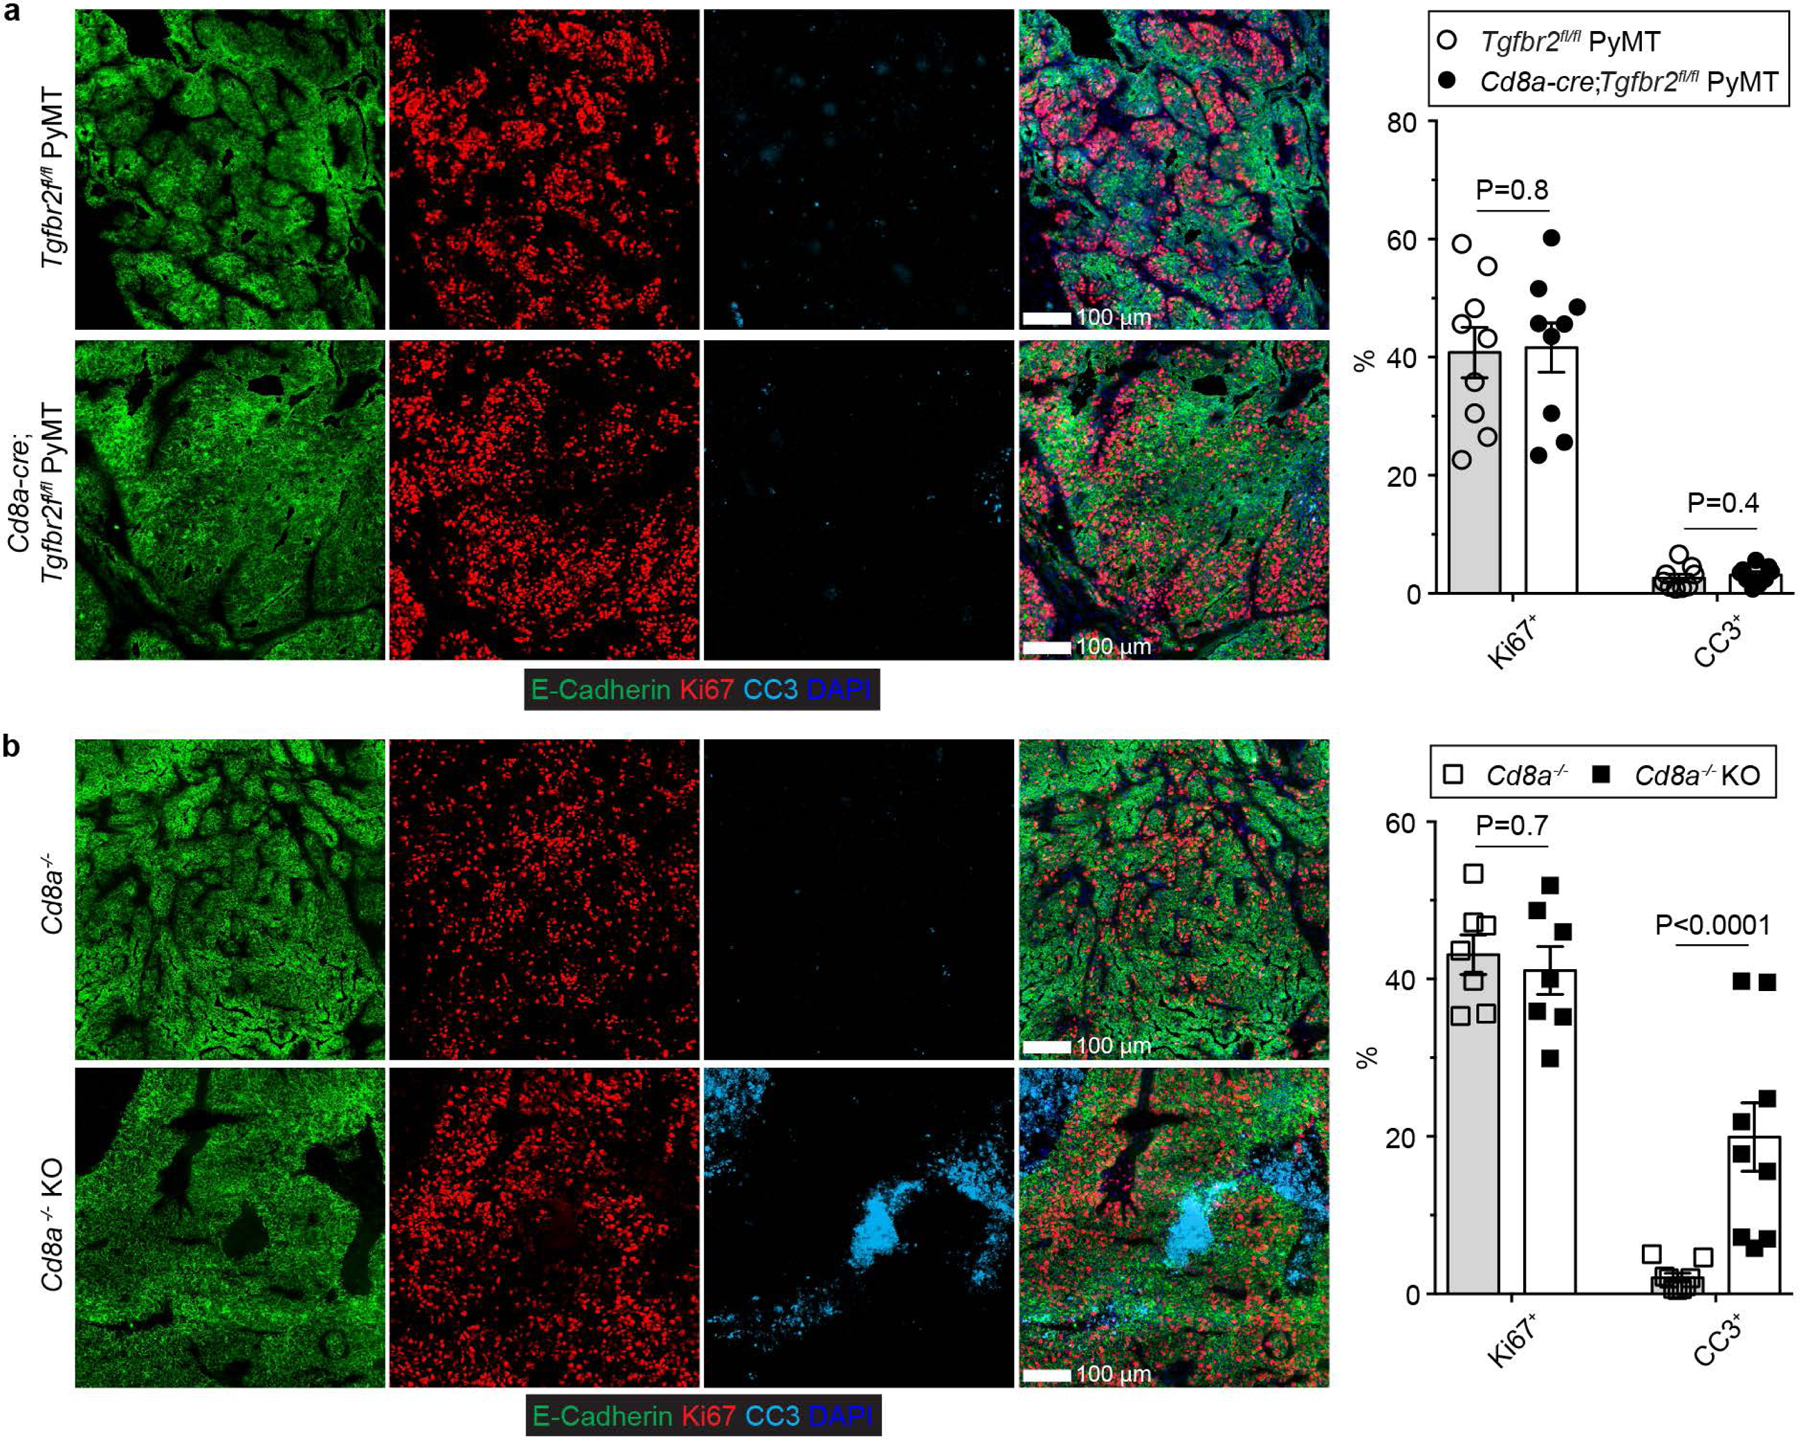
a, Representative immunofluorescence images of E-Cadherin (green), Ki67 (red) and cleaved Caspase 3 (CC3, cyan) in tumor tissues from 23-week-old Tgfbr2fl/flPyMT and CD8CreTgfbr2fl/flPyMT mice. The percentage of Ki67+E-Cadherin+ cells over total E-Cadherin+ epithelial cells was calculated from 0.02 mm2 regions (n=9). The percentage of CC3+ areas over total E-Cadherin+ areas was calculated from 0.02 mm2 regions (n=9). b, Representative immunofluorescence images of E-Cadherin (green), Ki67 (red) and cleaved Caspase 3 (CC3, cyan) in tumor tissues from 23-week-old CD8−/−Tgfbr2fl/flPyMTT (CD8−/−) and CD8−/−ThPOKCreTgfbr2fl/flPyMT (CD8−/− knockout, CD8−/− KO) mice. The percentage of Ki67+ECadherin+ cells over total E-Cadherin+ epithelial cells was calculated from 0.02 mm2 regions (n=9). The percentage of CC3+ areas over total E-Cadherin+ areas was calculated from 0.02 mm2 regions (n=9). Data are represented as the mean ± SEM (biologically independent mice in a, b). Two-tailed unpaired t-test (a, b).
Extended Data Fig. 4 |. Blockage of TGF-β signaling in CD4+ T cells causes leukocyte exclusion from the tumor parenchyma and inhibits vasculature leakage in association with vasculature remodeling.
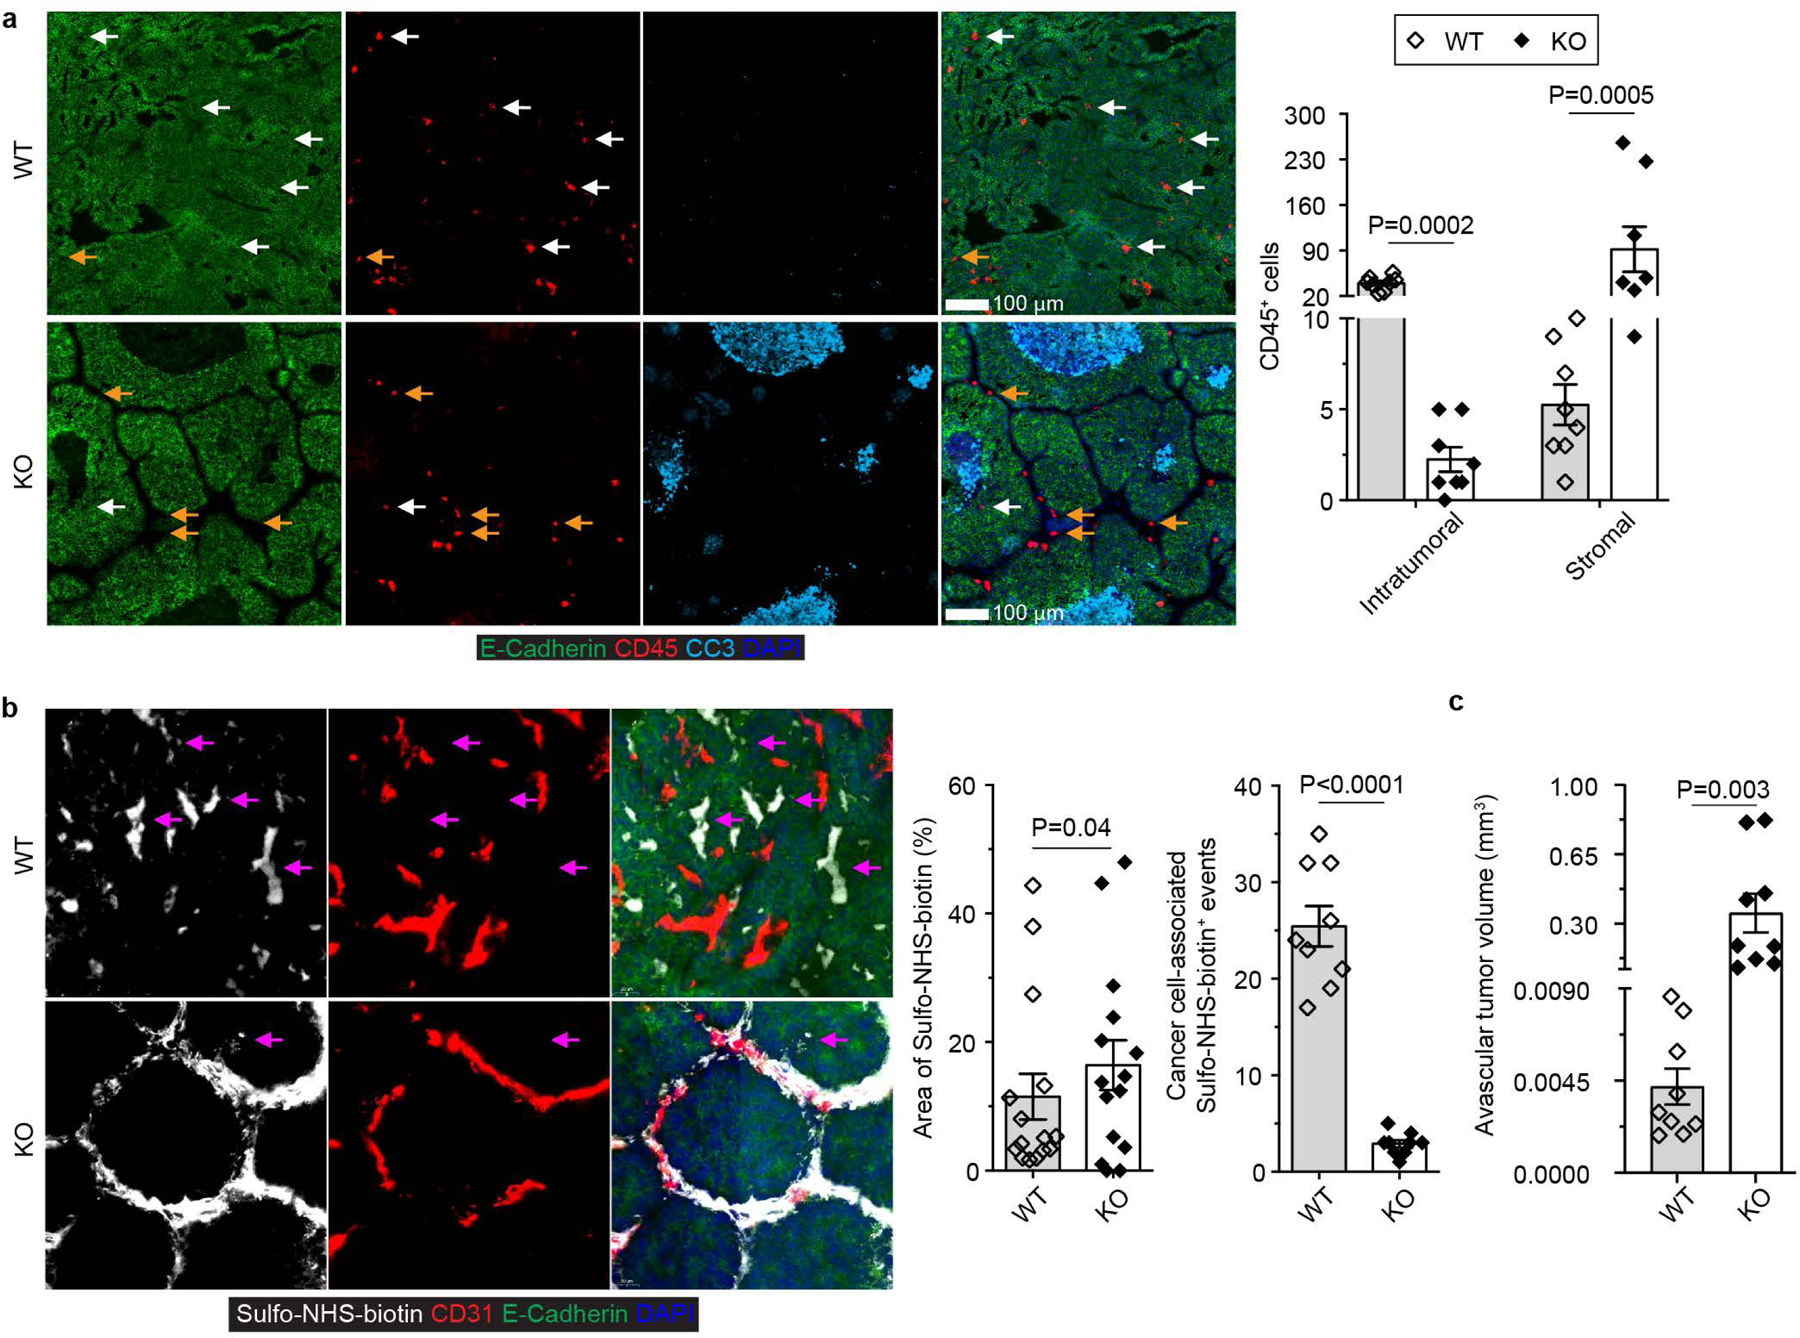
a, Representative immunofluorescence images of E-Cadherin (green), CD45 (red) and cleaved Caspase 3 (CC3, cyan) in tumor tissues from 23-week-old Tgfbr2fl/flPyMT (wild-type, WT) and ThPOKCreTgfbr2fl/flPyMT (knockout, KO) mice. Intratumoral (white arrows) and stromal (yellow arrows) CD45+ leukocytes were counted from 0.1 mm2 regions (n=8 for WT and KO tumor tissues from biologically independent mice). b, Representative images of Sulfo-NHS-biotin (white), CD31 (red) and E-Cadherin (green) and quantification of Sulfo-NHS-biotin density and cancer cell-associated Sulfo-NHS-biotin+ events (magenta arrows) in tumor tissues from 23-week-old WT and KO mice. The percentage of Sulfo-NHS-biotin+ areas (n=15) and cancer-cell associated deposition events (n=9) were calculated from 0.8 mm2 regions. c, Quantification of the volume of avascular regions from three-dimensional confocal CD31 staining images of tumor tissues from 23-week-old WT (n=9) and KO (n=9) mice. Data are represented as the mean ± SEM (biologically independent mice in a-c). Two-tailed unpaired t-test (a-c).
Extended Data Fig. 5 |. Blockage of TGF-β signaling in CD4+ T cells promotes expansion of CD4+Foxp3- T cells in tumor.
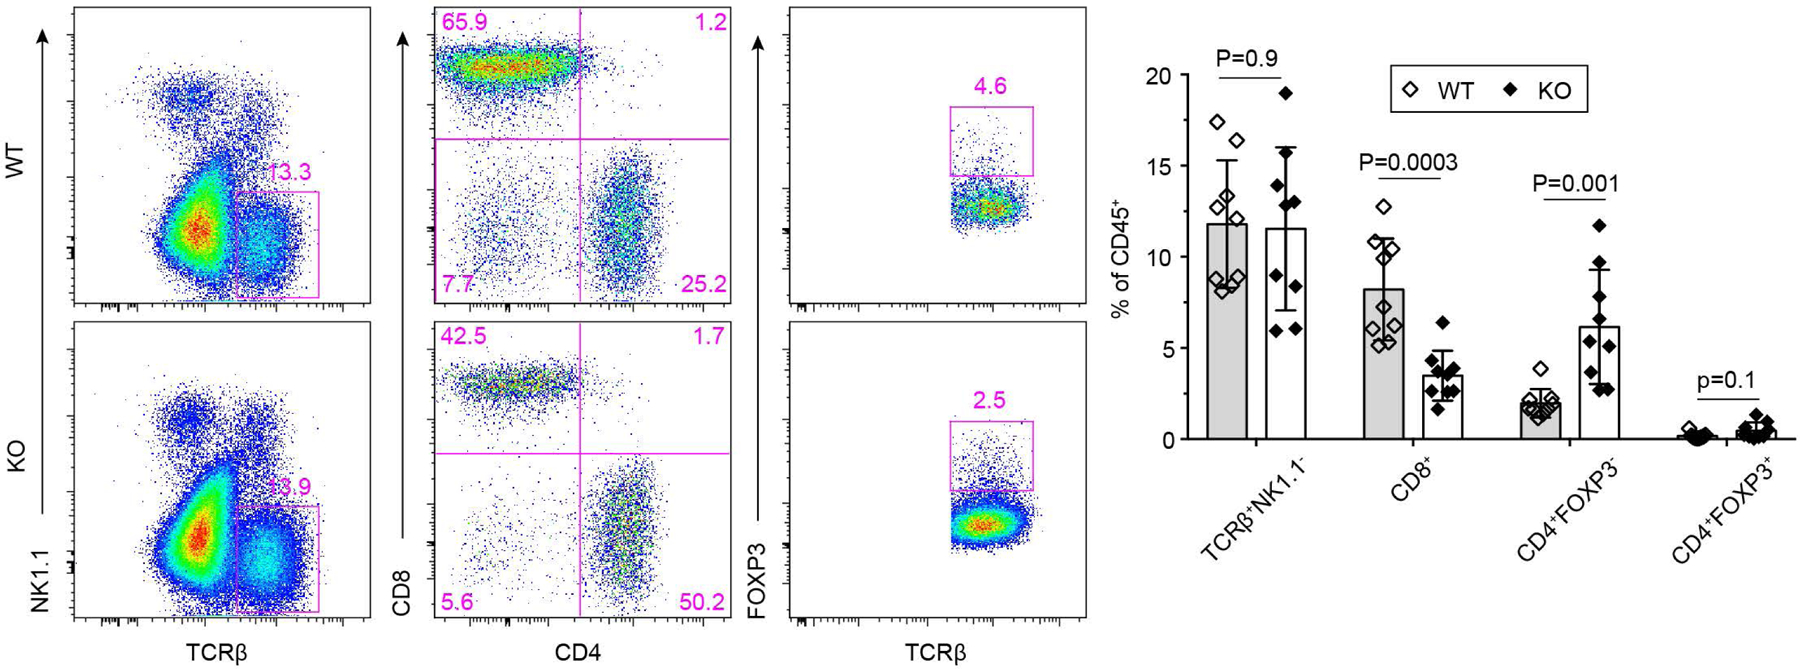
Representative flow cytometry plots of TCRβ, NK1.1, CD4, CD8 and Foxp3 expression and statistical analyses of the gated populations in tumor-infiltrating leukocytes from 23-week-old Tgfbr2fl/flPyMT (wild-type, WT; n=9) and ThPOKCreTgfbr2fl/flPyMT (knockout, KO; n=9) mice. Data are represented as the mean ± SEM (biologically independent mice). Two-tailed unpaired t-test.
Extended Data Fig. 6 |. IFN-γ deficiency does not impair cancer immunity triggered by blockage of TGF-β signaling in CD4+ T cells.
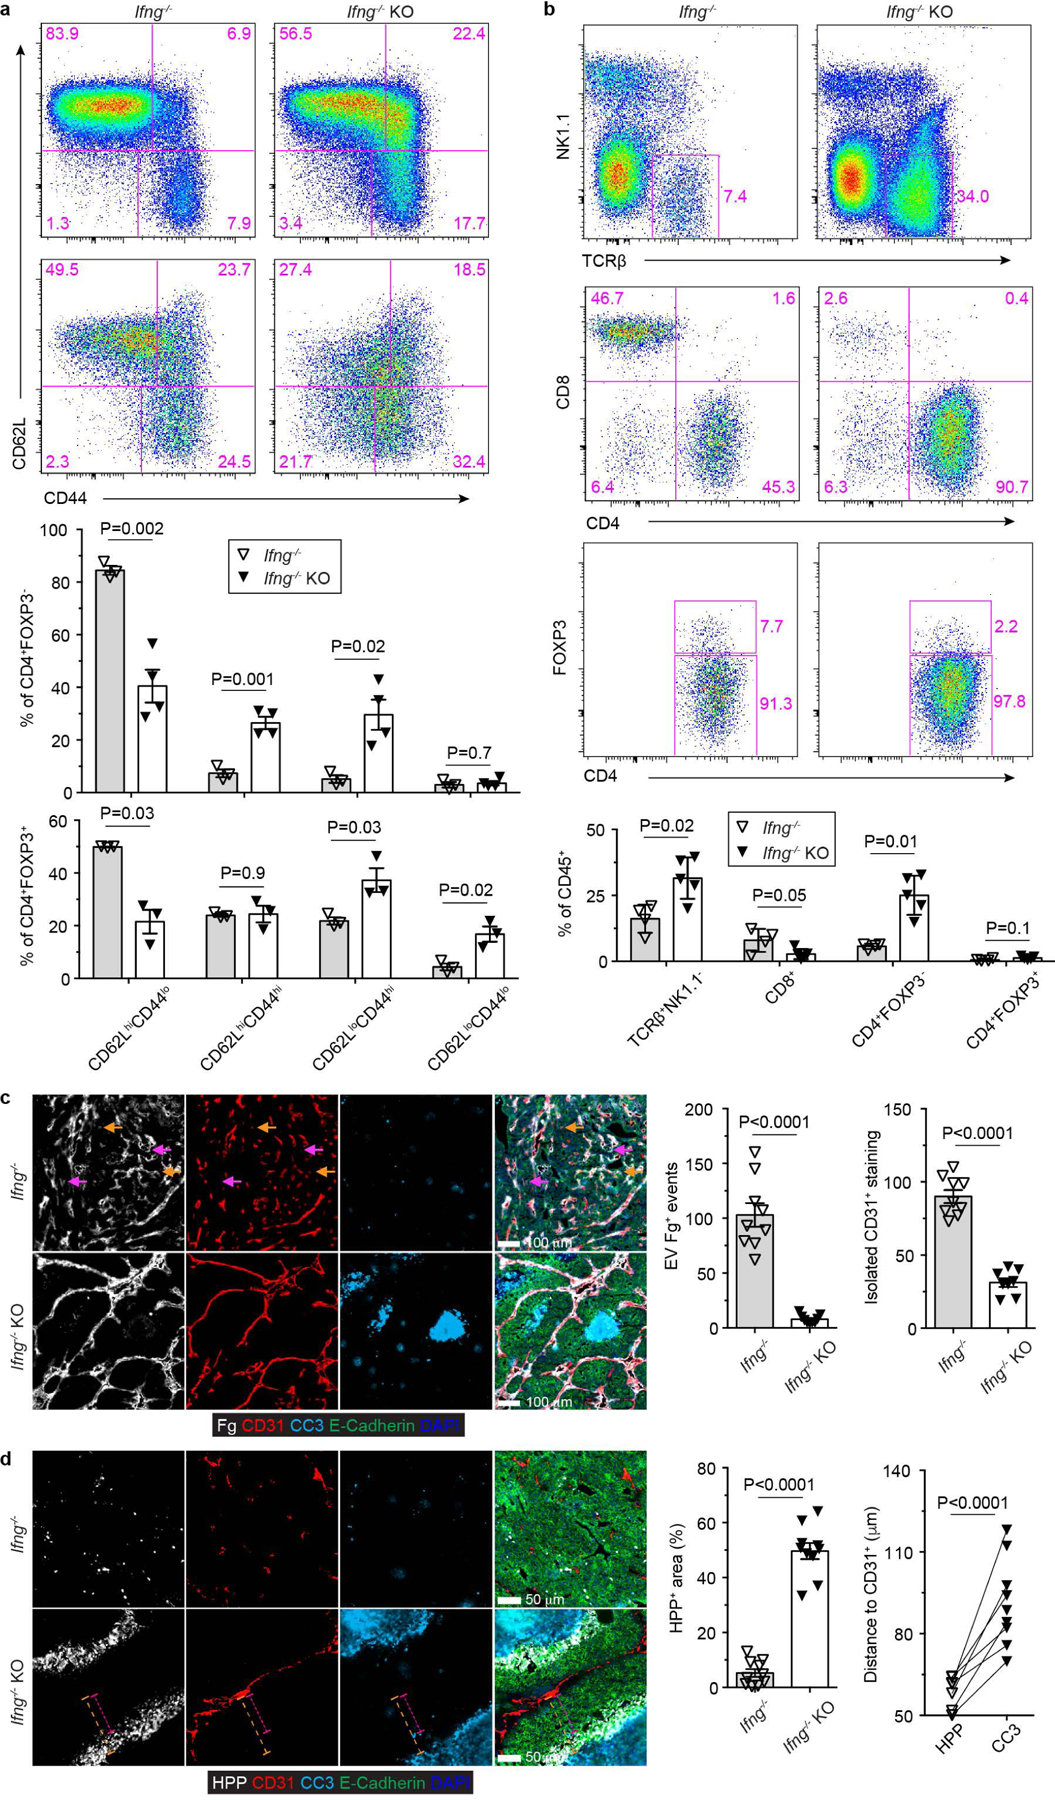
a, Representative flow cytometry plots of CD62L and CD44 expression and statistical analyses of the gated populations among CD4+Foxp3- T cells (top panel) and CD4+Foxp3+ T cells (bottom panel) from Ifng−/−Tgfbr2fl/flPyMT (Ifng−/−; n=3) and Ifng−/−ThPOKCreTgfbr2fl/flPyMT (Ifng−/− knockout, Ifng−/− KO; n=4) mice. b, Representative flow cytometry plots of TCRb, NK1.1, CD4, CD8 and Foxp3 expression and statistical analyses of the gated populations in tumor-infiltrating leukocytes from 23-week-old Ifng−/− (n=4) and Ifng−/− KO (n=5) mice. c, Representative immunofluorescence images of fibrinogen (Fg, white), CD31 (red), cleaved Caspase 3 (CC3, cyan) and E-Cadherin (green) in comparable individual tumors with sizes around 8×8 mm in length and width from 23-week-old Ifng−/− and Ifng−/− KO mice. Extravascular (EV) Fg deposition events (magenta arrows) were calculated from 1 mm2 regions (n=9 for Ifng−/− and Ifng−/− KO tumor tissues). Isolated CD31+ staining (yellow arrows) was counted from 1 mm2 regions (n=9 for Ifng−/− and Ifng−/− KO tumor tissues). d, Representative immunofluorescence images of a hypoxia probe (HPP, white), CD31 (red), cleaved Caspase 3 (CC3, cyan) and E-Cadherin (green) in tumors from Ifng−/− and Ifng−/− KO mice. The percentage of HPP+E-Cadherin+ regions over E-Cadherin+ epithelial regions was calculated from 1 mm2 regions (n=9 for Ifng−/− and Ifng−/− KO tumor tissues). The shortest distance of HPP+ regions (magenta dashed lines) or CC3+ regions (yellow dashed lines) to CD31+ endothelial cells was measured in tumor tissues from Ifng−/− KO mice (n=9). Data are represented as the mean ± SEM (biologically independent mice in a-d). Two-tailed unpaired (a-d) or paired (d) t-test.
Extended Data Fig. 7 |. IL-4 deficiency impairs cancer immunity triggered by blockage of TGF-β signaling in CD4+ T cells.
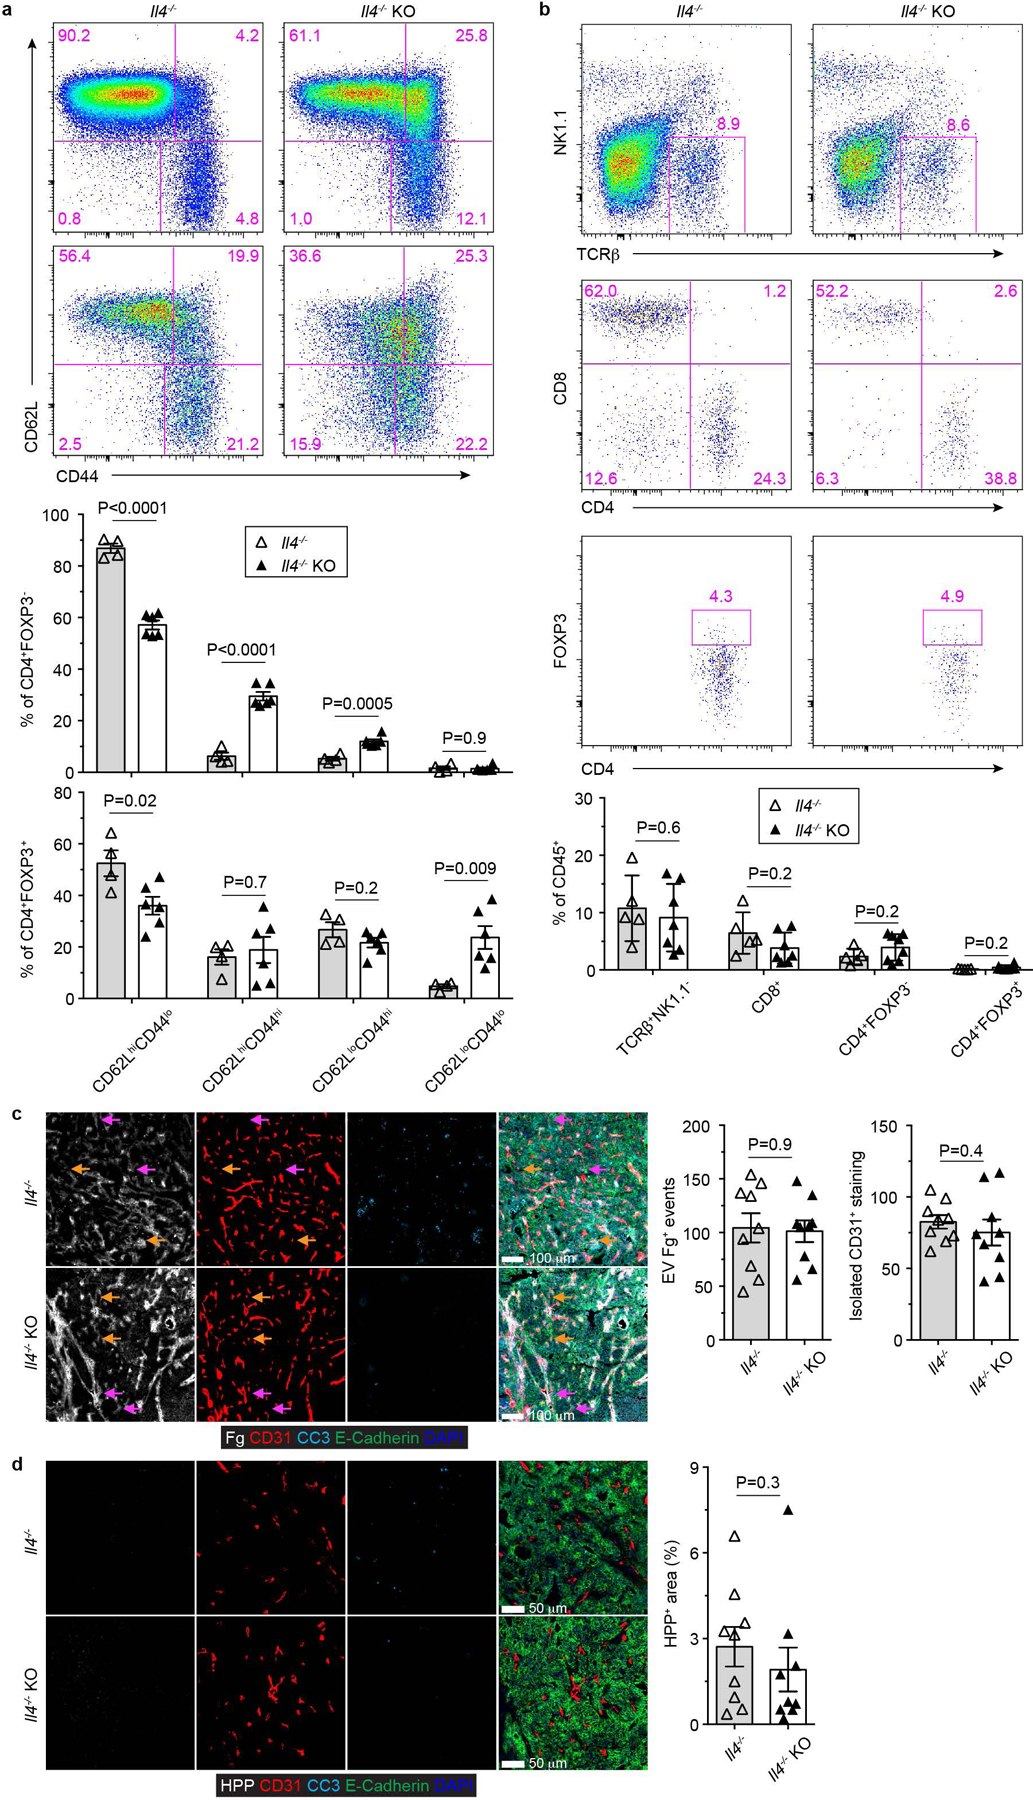
a, Representative flow cytometry plots of CD62L and CD44 expression and statistical analyses of the gated populations among CD4+Foxp3- T cells (top panel) and CD4+Foxp3+ T cells (bottom panel) from Il4−/−Tgfbr2fl/flPyMT (Il4−/−; n=4) and Il4−/−ThPOKCreTgfbr2fl/flPyMT (Il4−/− knockout, Il4−/− KO; n=6) mice. b, Representative flow cytometry plots of TCRβ, NK1.1, CD4, CD8 and Foxp3 expression and statistical analyses of the gated populations in tumor-infiltrating leukocytes from 23-week-old Il4−/− (n=5) and Il4−/− KO (n=7) mice. c, Representative immunofluorescence images of fibrinogen (Fg, white), CD31 (red), cleaved Caspase 3 (CC3, cyan) and E-Cadherin (green) in comparable individual tumors with sizes around 8×8 mm in length and width from 23-week-old Il4−/− and Il4−/− KO mice. Extravascular (EV) Fg deposition events (magenta arrows) were calculated from 1 mm2 regions (n=9 for Il4−/− and Il4−/− KO tumor tissues). Isolated CD31+ staining (yellow arrows) was counted from 1 mm2 regions (n=9 for Il4−/− and Il4−/− KO tumor tissues). d, Representative immunofluorescence images of a hypoxia probe (HPP, white), CD31 (red), cleaved Caspase 3 (CC3, cyan) and E-Cadherin (green) in tumors from Il4−/− and Il4−/− KO mice. The percentage of HPP+E-Cadherin+ regions over E-Cadherin+ epithelial regions was calculated from 1 mm2 regions (n=9 for Il4−/− and Il4−/− KO tumor tissues). Data are represented as the mean ± SEM (biologically independent mice in a-d). Two-tailed unpaired t-test (a-d).
Extended Data Fig. 8 |. Anti-tumor immunity triggered by TGF-β receptor II-deficient CD4+ T cells is dependent on IL-4.
a, 16 to 17-week-old PyMT mice bearing 5×5 mm tumors were transferred with CD4+CD25- T cells from Tgfbr2fl/fl (wild-type, WT; n=4), ThPOKCreTgfbr2fl/fl (knockout, KO; n=4), Il4−/−Tgfbr2fl/fl (Il4−/−; n=3) and Il4−/−ThPOKCreTgfbr2fl/fl (Il4−/− KO; n=3) mice on a weekly basis for 6 weeks. Tumor burden was measured and plotted. b, Representative immunofluorescence images of Ki67 (red) and cleaved Caspase 3 (CC3, cyan) in tumors from PyMT recipients transferred with WT, KO, Il4−/− or Il4−/− KO CD4+CD25- T cells for 6 weeks. The percentage of Ki67+E-Cadherin+ cells over total E-Cadherin+ epithelial cells was calculated from 0.02 mm2 regions (n=9). The percentage of CC3+ areas over total E-Cadherin+ areas was calculated from 0.02 mm2 regions (n=9). Data are represented as the mean ± SEM (biologically independent mice). Two-tailed unpaired t-test. c, Tumor measurements of WT (n=5), KO (n=4), anti-IL-4 (αIL-4)-treated WT (n=5), αIL-4-treated KO (n=4), anti-IFN-γ (αIFN-γ)-treated WT (n=3) and αIFN-γ-treated KO mice (n=3) inoculated with MC38 cancer cells. Dashed line denote tumor burden of individual mice and solid lines indicate mean of tumor burden in a group of mice (a, c). Two-tailed unpaired t-test (a, c). ***: P<0.001; **: P<0.01; and ns: not significant.
Extended Data Fig. 9 |. A Th2 cell gene expression signature stratifies cancer patients for survival probability.
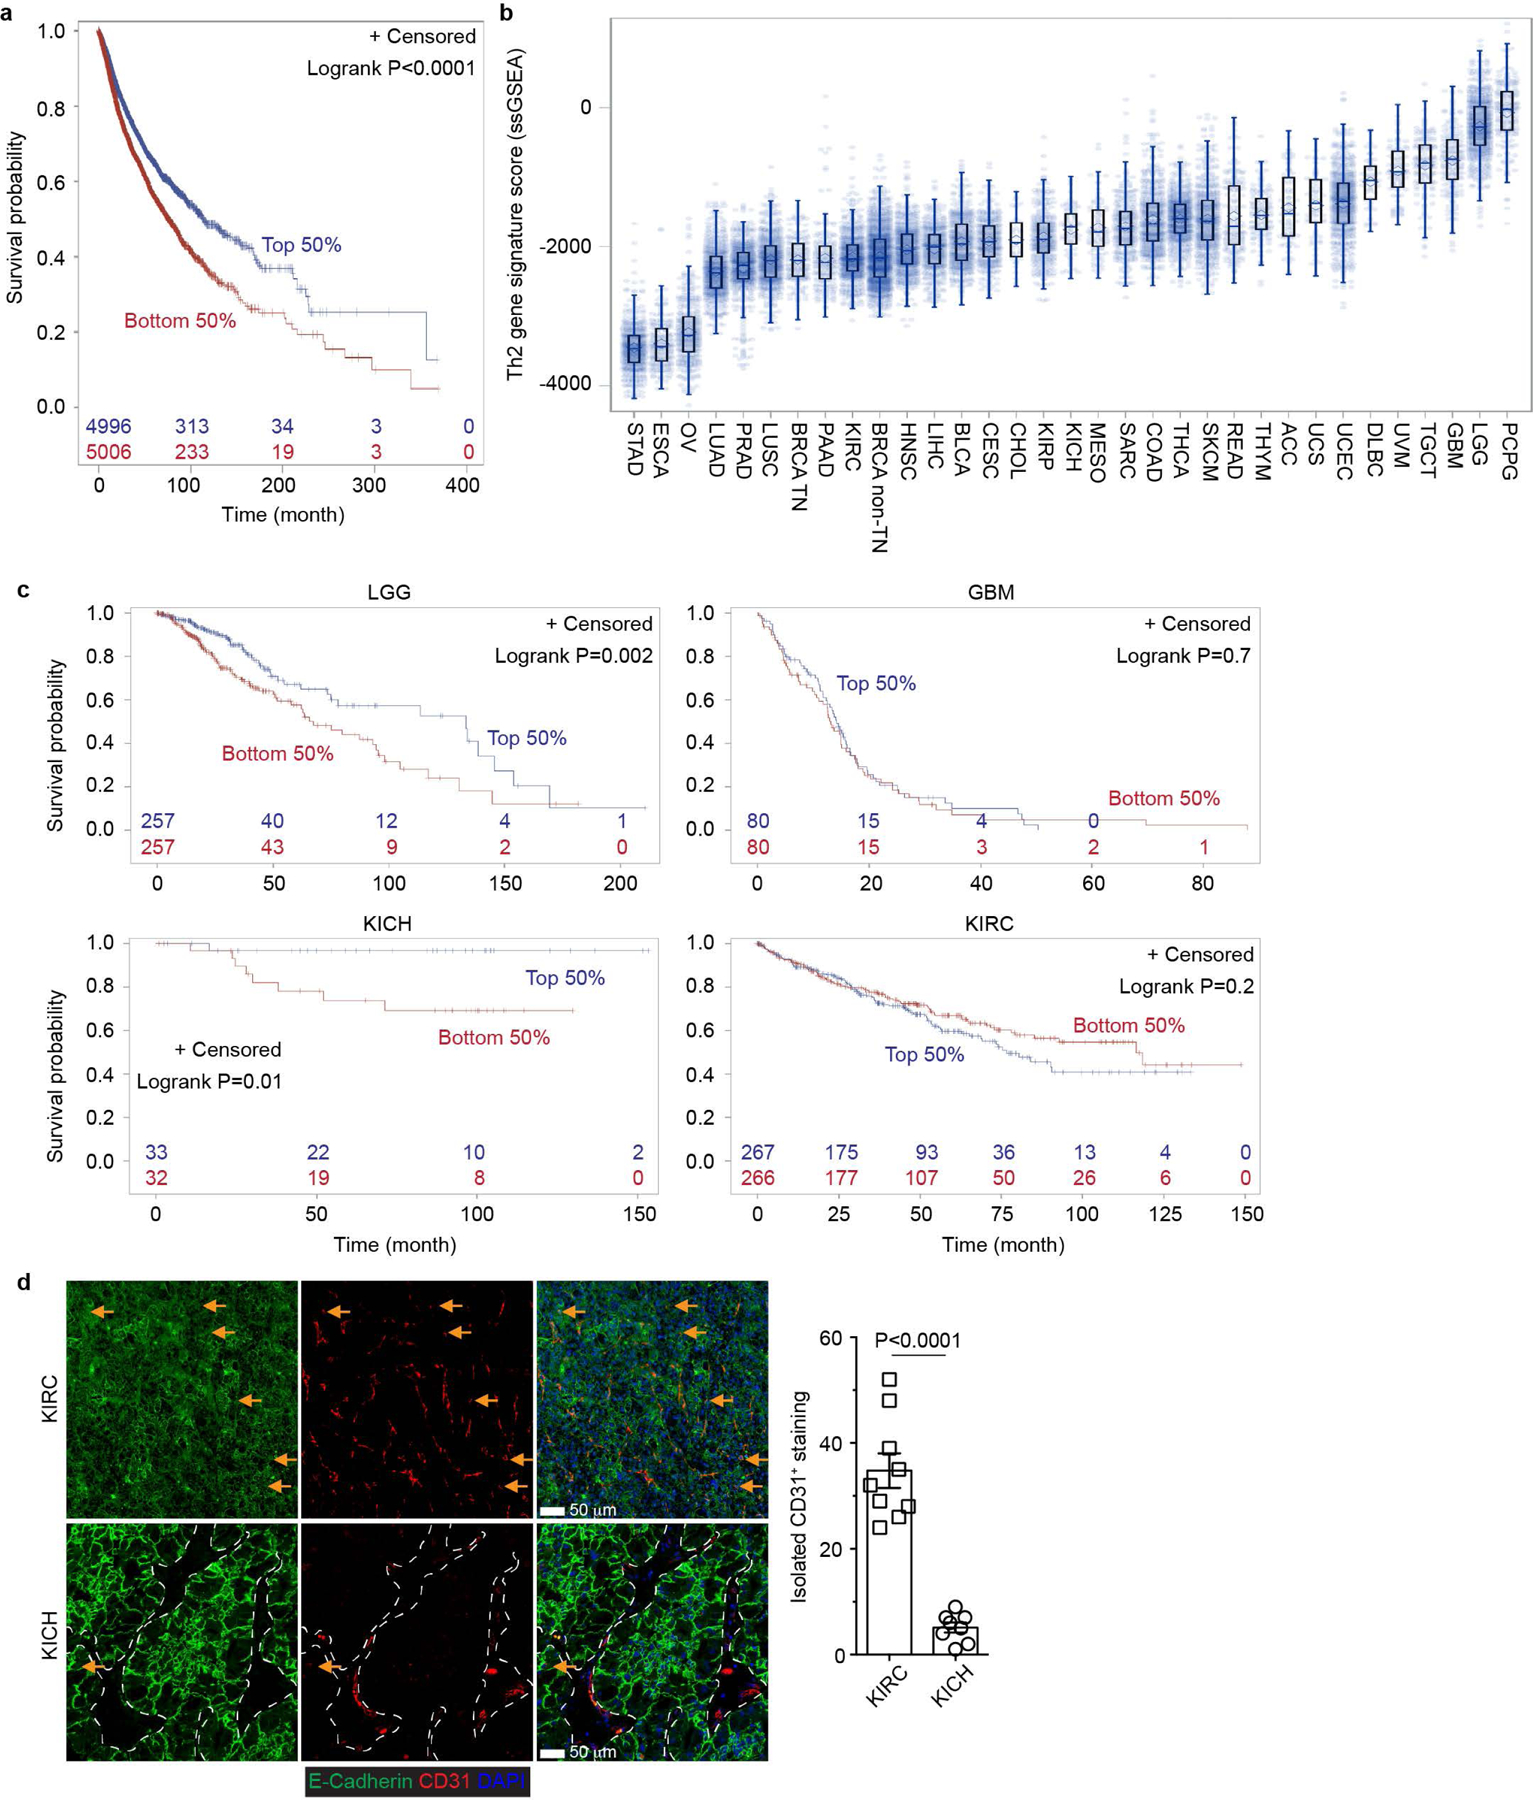
a, A Th2 gene expression signature was used to perform survival analysis in TCGA Pan cancer cohort data (n=10002) and survival curves were plotted for the signature high group (top 50%; n=4996) and low group (bottom 50%; n=5006). The corresponding censored patient numbers are included in major time points. Two-tailed Logrank test. b, The Th2 gene signature enrichment score was estimated and plotted for each RNASeq sample of TCGA Pan cancer patients (n=10050). The middle line in the box indicates median and the bound indicates 25% quartile (Q1) and 75% quartile (Q3). The whisker reaches to the max/min point within the 1.5x interquartile range from either Q3 or Q1, respectively. c, The Th2 gene signature was used to perform survival analysis in low grade glioma (LGG; n=514) and glioblastoma multiforme (GBM; n=160), kidney chromophobe (KICH; n=65) and kidney renal clear cell carcinoma (KIRC; n=533) patients. The survival curves were plotted for the signature high group (top 50%) and low group (bottom 50%). The corresponding censored patient numbers are included in major time points. Two-tailed Logrank test. d, Representative immunofluorescence images of E-Cadherin (green) and CD31 (red) in KICH (n=4 patients) and KIRC (n=8 patients) tumor tissues. Isolated CD31+ staining was counted from 0.2 mm2 regions (n=9). The stromal regions are marked by dotted lines in KICH samples. Data are shown as mean ± SEM. Two-tailed unpaired t-test.
Extended Data Fig. 10 |. Blockage of TGF-β signaling in CD4+ T cells reprograms tumor vasculature and halts cancer progression.
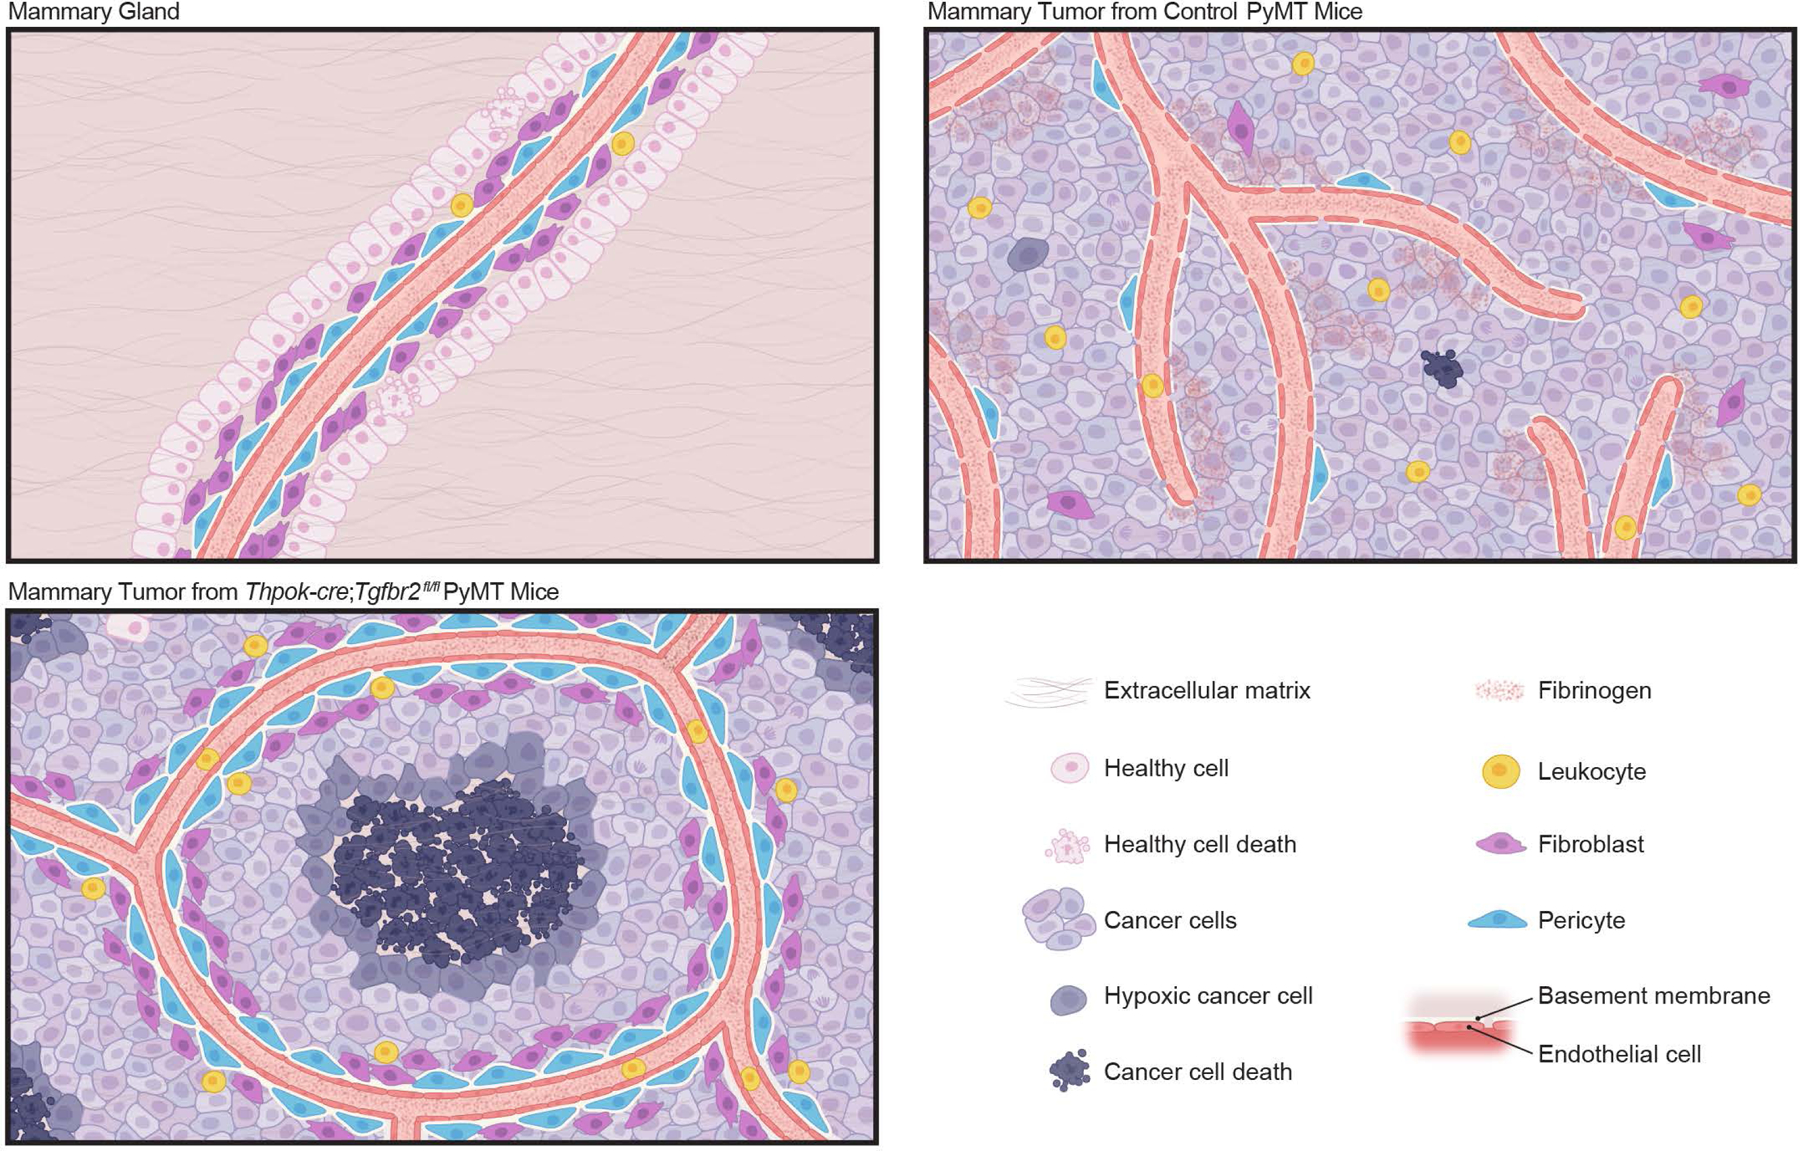
In untransformed mammary glands, developmentally wired blood vasculature maintains a layer of healthy epithelium. In mammary tumors from control PyMT mice, sprouting angiogenesis is induced with an immature and leaky vasculature in support of cancer cell survival and tumor growth, which co-occurs with leukocyte infiltration to the tumor parenchyma. Blockage of TGF-β signaling in CD4+ T cells remodels the tumor vasculature with the endothelium ensheathed by pericytes and fibroblasts, concomitant with leukocyte exclusion from the tumor parenchyma. In addition, the vasculature pattern is reconfigured, which creates large avascular regions leading to cancer cell hypoxia and cancer cell death. Such a host-directed tissue-level cancer defense response is dependent on the type 2 cytokine interleukin 4.
Supplementary Material
Acknowledgements
We thank members of the M.O.L. laboratory for helpful discussions. This work was supported by a Howard Hughes Medical Institute Faculty Scholar Award (M.O.L.), an award from Mr. William H. and Mrs. Alice Goodwin and the Commonwealth Foundation for Cancer Research and the Center for Experimental Therapeutics at Memorial Sloan Kettering Cancer Center (M.O.L.) and a Cancer Center Support Grant (P30 CA08748). B.G.N. and M.H.D. are recipients of F31 CA210332 and F30 AI29273–03 awards from National Institutes of Health. C.C. and S.L. are Cancer Research Institute Irvington Fellows supported by the Cancer Research Institute. E.G.S. is a recipient of a Fellowship from the Alan and Sandra Gerry Metastasis and Tumor Ecosystems Center of MSKCC.
Footnotes
Competing Interests
MSKCC has filed a patent application with the U.S. Patent and Trademark Office directed toward methods and compositions for targeting TGF-β signaling in CD4+ helper T cells for cancer immunotherapy.
Data Availability
Data generated here are included within the paper (and its Supplementary Information files) or are available from the corresponding authors upon reasonable request. Gene-expression raw data that support the findings of this study have been deposited in Gene Expression Omnibus under the accession number GSE151406. Source data for Figs. 1-4 and Extended Data Figs. 1-9 are provided with the paper.
References
- 1.Iwasaki A & Medzhitov R Control of adaptive immunity by the innate immune system. Nat Immunol 16, 343–353, 10.1038/ni.3123 (2015). [DOI] [PMC free article] [PubMed] [Google Scholar]
- 2.Gause WC, Wynn TA & Allen JE Type 2 immunity and wound healing: evolutionary refinement of adaptive immunity by helminths. Nat Rev Immunol 13, 607–614, 10.1038/nri3476 (2013). [DOI] [PMC free article] [PubMed] [Google Scholar]
- 3.Matsushita H et al. Cancer exome analysis reveals a T-cell-dependent mechanism of cancer immunoediting. Nature 482, 400–404, 10.1038/nature10755 (2012). [DOI] [PMC free article] [PubMed] [Google Scholar]
- 4.DuPage M, Mazumdar C, Schmidt LM, Cheung AF & Jacks T Expression of tumour-specific antigens underlies cancer immunoediting. Nature 482, 405–409, 10.1038/nature10803 (2012). [DOI] [PMC free article] [PubMed] [Google Scholar]
- 5.Dadi S et al. Cancer Immunosurveillance by Tissue-Resident Innate Lymphoid Cells and Innate-like T Cells. Cell 164, 365–377, 10.1016/j.cell.2016.01.002 (2016). [DOI] [PMC free article] [PubMed] [Google Scholar]
- 6.Chao JL & Savage PA Unlocking the Complexities of Tumor-Associated Regulatory T Cells. J Immunol 200, 415–421, 10.4049/jimmunol.1701188 (2018). [DOI] [PMC free article] [PubMed] [Google Scholar]
- 7.Sharma P & Allison JP The future of immune checkpoint therapy. Science 348, 56–61, 10.1126/science.aaa8172 (2015). [DOI] [PubMed] [Google Scholar]
- 8.Batlle E & Massague J Transforming Growth Factor-beta Signaling in Immunity and Cancer. Immunity 50, 924–940, 10.1016/j.immuni.2019.03.024 (2019). [DOI] [PMC free article] [PubMed] [Google Scholar]
- 9.Luo CT, Liao W, Dadi S, Toure A & Li MO Graded Foxo1 activity in Treg cells differentiates tumour immunity from spontaneous autoimmunity. Nature 529, 532–536, 10.1038/nature16486 (2016). [DOI] [PMC free article] [PubMed] [Google Scholar]
- 10.Wei SC et al. Distinct Cellular Mechanisms Underlie Anti-CTLA-4 and Anti-PD-1 Checkpoint Blockade. Cell 170, 1120–1133 10.1016/j.cell.2017.07.024 (2017). [DOI] [PMC free article] [PubMed] [Google Scholar]
- 11.Gorelik L & Flavell RA Immune-mediated eradication of tumors through the blockade of transforming growth factor-beta signaling in T cells. Nature medicine 7, 1118–1122, 10.1038/nm1001-1118 (2001). [DOI] [PubMed] [Google Scholar]
- 12.Donkor MK et al. T cell surveillance of oncogene-induced prostate cancer is impeded by T cell-derived TGF-beta1 cytokine. Immunity 35, 123–134, 10.1016/j.immuni.2011.04.019 (2011). [DOI] [PMC free article] [PubMed] [Google Scholar]
- 13.Oh SA & Li MO TGF-beta: guardian of T cell function. J Immunol 191, 3973–3979, 10.4049/jimmunol.1301843 (2013). [DOI] [PMC free article] [PubMed] [Google Scholar]
- 14.Dvorak HF Tumors: wounds that do not heal. Similarities between tumor stroma generation and wound healing. N Engl J Med 315, 1650–1659, 10.1056/NEJM198612253152606 (1986). [DOI] [PubMed] [Google Scholar]
- 15.Armulik A, Genove G & Betsholtz C Pericytes: developmental, physiological, and pathological perspectives, problems, and promises. Developmental cell 21, 193–215, 10.1016/j.devcel.2011.07.001 (2011). [DOI] [PubMed] [Google Scholar]
- 16.Kalluri R The biology and function of fibroblasts in cancer. Nature reviews. Cancer 16, 582–598, 10.1038/nrc.2016.73 (2016). [DOI] [PubMed] [Google Scholar]
- 17.Bonnans C, Chou J & Werb Z Remodelling the extracellular matrix in development and disease. Nature reviews. Molecular cell biology 15, 786–801, 10.1038/nrm3904 (2014). [DOI] [PMC free article] [PubMed] [Google Scholar]
- 18.Bergers G & Benjamin LE Tumorigenesis and the angiogenic switch. Nature reviews. Cancer 3, 401–410, 10.1038/nrc1093 (2003). [DOI] [PubMed] [Google Scholar]
- 19.Carmeliet P & Jain RK Molecular mechanisms and clinical applications of angiogenesis. Nature 473, 298–307, 10.1038/nature10144 (2011). [DOI] [PMC free article] [PubMed] [Google Scholar]
- 20.Gimbrone MA Jr., Leapman SB, Cotran RS & Folkman J Tumor dormancy in vivo by prevention of neovascularization. J Exp Med 136, 261–276, 10.1084/jem.136.2.261 (1972). [DOI] [PMC free article] [PubMed] [Google Scholar]
- 21.Tian L et al. Mutual regulation of tumour vessel normalization and immunostimulatory reprogramming. Nature 544, 250–254, 10.1038/nature21724 (2017). [DOI] [PMC free article] [PubMed] [Google Scholar]
- 22.Kammertoens T et al. Tumour ischaemia by interferon-gamma resembles physiological blood vessel regression. Nature 545, 98–102, 10.1038/nature22311 (2017). [DOI] [PMC free article] [PubMed] [Google Scholar]
- 23.Henriksson J et al. Genome-wide CRISPR Screens in T Helper Cells Reveal Pervasive Crosstalk between Activation and Differentiation. Cell 176, 882–896 10.1016/j.cell.2018.11.044 (2019). [DOI] [PMC free article] [PubMed] [Google Scholar]
- 24.DeNardo DG et al. CD4(+) T cells regulate pulmonary metastasis of mammary carcinomas by enhancing protumor properties of macrophages. Cancer cell 16, 91–102, 10.1016/j.ccr.2009.06.018 (2009). [DOI] [PMC free article] [PubMed] [Google Scholar]
- 25.Maier B et al. A conserved dendritic-cell regulatory program limits antitumour immunity. Nature 580, 257–262, 10.1038/s41586-020-2134-y (2020). [DOI] [PMC free article] [PubMed] [Google Scholar]
- 26.Nishimura T et al. Distinct role of antigen-specific T helper type 1 (Th1) and Th2 cells in tumor eradication in vivo. J Exp Med 190, 617–627, 10.1084/jem.190.5.617 (1999). [DOI] [PMC free article] [PubMed] [Google Scholar]
- 27.Mattes J et al. Immunotherapy of cytotoxic T cell-resistant tumors by T helper 2 cells: an eotaxin and STAT6-dependent process. J Exp Med 197, 387–393, 10.1084/jem.20021683 (2003). [DOI] [PMC free article] [PubMed] [Google Scholar]
- 28.Demehri S et al. Thymic stromal lymphopoietin blocks early stages of breast carcinogenesis. The Journal of clinical investigation 126, 1458–1470, 10.1172/JCI83724 (2016). [DOI] [PMC free article] [PubMed] [Google Scholar]
- 29.Donkor MK, Sarkar A & Li MO Tgf-beta1 produced by activated CD4(+) T Cells Antagonizes T Cell Surveillance of Tumor Development. Oncoimmunology 1, 162–171, 10.4161/onci.1.2.18481 (2012). [DOI] [PMC free article] [PubMed] [Google Scholar]
- 30.Sarkar A, Donkor MK & Li MO T cell- but not tumor cell-produced TGF-beta1 promotes the development of spontaneous mammary cancer. Oncotarget 2, 1339–1351 (2011). [DOI] [PMC free article] [PubMed] [Google Scholar]
- 31.Volpert OV et al. Inhibition of angiogenesis by interleukin 4. J Exp Med 188, 1039–1046, 10.1084/jem.188.6.1039 (1998). [DOI] [PMC free article] [PubMed] [Google Scholar]
- 32.Hanahan D & Weinberg RA Hallmarks of cancer: the next generation. Cell 144, 646–674, 10.1016/j.cell.2011.02.013 (2011). [DOI] [PubMed] [Google Scholar]
- 33.Keren L et al. A Structured Tumor-Immune Microenvironment in Triple Negative Breast Cancer Revealed by Multiplexed Ion Beam Imaging. Cell 174, 1373–1387 10.1016/j.cell.2018.08.039 (2018). [DOI] [PMC free article] [PubMed] [Google Scholar]
- 34.Bissell MJ & Radisky D Putting tumours in context. Nature reviews. Cancer 1, 46–54, 10.1038/35094059 (2001). [DOI] [PMC free article] [PubMed] [Google Scholar]
- 35.Soto AM & Sonnenschein C The tissue organization field theory of cancer: a testable replacement for the somatic mutation theory. Bioessays 33, 332–340, 10.1002/bies.201100025 (2011). [DOI] [PMC free article] [PubMed] [Google Scholar]
Methods References
- 36.Mucida D et al. Transcriptional reprogramming of mature CD4(+) helper T cells generates distinct MHC class II-restricted cytotoxic T lymphocytes. Nat Immunol 14, 281–289, 10.1038/ni.2523 (2013). [DOI] [PMC free article] [PubMed] [Google Scholar]
- 37.Donkor MK, Sarkar A & Li MO Tgf-beta1 produced by activated CD4(+) T Cells Antagonizes T Cell Surveillance of Tumor Development. Oncoimmunology 1, 162–171, 10.4161/onci.1.2.18481 (2012). [DOI] [PMC free article] [PubMed] [Google Scholar]
- 38.Ouyang W, Beckett O, Ma Q & Li MO Transforming growth factor-beta signaling curbs thymic negative selection promoting regulatory T cell development. Immunity 32, 642–653, 10.1016/j.immuni.2010.04.012 (2010). [DOI] [PMC free article] [PubMed] [Google Scholar]
- 39.Sarkar A, Donkor MK & Li MO T cell- but not tumor cell-produced TGF-beta1 promotes the development of spontaneous mammary cancer. Oncotarget 2, 1339–1351 (2011). [DOI] [PMC free article] [PubMed] [Google Scholar]
- 40.Zamarin D et al. PD-L1 in tumor microenvironment mediates resistance to oncolytic immunotherapy. The Journal of clinical investigation 128, 5184, 10.1172/JCI125039 (2018). [DOI] [PMC free article] [PubMed] [Google Scholar]
- 41.Franklin RA et al. The cellular and molecular origin of tumor-associated macrophages. Science 344, 921–925, 10.1126/science.1252510 (2014). [DOI] [PMC free article] [PubMed] [Google Scholar]
- 42.Oh SA et al. Foxp3-independent mechanism by which TGF-beta controls peripheral T cell tolerance. Proceedings of the National Academy of Sciences of the United States of America 114, E7536–E7544, 10.1073/pnas.1706356114 (2017). [DOI] [PMC free article] [PubMed] [Google Scholar]
- 43.Dobin A et al. STAR: ultrafast universal RNA-seq aligner. Bioinformatics 29, 15–21, 10.1093/bioinformatics/bts635 (2013). [DOI] [PMC free article] [PubMed] [Google Scholar]
- 44.Lawrence M et al. Software for computing and annotating genomic ranges. PLoS computational biology 9, e1003118, 10.1371/journal.pcbi.1003118 (2013). [DOI] [PMC free article] [PubMed] [Google Scholar]
- 45.Rosenbloom KR et al. The UCSC Genome Browser database: 2015 update. Nucleic acids research 43, D670–681, 10.1093/nar/gku1177 (2015). [DOI] [PMC free article] [PubMed] [Google Scholar]
- 46.Love MI, Huber W & Anders S Moderated estimation of fold change and dispersion for RNA-seq data with DESeq2. Genome biology 15, 550, 10.1186/s13059-014-0550-8 (2014). [DOI] [PMC free article] [PubMed] [Google Scholar]
- 47.Barbie DA et al. Systematic RNA interference reveals that oncogenic KRAS-driven cancers require TBK1. Nature 462, 108–112, 10.1038/nature08460 (2009). [DOI] [PMC free article] [PubMed] [Google Scholar]
- 48.Zhou Y et al. Canonical WNT signaling components in vascular development and barrier formation. The Journal of clinical investigation 124, 3825–3846, 10.1172/JCI76431 (2014). [DOI] [PMC free article] [PubMed] [Google Scholar]
Associated Data
This section collects any data citations, data availability statements, or supplementary materials included in this article.
Supplementary Materials
Data Availability Statement
Data generated here are included within the paper (and its Supplementary Information files) or are available from the corresponding authors upon reasonable request. Gene-expression raw data that support the findings of this study have been deposited in Gene Expression Omnibus under the accession number GSE151406. Source data for Figs. 1-4 and Extended Data Figs. 1-9 are provided with the paper.