

Abstract
Summary
Phylogenomic studies using genome-scale amounts of data have greatly improved understanding of the tree of life. Despite the diversity, ecological significance, and biomedical and industrial importance of fungi, evolutionary relationships among several major lineages remain poorly resolved, especially those near the base of the fungal phylogeny. To examine poorly resolved relationships and assess progress toward a genome-scale phylogeny of the fungal kingdom, we compiled a phylogenomic data matrix of 290 genes from the genomes of 1,644 species that includes representatives from most major fungal lineages. We also compiled 11 data matrices by subsampling genes or taxa from the full data matrix based on filtering criteria previously shown to improve phylogenomic inference. Analyses of these 12 data matrices using concatenation- and coalescent-based approaches yielded a robust phylogeny of the fungal kingdom in which ~85% of internal branches were congruent across data matrices and approaches used. We found support for several historically poorly resolved relationships as well as evidence for polytomies likely stemming from episodes of ancient diversification. By examining the relative evolutionary divergence of taxonomic groups of equivalent rank, we found that fungal taxonomy is broadly aligned with both genome sequence divergence and divergence time, but also identified lineages where current taxonomic circumscription does not reflect their levels of evolutionary divergence. Our results provide a robust phylogenomic framework to explore the tempo and mode of fungal evolution and offer directions for future fungal phylogenetic and taxonomic studies.
In brief
Li et al. analyze 290 genes from 1,644 species to infer a genome-scale phylogeny of the fungal kingdom. Analyses using different approaches and data matrices show that 85% of inferred relationships among fungi are robustly supported. The results provide a robust phylogenomic framework to explore the tempo and mode of fungal evolution.
Keywords: phylogenomics, concatenation, coalescence, polytomy test, phylogenetic signal, relative evolutionary divergence, zygomycetes, ancient diversification, taxonomy
Graphical abstract
Introduction
Kingdom Fungi, one of the most diverse and ancient branches of the tree of life, includes an estimated 2–5 million species that play vital roles in terrestrial and aquatic ecosystems (Figure 1)1–3. Fungi exhibit a wide variety of feeding lifestyles, morphologies, developmental patterns, and ecologies, and are thought to have coevolved with plants1,4. A robustly resolved phylogeny of fungi is necessary for understanding how their genes, pathways, traits, and their biology in general, evolved. However, the early history of diversification of major fungal lineages remains poorly resolved5.
Figure 1. Diversity of Major Fungal Lineages.

Representative species for major fungal lineages. (A) Crown coral Artomyces pyxidata (Agaricomycotina, Basidiomycota). (B) witch’s butter Tremella mesenterica (Pucciniomycotina, Basidiomycota). (C) Flowerpot parasol, Leucocoprinus birnbaumii (Agaricomycotina, Basidiomycota). (D) Pearl oyster mushroom, Pleurotus ostreatus (Agaricomycotina, Basidiomycota). (E) Snow fungus, Tremella fuciformis (Agaricomycotina, Basidiomycota). (F) Turkey tail, Trametes versicolor (Agaricomycotina, Basidiomycota). (G) Baker’s yeast Saccharomyces cerevisiae (Saccharomycotina, Ascomycota). (H) Fission yeast Schizosaccharomyces pombe (Taphrinomycotina, Ascomycota). (I) Mucor mucedo (Mucoromycotina, Mucoromycota). (J) Corn smut Ustilago maydis (Ustilaginomycotina, Basidiomycota). (K) Aspergillus oerlinghausenensis (Pezizomycotina, Ascomycota). (L) Fly agaric Amanita muscaria (Agaricomycotina, Basidiomycota). (M) Entomophthora muscae (Entomophthoromycotina, Zoopagomycota). (N) Rozella allomycis parasitizing the chytrid Allomyces. (O) Monoblepharis macrandra (Monoblepharidomycetes, Chytridiomycota). (P) Coemansia braziliensis (Kickxellomycotina, Zoopagomycota). (Q) Piptocephalis repens (Zoopagomycotina, Zoopagomycota). (R) Mortierella elongata (Mortierellomycotina, Mucoromycota). (S) Rhizopus spp. (Mucoromycotina, Mucoromycota). (T) Penicillium digitatum (Pezizomycotina, Ascomycota). A-C, E, and F Photograph courtesy of Jacob L. Steenwyk. D, G, J, L, M, S, and T Images are available to the public domain through https://commons.wikimedia.org/wiki/. H, Photograph reproduced with permission of David O. Morgan. K, Photograph courtesy of Jos Houbraken. I, Photograph courtesy of Kerry O’Donnell. N, O, Photographs courtesy of Kensuke Seto and Timothy James. P-R, Photographs courtesy of Jason Stajich.
There are more than 200 orders of fungi classified into 12 phyla 5 (see an alternative scheme of classification6). These 12 phyla are placed into six major groups: the subkingdoms Dikarya (which includes the phyla Ascomycota, Basidiomycota, and Entorrhizomycota) and Chytridiomyceta (which includes the phyla Chytridiomycota, Monoblepharidomycota, and Neocallimastigomycota), the phyla Mucoromycota, Zoopagomycota, and Blastocladiomycota, and the major group Opisthosporidia (which includes the phyla Aphelidiomycota, Cryptomycota/Rozellomycota, and Microsporidia, and is possibly paraphyletic)5.
Evolutionary relationships among several fungal higher taxonomic ranks are poorly resolved, with molecular studies providing support for conflicting hypotheses or being equivocal in their support (Figure S1)5,7. For example, relationships among the three phyla within Opisthosporidia are ambiguous, especially the placement of Aphelidiomycota (Figure S1). This is likely due to the parasitic lifestyles, highly reduced morphologies, and very rapidly evolving genomes of many of the organisms involved (e.g., Microsporidia), which render their evolutionary placement challenging8,9. Ambiguity also exists with respect to the placement of Blastocladiomycota, a group of flagellated zoospore-producing fungi whose characteristics are similar to those of terrestrial fungi10. Previous analyses place Blastocladiomycota as diverging either before or after Chytridiomyceta (Figure S1), making their placement on the fungal phylogeny key for understanding the evolution of diverse fungal traits5,11. Mucoromycota and Zoopagomycota were previously classified as zygomycetes12, a now defunct taxonomic group, based on the production of coenocytic hyphae and sexual reproduction by zygospores. After arbuscular mycorrhizal fungi were segregated from zygomycetes into the new phylum Glomeromycota13, zygomycetes became paraphyletic7,11 and the group was abandoned in favor of a classification of zygomycete taxa into two major lineages, Mucoromycota and Zoopagomycota7. The placement of Entorrhizomycota, a group of gall-forming root parasites of Poales flowering plants, with respect to Basidiomycota is also not clear5. Finally, evolutionary relationships among phyla within the chytrid clade Chytridiomyceta, among subphyla within Basidiomycota, and within phylum Ascomycota (e.g., between classes in Taphrinomycotina) are also elusive (Figure S1)5,7.
In retrospect, previous molecular phylogenetic analyses have relied primarily on a few loci from many taxa that often provided little resolution of the deep internal branches (e.g., 6 genes / 199 taxa10), or genomic data with scarce taxon sampling (e.g., 53 genes / 121 taxa14; 192 genes / 46 taxa15; 650 genes / 104 taxa16; 455 genes / 72 taxa17). However, phylogenomic studies of specific fungal lineages that are well sampled, such as Saccharomycotina (e.g., 2,408 genes / 332 taxa18) and Ascomycota (e.g., 815 genes / 1,107 taxa19), suggest that denser gene and taxon sampling hold great potential for resolving relationships that previously seemed intractable.
A robust phylogenetic framework for Fungi based on a broad sampling of genes and taxa is key for understanding the evolution of the kingdom and would greatly facilitate larger-scale studies in fungal comparative biology, ecology, and genomics. In recent years, the 1000 Fungal Genomes Project (https://mycocosm.jgi.doe.gov/programs/fungi/1000fungalgenomes.jsf) has greatly expanded the availability of genomes from diverse understudied taxa20. Additionally, efforts focused on specific ecological or evolutionary groups, such as the Y1000+ Project (http://y1000plus.org) that aims to sequence all known species of the subphylum Saccharomycotina21, the Dothideomycetes project that aims to study plant pathogenic fungi22, and the Aspergillus genome project that aims to examine the metabolic dexterity of this diverse genus of fungi23, have greatly increased the availability of genomes from specific lineages.
The availability of genomic data from a substantially expanded and more representative set of fungal species offers an opportunity to reconstruct a genome-scale fungal tree of life and examine its support for relationships that have heretofore remained poorly resolved (Figure S1). To this end, we analyzed data from 1,644 available fungal genomes that include representatives from most major lineages and provided a robust phylogenomic framework to explore the evolution of the fungal kingdom.
RESULTS
A pan-fungal phylogenomic matrix with high taxon sampling and occupancy
To assemble a phylogenomic data matrix, we sampled 1,707 publicly available genomes from NCBI (one representative genome per species; retrieved on January 30, 2020), representing every major lineage across fungi (1,679 taxa) and selected outgroups (28 taxa) based on the current understanding of the Opisthokonta phylogeny24,25; the sole exceptions were the Aphelidiomycota and Entorrhizomycota phyla, for which no genomes were available as of January 30, 2020 (Data S1).
To filter out low quality genomes, we analyzed each genome using BUSCO26 with the Fungi OrthoDB v9 database27, which contains 290 genes. To minimize missing data and remove potential low-quality genomes, we retained only those genomes that contained ≥100 single-copy BUSCO genes (Data S1). This analysis resulted in the removal of the genomes of 35 fungal species. The average genome assembly completeness for the remaining 1,672 taxa was 92.32% (average of 267.74 / 290 BUSCO genes). The full data matrix contains 124,700 amino acid sites from 290 BUSCO genes (90.6% taxon-occupancy per BUSCO gene, an average length of 430 residues per gene after trimming, and 84.36% site occupancy) across 1,672 taxa (1,644 fungal taxa and 28 outgroups) (Data S2). To conduct sensitivity analyses for potential systematic errors or biases that may influence the accuracy of phylogenetic inference, we generated 11 data matrices by subsampling genes (8 data matrices) or taxa (3 data matrices) from the full data matrix. The examined biases include the removal of genes (e.g., based on shorter alignment length and higher evolutionary rate) or taxa (e.g., by removing rogue taxa) according to filtering criteria previously shown to improve phylogenomic inference (Figure S2)28,29.
A robust phylogenetic framework to explore fungal evolution
To infer the fungal phylogeny, we used concatenation-based single model (unpartitioned), concatenation-based data-partitioning (one partition per gene), and coalescent-based approaches on the 12 data matrices (Figure S2). The gene occupancy for every taxon in each data matrix is shown in Data S2. These analyses produced 33 phylogenetic trees: 12 from concatenation-based single model analyses, nine from concatenation-based data-partitioning analyses (phylogenies were not inferred from three matrices for reasons of computational efficiency), and 12 from coalescent-based analyses; see methods for more details. We found that ~85% (1,414 / 1,669 of bipartitions (or internodes / internal branches) were recovered consistently across these 33 phylogenies, suggesting that a large fraction of bipartitions in the fungal phylogeny were robustly supported (Figures S3, S4).
Notable examples of relationships recovered in all 33 phylogenies included the placements of the cellular slime mold Fonticula as sister to fungi and of Opisthosporidia as sister to the rest of fungi (Figures 2, 3, S3)25,30. Our analyses also robustly placed Wallemiomycotina (previously placed sister to31,32 or outside of, albeit with low support33, Agaricomycotina) as sister to Agaricomycotina with strong support (BS = 100%; LPP = 100) (Figures 2 and 3).
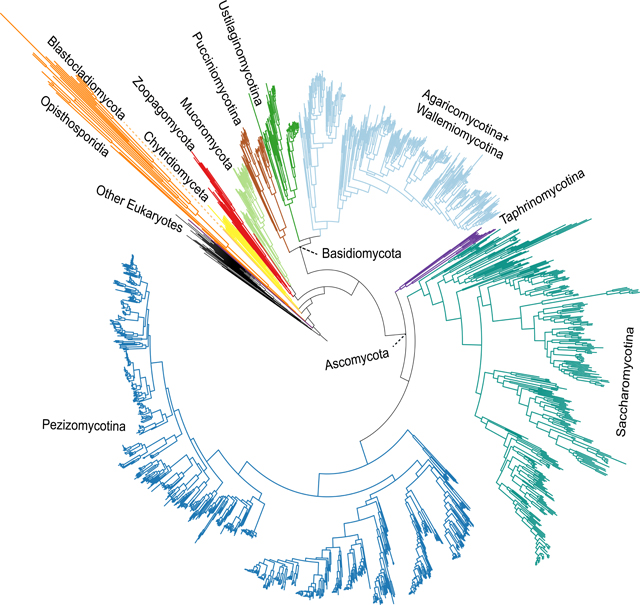
Figure 2. Genome-scale Phylogeny of 1,644 Species Spanning the Diversity of Fungi.

The topology shown is derived from maximum likelihood analysis using a concatenation single-model (LG+G4) approach on the full data matrix (1,672 taxa (1,644 fungi and 28 outgroups) and 290 genes; lnL = −78287339.984). Internal branches supported with 100% ultrafast bootstrap values are not shown; those with values lower than 100% are denoted by purple dots. Termini are labeled using order-level taxonomic names from NCBI, except for in Saccharomycotina, where informal and family-level names reflecting the 12 major clades comprising this group are used 18. Related to Figures S3, S6 and Data S2.
Figure 3. Incongruence between Concatenation- and Coalescent-based Phylogenies of Fungi.

Topologies derived from maximum likelihood analysis using (A) a concatenation single model (LG+G4) approach and (B) a coalescence approach. Numerical values below branches represent (A) ultrafast bootstrap (BS) values and (B) local posterior probabilities (LPP); unlabeled branches received 100% BS or 1.0 PP support. Termini are labeled using major lineages of fungi. Taxa in red correspond to groups inferred to be paraphyletic by the topology shown. The dashed line indicated the incongruent placements between topologies from concatenation and coalescence. Related to Figure S5 and Data S3.
In general, robustly supported relationships were more commonly found in parts of the tree with higher taxon sampling. For Ascomycota, the phylum with the highest sampling of taxa in our data matrix, ~94% of bipartitions (1,036 / 1,101) were consistently recovered across the 33 phylogenies. For example, we found that all 33 phylogenies strongly supported Taphrinomycotina as the sister lineage to a clade of Saccharomycotina and Pezizomycotina (BS = 100%; LPP = 100; q1 = 0.62) (Figures 3, 4H). Similarly, all phylogenies strongly supported a clade consisting of Pezizomycetes and Orbiliomycetes as the sister group to the remaining Pezizomycotina (Figures 3, S5). Both Saccharomycotina (332 taxa with representatives of all 12 major clades included) and Pezizomycotina (761 taxa with 9 / 17 known classes included) are the most well-sampled major lineages in our data matrix (Data S2), suggesting that genome sequencing of underrepresented taxa will improve the resolution of the fungal tree of life. Importantly, relationships among the 12 major clades of the subphylum Saccharomycotina and relationships among higher taxonomic ranks within Ascomycota recovered by our analyses are essentially the same as those of previous studies performed using different sets of genes and taxa18,19.
Figure 4. Examination of Support among Individual Gene Tees for Alternative Hypotheses for Contentious Relationships in the Fungal Phylogeny.

The gene-tree quartet frequencies (bar graphs) for alternative branching orders for contentious relationships in the fungal phylogeny. (A) Is Rozella a member of Opisthosporidia? (B) Did Blastocladiomycota diverge before or after Chytridiomyceta? (C) What are the relationships within Chytridiomyceta? (D) Is zygomycetes monophyletic? (E) What are the relationships of subphyla within Zoopagomycota? (F) Is Mortierellomycotina or Glomeromycotina sister to the rest of Mucoromycota? (G) Is there a polytomy at the base of Basidiomycota? (H) What are the relationships of subphyla within Ascomycota? Orange bars and topologies reflect the relationships inferred using a concatenation-based single model approach on the full data matrix; blue and green bars and trees correspond to the two alternative hypotheses (supported by the two alternative resolutions of each quartet). The purple tree shows whether a polytomy scenario can be rejected by the quartet analysis or not. Dashed horizontal lines mark expectation for a hard polytomy. Related to Figures S1 and S2.
Finally, we note that a recent study used the alignment-free Feature Frequency Profile (FFP) method to reconstruct a broad sketch of the fungal tree of life based on proteome data from over 400 fungal genomes34. However, it was recently shown that the performance of the FFP method is much worse than concatenation and coalescence for reconstructing the phylogeny of major and ancient lineages35, such as fungi. The poor performance of the FFP method explains why many relationships reported by Choi and Kim34 strongly contradict the current consensus view of the fungal tree of life5,19.
Most instances of incongruence stem from differences between concatenation- and coalescent-based phylogenies
By examining the distribution of incongruence across the 33 phylogenies, we found that the 21 phylogenies obtained from concatenation-based single model and data-partitioning analyses were largely congruent (Figure S4); an average of 98.6% (1,645 /1,669) of bipartitions were recovered consistently.
In contrast, 145 / 255 (average = 58.9%) incongruent bipartitions found across the 33 phylogenies were mainly due to whether the data matrix was analyzed by concatenation or coalescence (Figure S4). Furthermore, these incongruent bipartitions were more concentrated in branches toward the base of the fungal phylogeny (Figures 3, S5). By examining incongruence at the taxonomic levels of order, class, and phylum, we found four taxonomic groups that were recovered as non-monophyletic in concatenation-based analyses compared to six non-monophyletic groups in coalescent-based analyses (FigureS5; Data S3). Coalescent-based trees contradict well-established relationships supported by most previous phylogenetic studies, as well as by our concatenation-based analyses, such as the sister group relationship of Rozellomycota and Microsporidia30,36 and the monophyly of Zoopagomycota (excluding Basidiobolus) (Figures 3B and S5B)15.
The observed differences between concatenation-based and coalescent-based analyses may stem from the fact that a substantial number of internodes in individual gene trees are not well supported. We found an average of 4.99%, 6.69%, 10.74%, and 19.18% of internodes in individual gene trees that received ultrafast bootstrap support values lower than 33%, 50%, 75%, and 95%, respectively. Given that values above 95% are considered as strong support37, these results suggest that nearly one in five internodes in individual gene trees lacks robust support. Since our coalescence-based analyses directly use these gene trees to infer the coalescent-based species trees, their accuracy may be disproportionally affected (compared to the concatenation-based species trees) by the poor resolution of individual gene trees.
Another possible explanation is that 290 genes are not sufficient to robustly resolve all internal branches of a tree with hundreds of taxa. The number of genes in a phylogenomic data matrix is known to impact the accuracy of both concatenation-based38 and coalescent-based inference39. Moreover, the taxon occupancy values for non-Dikarya fungi (average of 207.02 / 290 BUSCO genes; 71.39%) are substantially lower than the ones of Dikarya (average of 279.59 / 290 BUSCO genes; 96.41%). Consequently, the placements of non-Dikarya taxa are based on many fewer genes and gene trees38.
Notwithstanding the debate on which of the two approaches is better or more appropriate for estimating species phylogenies40,41, these results suggest that concatenation-based phylogenies of this phylogenomic data matrix are likely more reliable than coalescent-based phylogenies due to the poor resolution of individual gene trees (see also Shen et al. 42).
Incongruence among major lineages and identification of ancient radiations
Although ~85% of internodes in our phylogeny of Fungi were robustly supported irrespective of approach and data matrix used, the remaining ~15% showed incongruence between analyses. Below, we discuss key incongruent relationships of interest. For each case, we present the results from our concatenation- and coalescent-based analyses, and place our results in the context of the published literature. We also tested whether the data from the 290 gene trees rejected the hypothesis that the branch in question represents a polytomy (Figure 4). Briefly, the polytomy test evaluates whether the frequencies of quartet trees (obtained from all the gene trees) are significantly different for a branch of interest43. For every quartet tree, there are three possible topologies (i.e., three alternative hypotheses noted as q1, q2, q3) of how the taxa are related. The test measures the frequencies of the quartet trees present in all gene trees; if there are no significant differences in their frequencies, then the hypothesis that the branch in question is a polytomy cannot be rejected. Given that the quartet frequencies are obtained from the individual gene trees, the analyses of Figure 4 generally reflect the results of the coalescent-based analyses.
Is Rozella a member of Opisthosporidia?
Opisthosporidia is a group of reduced, endoparasite taxa that includes Rozellomycota, Microsporidia (parasites of animals), and Aphelidiomycota (parasites of algae for which no genomes are currently available) (Figure S1). Within Opisthosporidia, our concatenation-based analyses strongly supported a clade of Rozellomycota + Microsporidia (Figures 2 and 3A). To date, only two Rozellomycota genomes have been sequenced, Paramicrosporidium saccamoebae30 and Rozella allomycis36. Both concatenation and coalescent-based analyses placed P. saccamoebae sister to Microsporidia, suggesting that Rozellomycota is paraphyletic (Figures 2 and 3). These results are largely consistent with previous gene content and phylogenetic analyses that P. saccamoebae is more closely related to Microsporidia than to other Rozellomycota (Figure S1)30. In contrast, the two approaches differed in the placement of R. allomycis (Figures 3, S5). Whereas concatenation-based analyses placed R. allomycis sister to the P. saccamoebae + Microsporidia clade (Figures 3A, S5A), coalescent-based analyses placed R. allomycis as sister to the remaining non-Opisthosporidia fungi with very low support (LPP = 0.07) (Figures 3B, S5B). Finally, quartet tree support for the concatenation-based placement (q1 = 0.31) was lower than the coalescent-based placement (q2 = 0.38) but a polytomy scenario could not be rejected (Figure 4A)36.
Given that only two genomes from Rozellomycota and none from Aphelidiomycota are available, the lack of resolution within Opisthosporidia may be due to scarce taxon sampling. Although previous phylogenomic analyses based on a single transcriptome from Aphelidiomycota placed this phylum as sister to free-living fungi8, which would render Opisthosporidia paraphyletic, further studies with more taxa will be necessary to confidently resolve relationships in this lineage.
Did Blastocladiomycota split before or after Chytridiomyceta?
The relationships between flagellated zoosporic fungi in the Blastocladiomycota and Chytridiomyceta lineages and the rest of fungi (excluding Opisthosporidia) remain ambiguous5,44–46. Our concatenation analyses placed Blastocladiomycota as sister to a clade of Chytridiomyceta and the rest of fungi with strong support (BS = 99%) (Figure 3A). In contrast, coalescent-based analyses strongly supported a sister taxon relationship between Blastocladiomycota and Chytridiomyceta (LPP = 1.00) (Figure 3B). The quartet-based analyses showed low support for the concatenation-based placement (q1 = 0.24), intermediate support for Chytridiomyceta as sister to a clade of Blastocladiomycota and the rest of fungi (q2 = 0.31), and strong support for the coalescent-based placement (q3 = 0.45) (Figure 4B). The low resolution of relationships between Blastocladiomycota and Chytridiomyceta in our coalescent-based analysis might be due to the lower taxon occupancy in these two clades (average of taxon occupancy: 73.68% in Chytridiomyceta; 42.59% in Blastocladiomycota) (Data S2). Blastocladiomycota are zoospore-producing fungi that have been previously shown to be phylogenetically distinct from Chytridiomyceta, and have characteristics that more resemble terrestrial fungi, such as well-developed hyphae, closed mitosis, cell walls with β−1–3-glucan, and a Spitzenkörper47,48. Thus, understanding the true branching order has important implications for the evolution of key traits and processes (e.g., life cycles, mitosis)5. Interestingly, a recent study suggested that two atypical zoosporic fungi, Amoeboradix gromovi and Sanchytrium tribonematis, represent a new fungal phylum sister to Blastocladiomycota 49.
Within the subkingdom Chytridiomyceta, phylogenetic relationships among Monoblepharidomycota, Chytridiomycota, and Neocallimastigomycota are also uncertain45,50. Our concatenation analyses recovered Chytridiomycota as the sister group to Monoblepharidomycota + Neocallimastigomycota (BS = 85%) (Figures 3A, S5A), whereas coalescent analyses recovered Monoblepharidomycota as the sister to Chytridiomycota + Neocallimastigomycota (LPP = 0.18) (Figures 3B, S5B). The quartet-based analyses showed lower support for the concatenation-based placement (q1 = 0.22) than for the coalescent-based placement (q2 = 0.41) or the third alternative hypothesis (q3 = 0.38) (Figure 4C). Given that one genome was sampled from Monoblepharidomycota, 13 genomes were sampled from Chytridiomycota, and five genomes were sampled from Neocallimastigomycota, additional sampling of taxa, and perhaps genes as well, will be necessary for the confident resolution of relationships within Chytridiomyceta. Interestingly, a recent phylogenomic study placed the zoosporic obligate endoparasite Olpidium bornovanus as the closest zoosporic relative of the non-flagellated terrestrial fungi51.
Is zygomycetes monophyletic?
The monophyly of zygomycetes was not supported in recent phylogenetic studies and relationships among these fungi are uncertain10,15,45,50. Consequently, several recent classifications have split zygomycetes into multiple subphyla and phyla, including Zoopagomycota and Mucoromycota11,15. Our concatenation analyses strongly supported the monophyly of Zoopagomycota and Mucoromycota (BS = 100%) (Figures 3A, S5A)11,15. Coalescent analyses recovered Mucoromycota as monophyletic, although as mentioned earlier, Chytridiomyceta and Blastocladiomycota are nested within Zoopagomycota in these coalescent-based phylogenies (Figures 3B, S5B). The quartet-based analysis shows that the quartets for the monophyly of Zoopagomycota and Mucoromycota received the highest support (q1=0.48; Figure 4D).
However, we found one subsampled data matrix (Top100_slow-evolving data matrix) that recovered the paraphyly of zygomycetes, albeit with very low support (BS = 28%) (Figure S6B). This recovered topology is largely consistent with previous analyses and Zoopagomycota is also recovered as monophyletic (BS = 28%).
To further explore the effect of gene sampling on the resolution of zygomycetes in different phylogenomic data matrices, we next quantified the support of phylogenetic signal over two alternative hypotheses (T1: zygomycetes-monophyly; T2: zygomycetes-paraphyly) using our Subset_Dikarya data matrix (see Methods) and a previously published 192-gene, 46-taxon data matrix (Spatafora2016_46taxa_192genes data matrix) (Figure 5; Data S4)15. By calculating gene-wise log-likelihood scores between T1 and T2 (∆lnL) for every gene in each matrix, we found that the proportions of genes supporting T1 versus T2 were similar in both data matrices (95 of 192: 49.5% vs 97 of 192: 50.5% in the Spatafora2016_46taxa_192genes matrix; 161 of 290: 55.5% vs 129 of 290: 44.5% in the Subset_Dikarya data matrix) (Figure 5), even though the results of our study support zygomycetes monophyly52 and those of other studies support zygomycetes paraphyly10,15,45. Thus, phylogenomic analyses of zygomycetes should be interpreted with caution until further taxon and gene sampling of taxa from the lineages in question sheds more light into this part of the fungal phylogeny.
Figure 5. Distribution of Phylogenetic Signal for two Alternative Hypotheses on the Zygomycetes Lineage.

The two alternative hypotheses are: Mucoromycota is sister to Zoopagomycota (zygomycetes-monophyly; T1 Orange), Mucoromycota is sister to Dikarya (zygomycetes-paraphyly; T2 Green). Proportions of genes supporting each of two alternative hypotheses in the Spatafora2016_46taxa_192genes and Subset_Dikaya data matrices are shown. The GLS values for each gene in each data matrix are provided in Data S4. We considered a gene with an absolute value of log-likelihood difference of two as a gene with strong (|∆lnL| > 2) or weak (|∆lnL| < 2) phylogenetic signal. Related to Data S4.
Is Zoopagomycota paraphyletic?
Zoopagomycota, a group of pathogenic and saprophytic fungi53 are thought to be a monophyletic group based on previous phylogenomic analyses15,54. Surprisingly, we found that Zoopagomycota was paraphyletic because two Basidiobolus species were placed as the sister group to Mucoromycota (Figures 2, 3 and S3). The phylogenetic placement of Basidiobolus in previous phylogenetic analyses based on genomic15 or multigene55 studies was unstable, and a recent study has suggested that many genes in Basidiobolus genomes might have been acquired from Bacteria through horizontal gene transfers56. Notably, removal of the two Basidiobolus taxa in the removal-of-rogue-taxa data matrix did not alter the monophyly of zygomycetes (Figure S6A), suggesting that this result was not affected by the topological instability of Basidiobolus.
What are the relationships of subphyla within Zoopagomycota?
The evolutionary relationships of the three subphyla within Zoopagomycota are still uncertain, with either Entomophthoromycotina15 or Zoopagomycotina54 sister to the remaining Zoopagomycota. Our concatenation-based analyses recovered Zoopagomycotina as sister to Kickxellomycotina and Entomophthoromycotina with strong support (BS = 100%) (Figure 2). This relationship is also supported in our quartet-based analysis (q1 = 0.41; q2 = 0.32; q3 = 0.27) (Figure 4E).
Is Mortierellomycotina or Glomeromycotina sister to the rest of Mucoromycota?
Within Mucoromycota, the concatenation-based analysis moderately supported Mortierellomycotina as sister to Mucoromycotina and Glomeromycotina (BS = 98%), whereas the coalescent-based analysis placed Glomeromycotina sister to the remaining Mucoromycota with low support (LPP = 0.61) (Figures 3, S5). Quartet-tree support for the concatenation-based phylogeny was largely similar to the two alternative hypotheses (q1 = 0.33; q2 = 0.31; q3 = 0.36) (Figure 4F), suggesting that a polytomy best explains relationships between subphyla of Mucoromycota based on current evidence. Nevertheless, the small number of genomes sampled suggests that these inferences may be subject to revision.
Is there a hard polytomy at the base of Basidiomycota?
Even though Basidiomycota have much denser taxon sampling than most other fungal lineages, reconstruction of the relationships among Pucciniomycotina, Ustilaginomycotina, and Agaricomycotina + Wallemiomycotina has proven challenging31,34,57,58. We too found discordant topologies between concatenation- and coalescent-based analyses (Figures 3, S5) and nearly equal support for the three alternative hypotheses (Figure 4G). Concatenation analyses placed Ustilaginomycotina with Agaricomycotina + Wallemiomycotina (BS = 100%), whereas coalescence supported Pucciniomycotina + Ustilaginomycotina (LPP = 0.41). Notably, we found that gene-tree quartet support for the three alternative hypotheses was consistent with a polytomy (q1 = 0.33, q2 = 0.34, q3 = 0.34) (Figure 4G). These results fail to reject the hypothesis that major relationships among Basidiomycota represent a hard polytomy (Figure 4G), consistent with a previous study 58 that used fewer taxa and genes (67 taxa / 134 genes); however, Bayesian MCMC and likelihood mapping analyses led the study’s authors to infer that the lack of resolution at the base of Basidiomycota does not represent a hard polytomy58. What is increasingly clear is that the origin of major lineages within Basidiomycota are likely the result of an ancient diversification. It should be noted that the Entorrhizomycota taxa were not sampled here.
Higher-level taxonomic ranks generally reflect levels of evolutionary and molecular clock divergence across the fungal kingdom
The availability of a taxon-rich genome-scale phylogeny for fungi provides an opportunity to evaluate the degree to which current fungal taxonomy reflects fungal evolutionary relationships and rates of fungal genome evolution. To test this, we normalized the fungal taxonomy ranks retrieved from the National Center for Biotechnology Information (NCBI) using the relative evolutionary divergence (RED) approach59. The RED approach normalizes the inferred phylogenetic distances between the last common ancestor of fungi (RED = 0) to all extant fungal taxa (RED = 1) to provide an approximation of the relative amount of divergence (Figure 6A).
Figure 6. Higher Level Taxonomic Ranks Generally Reflect Levels of Evolutionary Divergence across the Fungal Kingdom.

(A) Relative evolutionary divergence (RED) of taxa defined by the NCBI taxonomy based on the topology inferred from the concatenation-based single model approach. Each data point (green or orange circle) represents a taxon distributed according to its RED value (x-axis) and its taxonomic rank (y-axis). Blue bars correspond to median RED values and black bars to the RED intervals (+/− 0.1) for each rank. Orange circles represent taxa belonging to the subphylum Saccharomycotina (Ascomycota), which are the most notable instance of an underclassified lineage in the fungal kingdom. Note that RED values of ranks with a single subordinate rank will be identical to each other (e.g., class Saccharomycetes contains a single order, Saccharomycetales; thus, both ranks have the same RED value). Only a subset of taxon names is shown here; results for all taxa are reported in Data S5. (B) The Pearson correlation coefficient (Pearson’s r) between the RED values and relative divergence time estimated using relaxed-molecular clock approaches for all internal nodes. The data points associated with six fungal phyla are shown for illustration purposes. Related to Data S5.
The RED approach was developed to revise taxonomy ranks in Bacteria and Archaea so that they reflect evolutionary divergence59,60. While the RED approach has yet to be applied to fungi, several previous studies have suggested the use of divergence times as a ranking criterion61,62. Interestingly, we found that the RED values of fungal taxonomic ranks in our phylogeny are broadly consistent to their relative divergence times estimated using relaxed-molecular clock approaches (Pearson’s correlation coefficient r = −0.98, P-value < 2.2e-16) (Figure 6B). Thus, our results suggest that RED and divergence time approaches capture similar aspects of evolutionary divergence and can be used to compare fungal taxonomy ranks in a phylogeny-informed way.
Of the 6 phyla, 14 classes, 41 orders, 90 families, and 247 genera examined (Figure 6A; Data S5), we found that ~85% of ranks fell within ± 0.1 of the median RED value for taxa at that rank, suggesting they had comparable levels of evolutionary divergence. The only instance of a fungal rank that appears to be overclassified (i.e., has a much higher RED value than the rest) is the plant-associated order Diaporthales (RED = 0.897; average RED value for other fungal orders = 0.752). All other instances that were outside the ± 0.1 RED interval concerned underclassification (i.e., ranks with a much lower RED value than the rest) and were concentrated on specific lineages. Remarkably, nearly 40% (22 of 49, including 1 order, 5 families, 16 genera) of the underclassified ranks were within the Saccharomycotina subphylum of budding yeasts. Other underclassified taxa included classes Chytridiomycetes (2 / 49), Tremellomycetes (2 / 49), and Agaricomycetes (4 / 49).
The most underclassified lineage was order Zoopagales of Zoopagomycotina, whose RED value (= 0.309) was the lowest compared to other orders or classes included in our analysis. Since many Zoopagales are predacious or parasitic and non-culturable, all seven Zoopagales genomes have been sequenced using single cell sequencing methods54; thus, it is possible the low RED value in this lineage stems from the typically higher nucleotide base calling errors of single cell sequencing methods or from contamination. Moreover, it should be noted that the most serious instance of underclassification concerns the most well-sampled major lineage (Saccharomycotina). Thus, as the genomes of more species are sampled and added to the fungal phylogeny (especially from major lineages whose taxonomic diversity in not well represented in our phylogeny), it is possible that examination of RED values reveals further instances in the fungal tree of life where classification is not on par with evolutionary divergence.
Taken together, these results suggest that the current fungal classification is largely concordant with our understanding of fungal phylogeny and evolutionary divergence. However, our results also identify lineages, such as Saccharomycotina, where taxonomic rank assignment appears to not truly reflect the observed levels of evolutionary divergence (compared to assignments in the rest of the fungal kingdom), reducing the utility of taxonomy for comparative fungal biology.
DISCUSSION
Fungi have undergone extensive diversification into numerous ecological roles, morphological forms, and genomic architectures over the last one billion years (Figure 1). Resolving relationships among major groups of the fungal tree has proven challenging due to the lack of data from organisms spanning fungal diversity and the relative paucity of phylogenomic studies for the entire kingdom. By synthesizing data from more than fifteen hundred publicly available genomes, we provide a robust phylogenetic framework to explore fungal evolution and examine sources of conflict and support for the backbone of the fungal phylogeny.
We find that most parts of the fungal phylogeny are robustly resolved with our 290 gene data set, but a handful of challenging branches remain unresolved. We provide evidence that some of these relationships may actually reflect genuine instances of ancient evolutionary diversification events, or hard polytomies, such as those among subphyla in Basidiomycota. In contrast, other unresolved relationships likely stem from the relatively poor taxon and / or gene sampling of several fungal phyla, suggesting that improving the resolution of the fungal phylogeny will require continued efforts to sample genomes spanning the diversity of the fungal kingdom. This inference is further supported by the results of our examination of concatenation- and coalescent-based phylogenies from several different data matrices that vary in their gene and taxon occupancy, which also suggests that the elucidation of these unresolved relationships will likely require substantial additional data and analyses. In the case of the monophyly of the zygomycetes, we show that the distinction between a phylogenomic analysis recovering monophyly versus paraphyly rests on a handful of genes. As fungal phylogenomic analyses improve their gene and taxon sampling, it is important to be aware that while the latest genome-scale phylogenies represent the currently best supported hypotheses, they are always potentially subject to revision and improvement. Given how often phylogenomic studies contradict each other on certain contentious relationships 63,64, clearly identifying relationships that remain ambiguous, despite the many taxa, genes, and analyses, set the stage for further exploration of contentious bipartitions by sampling additional taxa and genes. Furthermore, by quantifying the support for alternative hypotheses, our approach offers a way to illuminate controversial or ambiguous relationships and generate a more accurate fungal tree of life.
Finally, our study presents a novel examination of the relationship between the current state of taxonomic classification in fungi and genomic evolutionary divergence. While fungal taxonomy broadly reflects evolutionary divergence, we identified instances of specific lineages, such as the subphylum Saccharomycotina, where the lack of correspondence hinders the utility of taxonomy as a yardstick for comparative biology. In conclusion, the generation and analyses of a phylogenomic data matrix from 1,644 species spanning the diversity of the kingdom establishes an integrated and robust phylogenetic framework for studying the evolution of fungi.
STAR METHODS
RESOURCE AVAILABILITY
Lead Contact
Further information and requests for resources should be directed to and will be fulfilled by the Lead Contact, Antonis Rokas (antonis.rokas@vanderbilt.edu).
Materials Availability
There are no materials to report.
Data and Code Availability
All genome assemblies were downloaded from NCBI and are publicly available in the Zenodo repository: https://doi.org/10.5281/zenodo.3970286. All scripts, data matrices, and phylogenetic trees are deposited at Figshare repository: https://doi.org/10.6084/m9.figshare.12751736.
EXPERIMENTAL MODEL AND SUBJECT DETAILS
Sequence data
All 1,679 fungal genomes were downloaded from NCBI and only one representative genome from every species was included (last accession date: January 30, 2020). Moreover, the genomes of 28 outgroup taxa (11 representative taxa from Holozoa and 17 representative taxa from Metazoa) were downloaded from Ensembl or NCBI (Last accession date: January 1, 2020). The outgroups were selected based on the current understanding of Opisthokonta phylogeny 24,25. NCBI taxonomy, strain ID, and source information in this study are also provided in Data S1.
METHOD DETAILS
Quality assessment
To assess the qualities of the genome assemblies of the 1,679 fungal genomes we used the Benchmarking Universal Single-Copy Orthologs (BUSCO), version 2.02.126 and the Fungi odb9 database (Last accession date: January 15, 2020). Briefly, BUSCO uses a consensus sequence built from a hidden Markov model-based alignment of orthologous sequences derived from 85 different fungal species using HMMER, version 3.1b265, as a query in tBLASTn66 to search an individual genome. A total of 290 predefined orthologs (referred to as fungal BUSCO genes) were used. To examine the presence of each BUSCO gene in a genome, gene structure was predicted using AUGUSTUS, version 2.5.567, with default parameters, from the nucleotide coordinates of putative genes identified using BLAST and then aligned to the HMM alignment of the same BUSCO gene. Genes were considered “single-copy” if there was only one complete predicted gene present in the genome, “duplicated” if there were two or more complete predicted genes for one BUSCO gene, “fragmented” if the predicted gene was shorter than 95% of the aligned sequence lengths from the 85 different fungal species, and “missing” if there was no predicted gene. For each genome, the fraction of single-copy BUSCO genes present corresponded to the completeness of each genome. To minimize missing data and remove potential low-quality genomes, we retained only those genomes that contained 100 or more single-copy BUSCO genes. The final data set contained 1,644 fungi and 28 outgroup taxa (Data S1).
Phylogenomic data matrix construction
In addition to their use as a measure of genome completeness, BUSCO genes have also been widely used as markers for phylogenomic inference in diverse lineages26, especially in exploring fungi relationships18,19,68,69. Therefore, we used the BUSCO genes to generate the full data matrix (1,672 taxa / 290 genes), as well as 11 additional data matrices by subsampling subsets of taxa or BUSCO genes. We used these 12 data matrices to assess the stability of phylogenetic relationships and identify putative sources of error in our analyses (Figure S2).
Full – data matrix #1
To construct the full data matrix, we only included single-copy BUSCO genes for each species. For each BUSCO gene, we extracted individual nucleotide sequences that have the BUSCO gene present and translated to amino acid sequences with their corresponding codon usage for each taxon (CUG-Ser1, CUG-Ser2 clades in yeasts: NCBI genetic code 12; CUG-Ala clades in yeasts: NCBI genetic code 26; all others: NCBI standard genetic code 1). Each gene was aligned with MAFFT version 7.29970 with options “—auto –maxiterate 1000”. Ambiguously aligned regions were removed using trimAl version 1.471 with the “gappyout” option. The AA alignments of these 290 BUSCO genes, each of which has more than 50% of taxon occupancy, were then concatenated into the full data matrix, which contains 124,700 amino acid sites.
Subset_Dikarya_taxa – data matrix #2
Our taxon sampling is biased toward Ascomycota and Basidiomycota (Dikarya), especially in Saccharomycotina (332 taxa; 20.1% total), Pezizomycotina (758 taxa; 46% total), and Agaricomycotina (321 taxa; 19.5% total). To discern the potential effects of biased taxon sampling (i.e., effects associated with the tree search algorithm spending most time in those parts of the tree that contain the largest numbers of taxa than in the other, less well sampled, parts of the tree), we subsampled one representative of each genus in Saccharomycotina (reducing their sampling from 332 taxa to 79; 14.6% total), and one representative of each family in Pezizomycotina (758 -> 108 taxa; 20.0% total) and in Agaricomycotina (321 -> 92 taxa; 17.0%). This sampling resulted in a data matrix with 540 taxa and 124,700 amino acid sites.
Top_100_DVMC – data matrix #3
This data matrix was constructed by retaining the top 100 BUSCO genes whose evolutionary rates were most “clock-like” (inferred by examining the degree of violation of a molecular clock (DVMC) values among single-gene trees69) and contains 51,494 amino acid sites (from all 1,672 taxa). DVMC is the standard deviation of root to tip distances in a phylogeny.
Top_100_length – data matrix #4
This data matrix was constructed by retaining the top 100 BUSCO genes with the longest alignment lengths after trimming and contains 75,529 amino acid sites (from all 1,672 taxa).
Top100_low_LB – data matrix #5
Long-Branch (LB) scores are widely used as a measurement for identifying genes that might be subject to long branch attraction72. LB score is the average of the upper quartile of the tip-to-root distances in a phylogeny and was calculated for each BUSCO gene using a customized python script (available at https://github.com/JLSteenwyk/Phylogenetic_scripts/blob/master/LB_score.py). This data matrix was constructed by retaining the top 100 BUSCO genes with the lowest average LB scores and contains 39,347 amino acid sites (from all 1,672 taxa).
Top100_low_RCFV – data matrix #6
This data matrix was constructed by retaining the 100 BUSCO genes with the lowest relative composition frequency variability (RCFV)28. Base composition heterogeneity can potentially influence phylogenetic analysis; one way to assess it is using the RCFV value measured from the frequencies of the amino acid or nucleotide data in each BUSCO gene alignment28. The RCFV value for each gene was calculated following the protocols outlined by a previous study18. This data matrix contains 60,647 amino acid sites (from all 1,672 taxa).
Top100_low_saturation – data matrix #7
This data matrix was constructed by retaining the 100 BUSCO genes with the highest values of the slope of patristic distance – i.e., sum of the lengths of the branches that link two nodes in a tree – versus uncorrected p-distance (larger slope values denote lower levels of saturation than smaller values), which are thought to improve phylogenetic inference73,74. Slope values were measured by TreSpEx28. This data matrix contains 32,947 amino acid sites (from all 1,672 taxa).
Top100_slow-evolving – data matrix #8
This data matrix was constructed by retaining the 100 BUSCO genes with the lowest values of average pairwise patristic distance, which has previously been used to evaluate if fast-evolving genes bias phylogenetic inference29,75. The average patristic distance of each gene was measured by TreSpEx28. This data matrix contains 33,111 amino acid sites (from all 1,672 taxa).
Top100_completeness – data matrix #9
This data matrix was constructed by retaining the 100 BUSCO genes with the highest taxon occupancy. This data matrix contains 42,731 amino acid sites (from all 1,672 taxa).
Top100_high_ABS data matrix – data matrix #10
This data matrix was constructed by retaining the top 100 genes with the highest average bootstrap support (ABS) value of all internal branches on the gene tree in R package ape76, which has previously been shown to improve inference77. This data matrix contains 71,225 amino acid sites (from all 1,672 taxa).
LB_taxa_removal – data matrix #11
Long-Branch (LB) scores can also be used to identify taxa that might be subject to long branch attraction72. By examining the distribution of LB scores among sampled taxa, we identified one large break (LB score > 79.0) between taxa (Data S2). Thus, we constructed this data matrix by removing the 23 taxa with an LB score > 79.0; the LB score was measured by a customized python script (https://github.com/JLSteenwyk/Phylogenetic_scripts/blob/master/LB_score.py). All 23 removed taxa were from the Microsporidia lineage. This removal resulted in a data matrix with 1,649 taxa and 124,700 amino acid sites.
Rogue_taxa_removal – data matrix #12
This data matrix was constructed by pruning 33 taxa that varied in their placement between analyses of the full data matrix by concatenation-based single model and coalescence using RogueNaRok78. A given taxon is considered a rogue taxon when its removal from the dataset results in an increase in the overall support values or in a better resolved consensus tree78. This removal resulted in a data matrix with 1,639 taxa and 124,700 amino acid sites.
Phylogenomic analyses
For the full data matrix as well as for each of these 11 data matrices constructed above, we used three different approaches to infer the fungal phylogeny: (1) the concatenation (i.e. supermatrix) approach with a single model or partition, (2) the concatenation approach with data-partitioning by gene, and (3) the multi-species coalescent-based approach that used the individual gene trees to construct the species phylogeny. All phylogenetic analyses were performed using IQ-TREE, version 1.6.879, which has previously been shown to consistently perform well in analyses of phylogenomic data in a maximum likelihood (ML) framework80.
Concatenation-based approach without and with data-partitioning
For concatenation-based analyses using a single model, we used the LG+G4 model81 because it was the best-fitting model for 89% of 290 gene trees. For analyses with data-partitioning by gene we used the best-fitting model for each gene (see coalescent-based approach section). Two independent runs were employed in all data matrices and the topological robustness of each gene tree was evaluated by 1,000 ultrafast bootstrap replicates37. A single tree search for the full data matrix (290 genes / 1,672 taxa) with a single model required ~ 4,620 CPU hours.
Coalescent-based approach
Individual gene trees were inferred using IQ-TREE, version 1.6.8 with an automatic detection for the best-fitting model with “-MFP” option using ModelFinder 82 under the Bayesian information criterion (BIC). For each gene tree, we conducted 5 independent tree searches to obtain the best-scoring ML tree with “-runs 5” option. The topological robustness of each gene tree was evaluated by 1000 ultrafast bootstrap replicates.
To account for gene tree heterogeneity by taking incomplete lineage sorting (ILS) into account, we used the individual ML gene trees to infer the coalescent-based species tree using ASTRAL-III version 5.1.1 83 for each data matrix. We applied contraction filters (BS < 33) such that poorly supported bipartitions within each gene tree were collapsed to polytomies, an approach recently suggested to improve the accuracy of ASTRAL43. The topological robustness was evaluated using the local posterior probability (LPP).
Quantification of incongruence
From the set of 12 data matrices (the full one and 11 subsampled ones) and 3 analyses (concatenation with single model, concatenation with data-partitioning, and coalescence), we expect a total of 36 phylogenies. Data matrices 2, 11, and 12 have different sets of taxa that have been removed, so they cannot be straightforwardly compared to the rest of the data matrices, which contain the full set of taxa. To reduce the burden of computation (each tree search required thousands of CPU hours), we did not perform concatenation-based data-partitioning analyses for data matrices 1, 11 and 12. Thus, a total of 33 phylogenetic trees were compared. Lastly, we rooted each concatenation and coalescence tree based on outgroups using the ape and phangorn R packages and visualized it using ITOL v484.
For the 33 species phylogenies inferred from the 12 data matrices (12 from concatenation-based single model analyses, 9 from concatenation-based data-partitioning analyses, and 12 from coalescent-based analyses), we quantified the degree of incongruence for every internode by considering all prevalent conflicting bipartitions among individual ML gene trees77,85 using the “compare” function in Gotree version 1.13.6 (https://github.com/evolbioinfo/gotree).
It should be noted that all our trees suggested Agaricales is paraphyletic due to Pleurotus eryngii being placed within Russulales. In contrast to other three Pleurotus species, the P. eryngii genome contains a significantly higher amount of duplicated BUSCO genes (166 / 290 genes) (Data S1A). Moreover, we blasted several single-copy BUSCO genes from the P. eryngii genome to GenBank and found the top BLAST hits were from Russulales instead of Agaricales species. Thus, these results suggested that the paraphyletic of Agaricales might be a result of misidentification or contamination of the P. eryngii genome.
Polytomy test
To examine the support in individual gene trees for contentious bipartitions (and the alternative, conflicting bipartitions) and potentially identify evidence for hard polytomies of major fungal lineages, we used the polytomy test in ASTRAL, version 1.6.843. The test evaluates whether a polytomy can be rejected by examining the frequencies of the three alternative quartet tree topologies in a set of trees. In our case, we used all gene trees as input for the calculation of the frequencies of the three alternative quartet trees for bipartitions of interest. In all cases, we used a P value cutoff of < 0.05 to reject the null hypothesis of a polytomy (see Figure 4 for eight tested hypotheses). We used scripts available at https://github.com/smirarab/1kp/tree/master/scripts/hypo-test. We used pos-for-hyp-4–11-2.sh (-t 4 option) and quart-for-hyp-4–11-2.sh (-t 8 option) to compute the posterior probabilities for all three alternative topologies of a given quartet. To evaluate the discordance of gene trees in our single-copy gene data set, we used the Q value in ASTRAL to display the percentages of quartets in gene trees in support of the topology inferred by concatenation (q1) as well as the other two possible alternative topologies (q2 and q3); We used poly-for-hyp-4–11-02.sh to compute the p-value for a hard polytomy under the null hypothesis using ASTRAL (-t 10 option).
Quantification of the distribution of phylogenetic signal
To investigate the distribution of phylogenetic signal of whether zygomycetes are monophyletic or paraphyletic, we considered two data matrices that had different topologies between ML analyses. To save computation time, we used the subset Dikarya data matrix (#2) since it has essentially the same topology as the full data matrix but has many fewer taxa. We also analyzed the Spatafora2016_46taxa_192genes data matrix from a previous study that recovered the paraphyly of zygomycetes15. We examined two hypotheses: zygomycetes-monophyly (T1) and zygomycetes-paraphyly (T2: Zoopagomycota sister to Dikarya + Mucoromycota). For ML analysis in each data matrix, site-wise likelihood scores were inferred for both hypotheses using IQ-TREE, version 1.6.8 (option -g) with the LG+G4 model. The two different phylogenetic trees passed to IQ-TREE (via -z) were the tree where zygomycetes is monophyletic and a tree modified to have Zoopagomycota placed as the sister to Dikarya + Mucoromycota. The numbers of genes and sites supporting each hypothesis were calculated from IQ-TREE output and Perl scripts from a previous study63. By calculating gene-wise log-likelihood scores between T1 and T2 for every gene, we considered a gene with an absolute value of log-likelihood difference of two as a gene with strong (|∆lnL| > 2) or weak (|∆lnL| < 2) phylogenetic signal as done in a previous study86.
RED index
To evaluate whether fungal taxonomy is consistent with evolutionary genomic divergence, we calculated relative evolutionary divergence (RED) values from the annotated tree inferred from the full data matrix using concatenation with a single model by PhyloRank (v0.0.37; https://github.com/dparks1134/PhyloRank/), as described previously59. Briefly, the NCBI taxonomy associated with every fungal genome was obtained from the NCBI Taxonomy FTP site on January 17, 2020. PhyloRank linearly interpolates the RED values of every internal node according to lineage-specific rates of evolution under the constraints of the root being defined as zero and the RED of all present taxa being defined as one59,60. The RED intervals for each rank were defined as the median RED value ± 0.1 to serve as a guide for the normalization of taxonomic ranks from genus to phylum.
We also compared RED values to relative time divergence under a relaxed-molecular clock model for every taxonomic rank from genus to phylum, since both methods are based on inferring lineage-specific rates of evolution. We used the RelTime algorithm employed in the command line version of MEGA7 87 since it is computationally much less demanding than Bayesian tree-dating methods. We conducted divergence time estimation using the full data matrix with the same ML tree that we used for the RED analysis (see above) without fossil calibrations. Correlation between the RED values and relative divergence time estimated by RelTime was calculated using Pearson’s correlation coefficient using the cor.test function in R package stats v.3.6.288.
Quantification and Statistical Analysis
Best-fitting phylogenetic models were selected according to the Bayesian Information Criterion implemented in IQ-Tree79. Branch supports were estimated using UFBoot237 bootstrapping in IQ-Tree. The topological robustness was evaluated using the local posterior probability (LPP) in ASTRAL39. For polytomy test, we used a P value cutoff of < 0.05 to reject the null hypothesis of a polytomy43.
Supplementary Material
(A) Taxonomy, strain ID, and source information of 1,104 Ascomycota genomes. (B) Taxonomy, strain ID, and source information of 540 fungal genomes that do not belong to Ascomycota. (C) Taxonomy, strain ID, and source information of Holozoa genomes used as outgroups.
(A) Gene statistics of 290 fungal BUSCO genes used in subsampled data matrices. (B) The Long-Branch score calculated for each taxon used for LB_taxa_removal (matrix #11). (C) Gene occupancy for each taxon across different phylogenomic matrices. (D) Annotation for 290 fungal BUSCO genes used in the study (Annotation details are provided from BUSCO).
(A) An examination of monophyletic lineages in phylum level. (B) An examination of monophyletic lineages in subphylum level. (C) An examination of monophyletic lineages in class level.
(A) Distribution of phylogenetic signal for the Spatafora2016 data matrix. (B) Distribution of phylogenetic signal for the Subset_Dikarya data matrix.
(A) RED values for each fungal taxon. (B) Relative divergence time for each fungal taxon.
KEY RESOURCES TABLE
Highlights.
Genome-scale phylogeny of the fungal kingdom based on 290 genes and 1,644 species
85% of inferred phylogenetic relationships among fungi are robustly supported
Certain unresolved relationships may be due to ancient diversification events
Fungal higher rank taxonomy broadly reflects organisms’ genome sequence divergence
Acknowledgments
We thank members of the Rokas laboratory for discussions and comments, Phil Hugenholtz for encouraging us to use relative evolutionary distance to examine the correspondence between genome sequence divergence and taxonomic rank across fungi, and Donovan Parks for initial help with getting relative evolutionary distance analyses working. This work was conducted in part using the resources of the Advanced Computing Center for Research and Education (ACCRE) at Vanderbilt University and Yale Center for Research Computing (Farnam HPC cluster) for use of the research computing infrastructure. Yuanning Li was partially supported by a scholarship from the China Scholarship Council (CSC) for studying and living abroad. This work was supported by the National Science Foundation (DEB-1442113 to A.R.; DEB-1442148 to C.T.H.; DEB-1929738 and DEB-1441677 to T.Y.J.; DEB-1557110 and DEB-1441715 to J.E.S; DEB-1441604 to J.W.S), in part by the DOE Great Lakes Bioenergy Research Center (DOE Office of Science BER DE-FC02- 07ER64494), and the USDA National Institute of Food and Agriculture (Hatch project 1003258 to C.T.H.; Hatch project CA-R-PPA-5062-H to J.E.S.). C.T.H. is a Pew Scholar in the Biomedical Sciences and a H. I. Romnes Faculty Fellow, supported by the Pew Charitable Trusts and Office of the Vice Chancellor for Research and Graduate Education with funding from the Wisconsin Alumni Research Foundation, respectively. X.X.S. was supported by the start-up grant from the “Hundred Talents Program” at Zhejiang University and the Fundamental Research Funds for the Central Universities (2020QNA6019). J.E.S. is a Fellow in the CIFAR program Fungal Kingdom: Threats and Opportunities. J.L.S. and A.R. were supported by the Howard Hughes Medical Institute through the James H. Gilliam Fellowships for Advanced Study program. A.R. received additional support from the Guggenheim Foundation, the Burroughs Wellcome Fund, and the National Institutes of Health/National Institute of Allergy and Infectious Diseases (R56 AI146096).
Footnotes
Declaration of Interests
The authors declare that there is no conflict of interest.
Publisher's Disclaimer: This is a PDF file of an unedited manuscript that has been accepted for publication. As a service to our customers we are providing this early version of the manuscript. The manuscript will undergo copyediting, typesetting, and review of the resulting proof before it is published in its final form. Please note that during the production process errors may be discovered which could affect the content, and all legal disclaimers that apply to the journal pertain.
References
- 1.Heitman J, Howlett BJ, Crous PW, Stukenbrock EH, James TY, and Gow NAR (2017). The Fungal Kingdom (John Wiley & Sons; ). [Google Scholar]
- 2.Blackwell M. (2011). The Fungi: 1, 2, 3… 5.1 million species? Am. J. Bot 98, 426–438. [DOI] [PubMed] [Google Scholar]
- 3.Hawksworth DL, and Lücking R. (2017). Fungal Diversity Revisited: 2.2 to 3.8 Million Species. The Fungal Kingdom, 79–95. [DOI] [PMC free article] [PubMed] [Google Scholar]
- 4.Lutzoni F, Nowak MD, Alfaro ME, Reeb V, Miadlikowska J, Krug M, Arnold AE, Lewis LA, Swofford DL, Hibbett D, et al. (2018). Contemporaneous radiations of fungi and plants linked to symbiosis. Nat. Commun 9, 5451. [DOI] [PMC free article] [PubMed] [Google Scholar]
- 5.James TY, Stajich JE, Hittinger CT, and Rokas A. (2020). Toward a Fully Resolved Fungal Tree of Life. Annu. Rev. Microbiol 74, 291–313. [DOI] [PubMed] [Google Scholar]
- 6.Wijayawardene NN, Hyde KD, Al-Ani L, Tedersoo L, Haelewaters D, Rajeshkumar KC, Zhao RL, Aptroot A, Leontyev DV, Saxena RK, et al. (2020). Outline of Fungi and fungus-like taxa. Mycosphere, 11, 1060–1456. [Google Scholar]
- 7.Spatafora JW, Aime MC, Grigoriev IV, Martin F, Stajich JE, and Blackwell M. (2017). The Fungal Tree of Life: from Molecular Systematics to Genome-Scale Phylogenies. The Fungal Kingdom, 1–34. [DOI] [PMC free article] [PubMed] [Google Scholar]
- 8.Torruella G, Grau-Bové X, Moreira D, Karpov SA, Burns JA, Sebé-Pedrós A, Völcker E, and López-García P. (2018). Global transcriptome analysis of the aphelid supports the phagotrophic origin of fungi. Commun Biol 1, 231. [DOI] [PMC free article] [PubMed] [Google Scholar]
- 9.Bass D, Czech L, Williams BAP, Berney C, Dunthorn M, Mahé F, Torruella G, Stentiford GD, and Williams TA (2018). Clarifying the Relationships between Microsporidia and Cryptomycota. J. Eukaryot. Microbiol 65, 773–782. [DOI] [PMC free article] [PubMed] [Google Scholar]
- 10.James TY, Kauff F, Schoch CL, Matheny PB, Hofstetter V, Cox CJ, Celio G, Gueidan C, Fraker E, Miadlikowska J, et al. (2006). Reconstructing the early evolution of Fungi using a six-gene phylogeny. Nature 443, 818–822. [DOI] [PubMed] [Google Scholar]
- 11.Hibbett DS, Binder M, Bischoff JF, Blackwell M, Cannon PF, Eriksson OE, Huhndorf S, James T, Kirk PM, Lücking R, et al. (2007). A higher-level phylogenetic classification of the Fungi. Mycol. Res 111, 509–547. [DOI] [PubMed] [Google Scholar]
- 12.Alexopoulos CJ, Mims CW, Blackwell M, and Others (1996). Introductory mycology (John Wiley and Sons; ). [Google Scholar]
- 13.Schüβler A, Schwarzott D, and Walker C. (2001). A new fungal phylum, the Glomeromycota: phylogeny and evolution* *Dedicated to Manfred Kluge (Technische Universität Darmstadt) on the occasion of his retirement. Mycol. Res 105, 1413–1421. [Google Scholar]
- 14.Capella-Gutiérrez S, Marcet-Houben M, and Gabaldón T. (2012). Phylogenomics supports microsporidia as the earliest diverging clade of sequenced fungi. BMC Biol. 10, 47. [DOI] [PMC free article] [PubMed] [Google Scholar]
- 15.Spatafora JW, Chang Y, Benny GL, Lazarus K, Smith ME, Berbee ML, Bonito G, Corradi N, Grigoriev I, Gryganskyi A, et al. (2016). A phylum-level phylogenetic classification of zygomycete fungi based on genome-scale data. Mycologia 108, 1028–1046. [DOI] [PMC free article] [PubMed] [Google Scholar]
- 16.Varga T, Krizsán K, Földi C, Dima B, Sánchez-García M, Sánchez-Ramírez S, Szöllősi GJ, Szarkándi JG, Papp V, Albert L, et al. (2019). Megaphylogeny resolves global patterns of mushroom evolution. Nature Ecology & Evolution 3, 668–678. [DOI] [PMC free article] [PubMed] [Google Scholar]
- 17.Kiss E, Hegedüs B, Virágh M, Varga T, Merényi Z, Kószó T, Bálint B, Prasanna AN, Krizsán K, Kocsubé S, et al. (2019). Comparative genomics reveals the origin of fungal hyphae and multicellularity. Nat. Commun 10, 4080. [DOI] [PMC free article] [PubMed] [Google Scholar]
- 18.Shen X-X, Opulente DA, Kominek J, Zhou X, Steenwyk JL, Buh KV, Haase MAB, Wisecaver JH, Wang M, Doering DT, et al. (2018). Tempo and Mode of Genome Evolution in the Budding Yeast Subphylum. Cell 175, 1533–1545.e20. [DOI] [PMC free article] [PubMed] [Google Scholar]
- 19.Shen X-X, Steenwyk JL, LaBella AL, Opulente DA, Zhou X, Kominek J, Li Y, Groenewald M, Hittinger CT, and Rokas A. (2020). Genome-scale phylogeny and contrasting modes of genome evolution in the fungal phylum Ascomycota. Sci Adv 6, 45. [DOI] [PMC free article] [PubMed] [Google Scholar]
- 20.Grigoriev IV, Nikitin R, Haridas S, Kuo A, Ohm R, Otillar R, Riley R, Salamov A, Zhao X, Korzeniewski F, et al. (2014). MycoCosm portal: gearing up for 1000 fungal genomes. Nucleic Acids Res. 42, D699–D704, [DOI] [PMC free article] [PubMed] [Google Scholar]
- 21.Hittinger CT, Rokas A, Bai FY, Boekhout T, Gonçalves P, Jeffries TW, Kominek J, Lachance MA, Libkind D, Rosa CA, et al. (2015). Genomics and the making of yeast biodiversity. Curr. Opin. Genet. Dev 35, 100–109. [DOI] [PMC free article] [PubMed] [Google Scholar]
- 22.Haridas S, Albert R, Binder M, Bloem J, LaButti K, Salamov A, Andreopoulos B, Baker SE, Barry K, Bills G, et al. (2020). 101 Dothideomycetes genomes: A test case for predicting lifestyles and emergence of pathogens. Stud. Mycol 96, 141–153. [DOI] [PMC free article] [PubMed] [Google Scholar]
- 23.Kjærbølling I, Vesth TC, Frisvad JC, Nybo JL, Theobald S, Kuo A, Bowyer P, Matsuda Y, Mondo S, Lyhne EK, et al. (2018). Linking secondary metabolites to gene clusters through genome sequencing of six diverse Aspergillus species. Proc. Natl. Acad. Sci. U. S. A 115, E753–E761. [DOI] [PMC free article] [PubMed] [Google Scholar]
- 24.Torruella G, Derelle R, Paps J, Lang BF, Roger AJ, Shalchian-Tabrizi K, and Ruiz-Trillo I. (2012). Phylogenetic relationships within the Opisthokonta based on phylogenomic analyses of conserved single-copy protein domains. Mol. Biol. Evol 29, 531–544. [DOI] [PMC free article] [PubMed] [Google Scholar]
- 25.Brown MW, Spiegel FW, and Silberman JD (2009). Phylogeny of the “Forgotten” Cellular Slime Mold, Fonticula alba, Reveals a Key Evolutionary Branch within Opisthokonta. Mol. Biol. Evol 26, 2699–2709. [DOI] [PubMed] [Google Scholar]
- 26.Waterhouse RM, Seppey M, Simão FA, Manni M, Ioannidis P, Klioutchnikov G, Kriventseva EV, and Zdobnov EM (2018). BUSCO Applications from Quality Assessments to Gene Prediction and Phylogenomics. Mol. Biol. Evol 35, 543–548. [DOI] [PMC free article] [PubMed] [Google Scholar]
- 27.Zdobnov EM, Tegenfeldt F, Kuznetsov D, Waterhouse RM, Simão FA, Ioannidis P, Seppey M, Loetscher A, and Kriventseva EV (2017). OrthoDB v9.1: cataloging evolutionary and functional annotations for animal, fungal, plant, archaeal, bacterial and viral orthologs. Nucleic Acids Res. 45, D744–D749. [DOI] [PMC free article] [PubMed] [Google Scholar]
- 28.Struck TH (2014). TreSpEx–-Detection of Misleading Signal in Phylogenetic Reconstructions Based on Tree Information. Evol. Bioinform. Online 10, EBO.S14239. [DOI] [PMC free article] [PubMed] [Google Scholar]
- 29.Kocot KM, Struck TH, Merkel J, Waits DS, Todt C, Brannock PM, Weese DA, Cannon JT, Moroz LL, Lieb B, et al. (2017). Phylogenomics of Lophotrochozoa with Consideration of Systematic Error. Syst. Biol 66, 256–282. [DOI] [PubMed] [Google Scholar]
- 30.Quandt CA, Beaudet D, Corsaro D, Walochnik J, Michel R, Corradi N, and James TY (2017). The genome of an intranuclear parasite, Paramicrosporidium saccamoebae, reveals alternative adaptations to obligate intracellular parasitism. Elife 6, E29594. [DOI] [PMC free article] [PubMed] [Google Scholar]
- 31.Padamsee M, Kumar TKA, Riley R, Binder M, Boyd A, Calvo AM, Furukawa K, Hesse C, Hohmann S, James TY, et al. (2012). The genome of the xerotolerant mold Wallemia sebi reveals adaptations to osmotic stress and suggests cryptic sexual reproduction. Fungal Genet. Biol 49, 217–226. [DOI] [PubMed] [Google Scholar]
- 32.Zajc J, Liu Y, Dai W, Yang Z, Hu J, Gostinčar C, and Gunde-Cimerman N. (2013). Genome and transcriptome sequencing of the halophilic fungus Wallemia ichthyophaga: haloadaptations present and absent. BMC Genomics 14, 617. [DOI] [PMC free article] [PubMed] [Google Scholar]
- 33.Zhao R-L, Li G-J, Sánchez-Ramírez S, Stata M, Yang Z-L, Wu G, Dai Y-C, He S-H, Cui B-K, Zhou J-L, et al. (2017). A six-gene phylogenetic overview of Basidiomycota and allied phyla with estimated divergence times of higher taxa and a phyloproteomics perspective. Fungal Divers. 84, 43–74. [Google Scholar]
- 34.Choi J, and Kim S-H (2017). A genome Tree of Life for the Fungi kingdom. Proc. Natl. Acad. Sci. U. S. A 114, 9391–9396. [DOI] [PMC free article] [PubMed] [Google Scholar]
- 35.Li Y, David KT, Shen X-X, Steenwyk JL, Halanych KM, and Rokas A. (2020). Feature Frequency Profile-based phylogenies are inaccurate. Proc. Natl. Acad. Sci. U. S. A 117, 31580–31581. [DOI] [PMC free article] [PubMed] [Google Scholar]
- 36.James TY, Pelin A, Bonen L, Ahrendt S, Sain D, Corradi N, and Stajich JE (2013). Shared signatures of parasitism and phylogenomics unite Cryptomycota and microsporidia. Curr. Biol 23, 1548–1553. [DOI] [PubMed] [Google Scholar]
- 37.Hoang DT, Chernomor O, von Haeseler A, Minh BQ, and Vinh LS (2018). UFBoot2: Improving the Ultrafast Bootstrap Approximation. Mol. Biol. Evol 35, 518–522. [DOI] [PMC free article] [PubMed] [Google Scholar]
- 38.Rokas A, Williams BL, King N, and Carroll SB (2003). Genome-scale approaches to resolving incongruence in molecular phylogenies. Nature 425, 798–804. [DOI] [PubMed] [Google Scholar]
- 39.Zhang C, Rabiee M, Sayyari E, and Mirarab S. (2018). ASTRAL-III: polynomial time species tree reconstruction from partially resolved gene trees. BMC Bioinformatics 19, 153. [DOI] [PMC free article] [PubMed] [Google Scholar]
- 40.Gatesy J, and Springer MS (2014). Phylogenetic analysis at deep timescales: unreliable gene trees, bypassed hidden support, and the coalescence/concatalescence conundrum. Mol. Phylogenet. Evol 80, 231–266. [DOI] [PubMed] [Google Scholar]
- 41.Edwards SV, Xi Z, Janke A, Faircloth BC, McCormack JE, Glenn TC, Zhong B, Wu S, Lemmon EM, Lemmon AR, et al. (2016). Implementing and testing the multispecies coalescent model: A valuable paradigm for phylogenomics. Molecular Phylogenetics and Evolution 94, 447–462. [DOI] [PubMed] [Google Scholar]
- 42.Shen X-X, Li Y, Hittinger CT, Chen X-X, and Rokas A. (2020). An investigation of irreproducibility in maximum likelihood phylogenetic inference. Nat. Commun 11, 6096. [DOI] [PMC free article] [PubMed] [Google Scholar]
- 43.Sayyari E, and Mirarab S. (2018). Testing for Polytomies in Phylogenetic Species Trees Using Quartet Frequencies. Genes 9, 132. [DOI] [PMC free article] [PubMed] [Google Scholar]
- 44.Ebersberger I, de Matos Simoes R, Kupczok A, Gube M, Kothe E, Voigt K, and von Haeseler A. (2012). A consistent phylogenetic backbone for the fungi. Mol. Biol. Evol 29, 1319–1334. [DOI] [PMC free article] [PubMed] [Google Scholar]
- 45.Chang Y, Wang S, Sekimoto S, Aerts AL, Choi C, Clum A, LaButti KM, Lindquist EA, Yee Ngan C, Ohm RA, et al. (2015). Phylogenomic Analyses Indicate that Early Fungi Evolved Digesting Cell Walls of Algal Ancestors of Land Plants. Genome Biol. Evol 7, 1590–1601. [DOI] [PMC free article] [PubMed] [Google Scholar]
- 46.Torruella G, de Mendoza A, Grau-Bové X, Antó M, Chaplin MA, del Campo J, Eme L, Pérez-Cordón G, Whipps CM, Nichols KM, et al. (2015). Phylogenomics Reveals Convergent Evolution of Lifestyles in Close Relatives of Animals and Fungi. Curr. Biol 25, 2404–2410. [DOI] [PubMed] [Google Scholar]
- 47.Ruiz-Herrera J, and Ortiz-Castellanos L. (2019). Cell wall glucans of fungi. A review. The Cell Surface 5, 100022. [DOI] [PMC free article] [PubMed] [Google Scholar]
- 48.Dee JM, Mollicone M, Longcore JE, Roberson RW, and Berbee ML (2015). Cytology and molecular phylogenetics of Monoblepharidomycetes provide evidence for multiple independent origins of the hyphal habit in the Fungi. Mycologia 107, 710–728. [DOI] [PubMed] [Google Scholar]
- 49.Galindo LJ, Lopez-Garcia P, Torruella G, Karpov SA, and Moreira D. (2020). Phylogenomics of a new fungal phylum reveals multiple waves of reductive evolution across Holomycota. bioRxiv 2020.09.16.389700. [DOI] [PMC free article] [PubMed] [Google Scholar]
- 50.Liu Y, Steenkamp ET, Brinkmann H, Forget L, Philippe H, and Lang BF (2009). Phylogenomic analyses predict sistergroup relationship of nucleariids and fungi and paraphyly of zygomycetes with significant support. BMC Evol. Biol 9, 272. [DOI] [PMC free article] [PubMed] [Google Scholar]
- 51.Chang Y, Rochon D, Sekimoto S, Wang Y, Chovatia M, Sandor L, Salamov A, Grigoriev IV, Stajich JE, and Spatafora JW (2020). Genome-scale phylogenetic analyses confirm Olpidium as the closest living zoosporic fungus to the non-flagellated, terrestrial fungi. BioRxiv, 298935. [DOI] [PMC free article] [PubMed] [Google Scholar]
- 52.Sekimoto S, Rochon D ‘ann, Long JE, Dee JM, and Berbee ML (2011). A multigene phylogeny of Olpidium and its implications for early fungal evolution. BMC Evol. Biol 11, 331. [DOI] [PMC free article] [PubMed] [Google Scholar]
- 53.Berbee ML, James TY, and Strullu-Derrien C. (2017). Early Diverging Fungi: Diversity and Impact at the Dawn of Terrestrial Life. Annual Review of Microbiology 71, 41–60. [DOI] [PubMed] [Google Scholar]
- 54.Davis WJ, Amses KR, Benny GL, Carter-House D, Chang Y, Grigoriev I, Smith ME, Spatafora JW, Stajich JE, and James TY (2019). Genome-scale phylogenetics reveals a monophyletic Zoopagales (Zoopagomycota, Fungi). Mol. Phylogenet. Evol 133, 152–163. [DOI] [PMC free article] [PubMed] [Google Scholar]
- 55.Gryganskyi AP, Humber RA, Smith ME, Hodge K, Huang B, Voigt K, and Vilgalys R. (2013). Phylogenetic lineages in Entomophthoromycota . Persoonia 30, 94–105. [DOI] [PMC free article] [PubMed] [Google Scholar]
- 56.Tabima JF, Trautman IA, Chang Y, Wang Y, Mondo SJ, Salamov A, Grigoriev IV, Stajich JE, and Spatafora JW (2020). Phylogenomic analyses of non-Dikarya fungi supports horizontal gene transfer driving diversification of secondary metabolism in the amphibian gastrointestinal symbiont, Basidiobolus. 10, 3417–3433. [DOI] [PMC free article] [PubMed] [Google Scholar]
- 57.He M-Q, Zhao R-L, Hyde KD, Begerow D, Kemler M, Yurkov A, McKenzie EHC, Raspé O, Kakishima M, Sánchez-Ramírez S, et al. (2019). Notes, outline and divergence times of Basidiomycota. Fungal Divers. 99, 105–367. [Google Scholar]
- 58.Prasanna AN, Gerber D, Kijpornyongpan T, Aime MC, Doyle VP, and Nagy LG (2020). Model Choice, Missing Data, and Taxon Sampling Impact Phylogenomic Inference of Deep Basidiomycota Relationships. Syst. Biol 69, 17–37. [DOI] [PMC free article] [PubMed] [Google Scholar]
- 59.Parks DH, Chuvochina M, Waite DW, Rinke C, Skarshewski A, Chaumeil P-A, and Hugenholtz P. (2018). A standardized bacterial taxonomy based on genome phylogeny substantially revises the tree of life. Nat. Biotechnol 36, 996–1004. [DOI] [PubMed] [Google Scholar]
- 60.Rinke C, Chuvochina M, Mussig AJ, Chaumeil P-A, Waite DW, Whitman WB, Parks DH, and Hugenholtz P. (2020). A rank-normalized archaeal taxonomy based on genome phylogeny resolves widespread incomplete and uneven classifications. bioRxiv, 2020.03.01.972265. [Google Scholar]
- 61.Avise JC, and Johns GC (1999). Proposal for a standardized temporal scheme of biological classification for extant species. Proc. Natl. Acad. Sci. U. S. A 96, 7358–7363. [DOI] [PMC free article] [PubMed] [Google Scholar]
- 62.Tedersoo L, Sánchez-Ramírez S, Kõljalg U, Bahram M, Döring M, Schigel D, May T, Ryberg M, and Abarenkov K. (2018). High-level classification of the Fungi and a tool for evolutionary ecological analyses. Fungal Divers. 90, 135–159. [Google Scholar]
- 63.Shen X-X, Hittinger CT, and Rokas A. (2017). Contentious relationships in phylogenomic studies can be driven by a handful of genes. Nat Ecol Evol 1, 126. [DOI] [PMC free article] [PubMed] [Google Scholar]
- 64.Li Y, Shen X-X, Evans B, Dunn CW, and Rokas A. (2020). Rooting the animal tree of life. Cold Spring Harbor Laboratory, 2020.10.27.357798. [Google Scholar]
- 65.Zhang Z, and Wood WI (2003). A profile hidden Markov model for signal peptides generated by HMMER. Bioinformatics 19, 307–308. [DOI] [PubMed] [Google Scholar]
- 66.Gertz EM, Yu Y-K, Agarwala R, Schäffer AA, and Altschul SF (2006). Composition-based statistics and translated nucleotide searches: improving the TBLASTN module of BLAST. BMC Biol. 4, 41. [DOI] [PMC free article] [PubMed] [Google Scholar]
- 67.Stanke M, Keller O, Gunduz I, Hayes A, Waack S, and Morgenstern B. (2006). AUGUSTUS: ab initio prediction of alternative transcripts. Nucleic Acids Res. 34, W435–W439. [DOI] [PMC free article] [PubMed] [Google Scholar]
- 68.Shen X-X, Zhou X, Kominek J, Kurtzman CP, Hittinger CT, and Rokas A. (2016). Reconstructing the Backbone of the Saccharomycotina Yeast Phylogeny Using Genome-Scale Data. G3 6, 3927–3939. [DOI] [PMC free article] [PubMed] [Google Scholar]
- 69.Steenwyk JL, Shen X-X, Lind AL, Goldman GH, and Rokas A. (2019). A Robust Phylogenomic Time Tree for Biotechnologically and Medically Important Fungi in the Genera Aspergillus and Penicillium. MBio 10, e00925–19. [DOI] [PMC free article] [PubMed] [Google Scholar]
- 70.Katoh K, and Standley DM (2013). MAFFT multiple sequence alignment software version 7: improvements in performance and usability. Mol. Biol. Evol 30, 772–780. [DOI] [PMC free article] [PubMed] [Google Scholar]
- 71.Capella-Gutiérrez S, Silla-Martínez JM, and Gabaldón T. (2009). trimAl: a tool for automated alignment trimming in large-scale phylogenetic analyses. Bioinformatics 25, 1972–1973. [DOI] [PMC free article] [PubMed] [Google Scholar]
- 72.Felsenstein J. (1978). Cases in which Parsimony or Compatibility Methods will be Positively Misleading. Syst. Biol 27, 401–410. [Google Scholar]
- 73.Struck TH, Nesnidal MP, Purschke G, and Halanych KM (2008). Detecting possibly saturated positions in 18S and 28S sequences and their influence on phylogenetic reconstruction of Annelida (Lophotrochozoa). Mol. Phylogenet. Evol 48, 628–645. [DOI] [PubMed] [Google Scholar]
- 74.Kocot KM, Struck TH, Merkel J, Waits DS, Todt C, Brannock PM, Weese DA, Cannon JT, Moroz LL, Lieb B, et al. (2017). Phylogenomics of Lophotrochozoa with Consideration of Systematic Error. Syst. Biol 66, 256–282. [DOI] [PubMed] [Google Scholar]
- 75.Whelan NV, Kocot KM, Moroz LL, and Halanych KM (2015). Error, signal, and the placement of Ctenophora sister to all other animals. Proc. Natl. Acad. Sci. U. S. A 112, 5773–5778. [DOI] [PMC free article] [PubMed] [Google Scholar]
- 76.Paradis E, and Schliep K. (2019). ape 5.0: an environment for modern phylogenetics and evolutionary analyses in R. Bioinformatics 35, 526–528. [DOI] [PubMed] [Google Scholar]
- 77.Salichos L, and Rokas A. (2013). Inferring ancient divergences requires genes with strong phylogenetic signals. Nature 497, 327–331. [DOI] [PubMed] [Google Scholar]
- 78.Aberer AJ, Krompass D, and Stamatakis A. (2013). Pruning rogue taxa improves phylogenetic accuracy: an efficient algorithm and webservice. Syst. Biol 62, 162–166. [DOI] [PMC free article] [PubMed] [Google Scholar]
- 79.Minh BQ, Schmidt HA, Chernomor O, Schrempf D, Woodhams MD, von Haeseler A, and Lanfear R. (2020). IQ-TREE 2: New models and efficient methods for phylogenetic inference in the genomic era. Mol. Biol. Evol 37, 1530–1534. [DOI] [PMC free article] [PubMed] [Google Scholar]
- 80.Zhou X, Shen X-X, Hittinger CT, and Rokas A. (2018). Evaluating Fast Maximum Likelihood-Based Phylogenetic Programs Using Empirical Phylogenomic Data Sets. Mol. Biol. Evol 35, 486–503. [DOI] [PMC free article] [PubMed] [Google Scholar]
- 81.Le SQ, Lartillot N, and Gascuel O. (2008). Phylogenetic mixture models for proteins. Philos. Trans. R. Soc. Lond. B Biol. Sci 363, 3965–3976. [DOI] [PMC free article] [PubMed] [Google Scholar]
- 82.Kalyaanamoorthy S, Minh BQ, Wong TKF, von Haeseler A, and Jermiin LS (2017). ModelFinder: fast model selection for accurate phylogenetic estimates. Nat. Methods 14, 587–589. [DOI] [PMC free article] [PubMed] [Google Scholar]
- 83.Mirarab S, Reaz R, Bayzid MS, Zimmermann T, Swenson MS, and Warnow T. (2014). ASTRAL: genome-scale coalescent-based species tree estimation. Bioinformatics 30, i541–8. [DOI] [PMC free article] [PubMed] [Google Scholar]
- 84.Letunic I, and Bork P. (2019). Interactive Tree Of Life (iTOL) v4: recent updates and new developments. Nucleic Acids Res. 47, W256–W259. [DOI] [PMC free article] [PubMed] [Google Scholar]
- 85.Salichos L, Stamatakis A, and Rokas A. (2014). Novel information theory-based measures for quantifying incongruence among phylogenetic trees. Mol. Biol. Evol 31, 1261–1271. [DOI] [PubMed] [Google Scholar]
- 86.Smith SA, Walker-Hale N, Walker JF, and Brown JW (2020). Phylogenetic conflicts, combinability, and deep phylogenomics in plants. Syst. Biol 69, 579–592. [DOI] [PubMed] [Google Scholar]
- 87.Kumar S, Stecher G, and Tamura K. (2016). MEGA7: Molecular Evolutionary Genetics Analysis Version 7.0 for Bigger Datasets. Mol. Biol. Evol 33, 1870–1874. [DOI] [PMC free article] [PubMed] [Google Scholar]
- 88.Team RC, Team MRC, Suggests M, and Matrix S. (2018). Package stats. The R Stats Package. [Google Scholar]
Associated Data
This section collects any data citations, data availability statements, or supplementary materials included in this article.
Supplementary Materials
(A) Taxonomy, strain ID, and source information of 1,104 Ascomycota genomes. (B) Taxonomy, strain ID, and source information of 540 fungal genomes that do not belong to Ascomycota. (C) Taxonomy, strain ID, and source information of Holozoa genomes used as outgroups.
(A) Gene statistics of 290 fungal BUSCO genes used in subsampled data matrices. (B) The Long-Branch score calculated for each taxon used for LB_taxa_removal (matrix #11). (C) Gene occupancy for each taxon across different phylogenomic matrices. (D) Annotation for 290 fungal BUSCO genes used in the study (Annotation details are provided from BUSCO).
(A) An examination of monophyletic lineages in phylum level. (B) An examination of monophyletic lineages in subphylum level. (C) An examination of monophyletic lineages in class level.
(A) Distribution of phylogenetic signal for the Spatafora2016 data matrix. (B) Distribution of phylogenetic signal for the Subset_Dikarya data matrix.
(A) RED values for each fungal taxon. (B) Relative divergence time for each fungal taxon.
Data Availability Statement
All genome assemblies were downloaded from NCBI and are publicly available in the Zenodo repository: https://doi.org/10.5281/zenodo.3970286. All scripts, data matrices, and phylogenetic trees are deposited at Figshare repository: https://doi.org/10.6084/m9.figshare.12751736.