Abstract
In cancer therapy, radioresistance or chemoresistance cells are major problems. We established clinically relevant radioresistant (CRR) cells that can survive over 30 days after 2 Gy/day X-ray exposures. These cells also show resistance to anticancer agents and hydrogen peroxide (H2O2). We have previously demonstrated that all the CRR cells examined had up-regulated miR-7-5p and after miR-7-5p knockdown, they lost radioresistance. However, the mechanism of losing radioresistance remains to be elucidated. Therefore, we investigated the role of miR-7-5p in radioresistance by knockdown of miR-7-5p using CRR cells. As a result, knockdown of miR-7-5p increased reactive oxygen species (ROS), mitochondrial membrane potential, and intracellular Fe2+ amount. Furthermore, miR-7-5p knockdown results in the down-regulation of the iron storage gene expression such as ferritin, up-regulation of the ferroptosis marker ALOX12 gene expression, and increases of Liperfluo amount. H2O2 treatment after ALOX12 overexpression led to the enhancement of intracellular H2O2 amount and lipid peroxidation. By contrast, miR-7-5p knockdown seemed not to be involved in COX-2 and glycolysis signaling but affected the morphology of CRR cells. These results indicate that miR-7-5p control radioresistance via ROS generation that leads to ferroptosis.
Keywords: microRNA, reactive oxygen species (ROS), clinically relevant radioresistant (CRR) cells, ferroptosis, Fe2+, ALOX12
1. Introduction
Reactive oxygen species (ROS) function as an important mediator in intracellular signal transduction pathways [1]. ROS are generated as a by-product of normal aerobic respiration and several other cellular enzymatic reactions. However, elevated and sustained ROS production or exposure causes oxidative stress, inducing cell death and initiating cancer [2]. ROS are also used for anticancer therapy because ROS can kill cells. In radiation and chemotherapy, such as bleomycin treatment, intracellular ROS levels are elevated and apoptosis is induced in cancer cells [3,4]. However, in radiation or chemotherapy, radioresistance or chemoresistance cells (resistant cells) that produce less ROS are obstacles to overcoming cancer. Many studies have been conducted to overcome the resistant cells. For example, the COX-2 reported to be controlled by mitochondrial ROS (mtROS) is involved in the resistance to radiotherapy and chemotherapy [5]. Additionally, COX-2 promotes apoptotic resistance via G1 phase delay, bcl2 induction, and caspase-3 suppression [6,7,8]. It has also been reported that the increased glycolysis results in chemoresistance and radioresistance [9,10]. Increased glycolysis inactivates the mitochondria, the organelle where ATP synthesis by oxidative phosphorylation and ROS production occurs. However, most studies were conducted with cell lines from different genomic backgrounds to understand the characteristics of the resistant cells [11,12,13,14]. Therefore, we have established clinically relevant radioresistant (CRR) cells that can survive over 30 days after 2 Gy/day X-ray exposures and have a similar genomic background [15,16,17].
CRR cells show resistance against irradiation and anticancer agents such as docetaxel. CRR cells also show resistance against ROS such as hydrogen peroxide (H2O2) [16,18]. CRR cells also have low lipid peroxidation, mitochondrial membrane potential (ΔΨm), mtDNA copy numbers, and ATP amount [16,18]. There is a strong relationship between mtROS and ΔΨm [19]. In fact, mtROS decreased in CRR cells [16]. Recently, it has been reported that miR-7-5p expression is up-regulated and miRNA-17-92 cluster was down-regulated in CRR cells [20,21]. Overexpression of miRNA-17-92 resulted in the loss of radioresistance in CRR cells. However, overexpression of miRNA-17-92 in the parental cells fails to affect cell survival following irradiation [21]. Conversely, down-regulation of miR-7-5p resulted in the loss of radioresistance in CRR cells and the overexpression of miR-7-5p resulted in radioresistance in CRR cells [20]. Additionally, the Fe2+ amount is decreased in CRR cells [20]. Intracellular Fe2+ reacts with H2O2 and produces hydroxyl radicals (•OH) by Fenton’s reaction and intracellular •OH peroxidize lipid in the plasma membrane [22]. Lipid peroxidation has been reported to lead to cell death, especially ferroptosis [23]. These results strongly suggest that the microRNAs and ROS are involved in chemoresistance and radioresistance.
However, the relationship between microRNA and ROS in CRR cells has not been elucidated yet. Therefore, in this study, we investigated the relationship between microRNA and ROS, focusing on miR-7-5p. We also investigated the ROS signaling pathways under the control of miR-7-5p and tried to show the mechanism of radioresistance that improves the therapeutic effect.
2. Results
2.1. Knockdown of miR-7-5p Increased ROS in CRR Cells
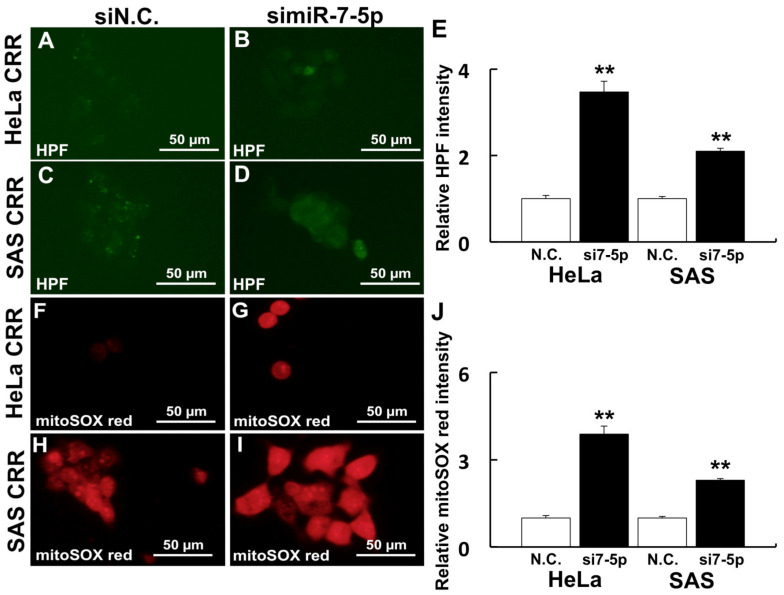
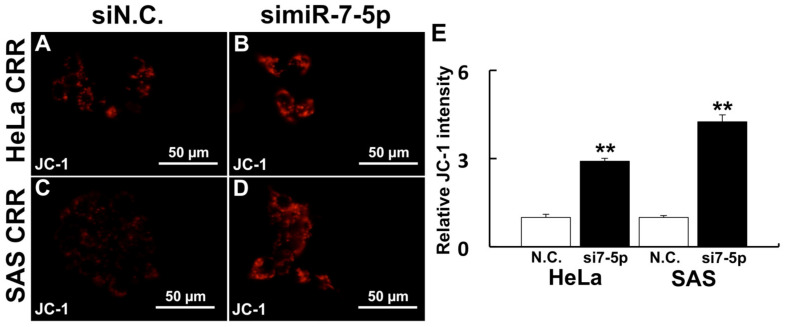
The knockdown of miR-7-5p by siRNA was conducted to investigate the relationship between miR-7-5p and ROS generation. After the knockdown of miR-7-5p in CRR cells, the intracellular •OH amount was increased (Figure 1A–D). Additionally, mitochondrial superoxide generation was also increased by miR-7-5p knockdown (Figure 1E–H). Moreover, ΔΨm was enhanced by miR-7-5p knockdown (Figure 2A–D). These results suggest that miR-7-5p control the ROS generation and change the intracellular organelle status such as mitochondria in CRR cells.
Figure 1.
Knockdown of miR-7-5p increased ROS in CRR cells. Cells were treated with 10 µM HPF and 5 µM mitoSOXTM red to detect •OH and mitochondrial superoxide (O2•−) after a miR-7-5p knockdown, respectively. HPF is a fluorescent probe, which detects hydroxyl radical in cells and mitoSOXTM red is a reagent that emits red fluorescence by reacting with mitochondrial superoxide. (A–E) Intracellular •OH visualized by HPF. (F–J) Mitochondrial O2•− visualized by mitoSOXTM red. (A,F) HeLa CRR cells siN.C. treatment. (B,G) HeLa CRR cells simiR-7-5p treatment. (C,H) SAS CRR cells siN.C. treatment. (D,I) SAS CRR cell simiR-7-5p treatment. (E) Relative HPF intensity (HeLa CRR N.C.: n = 60, HeLa CRR simiR-7-5p: n = 30, SAS CRR N.C.: n = 32, SAS CRR simiR-7-5p: n = 78). (J) Relative mitoSOXTM red intensity (HeLa CRR N.C.: n = 30, HeLa CRR simiR-7-5p: n = 11, SAS CRR N.C.: n = 77, SAS CRR simiR-7-5p: n = 31). **: p < 0.01 using Student’s t test. Knockdown of miR-7-5p significantly increased ROS.
Figure 2.
Knockdown of miR-7-5p enhanced ΔΨm. ΔΨm was visualized by 2 µM JC-1 after the miR-7-5p knockdown. JC-1 is a fluorescent probe that is localized mitochondria and is changed fluorescence according to the membrane potential. (A) HeLa CRR cells siN.C. treatment. (B) HeLa CRR cell simiR-7-5p treatment. (C) SAS CRR cells siN.C. treatment. (D) SAS CRR cell simiR-7-5p treatment. (E) Relative JC-1 intensity (HeLa CRR N.C.: n = 11, HeLa CRR simiR-7-5p: n = 10, SAS CRR N.C.: n = 51, SAS CRR simiR-7-5p: n = 25). **: p < 0.01 using Student’s t test. Knockdown of miR-7-5p significantly increased ΔΨm.
2.2. Knockdown of miR-7-5p Enhances Ferroptosis Signaling
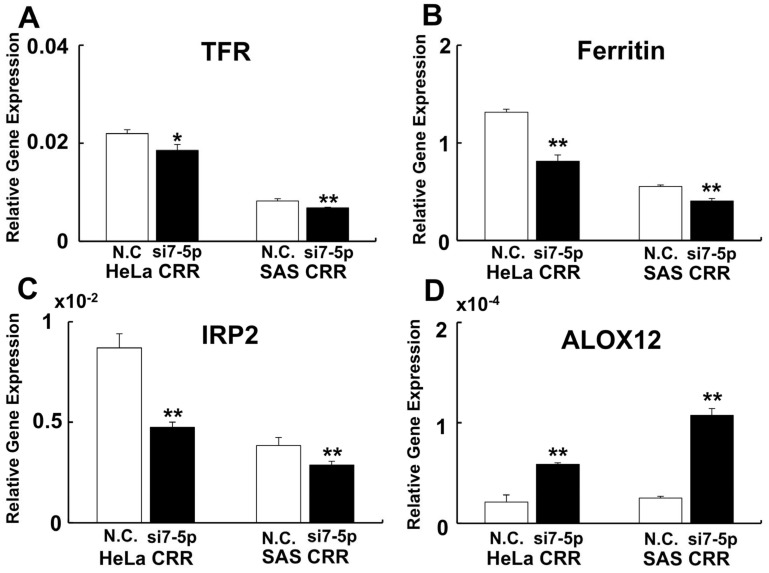
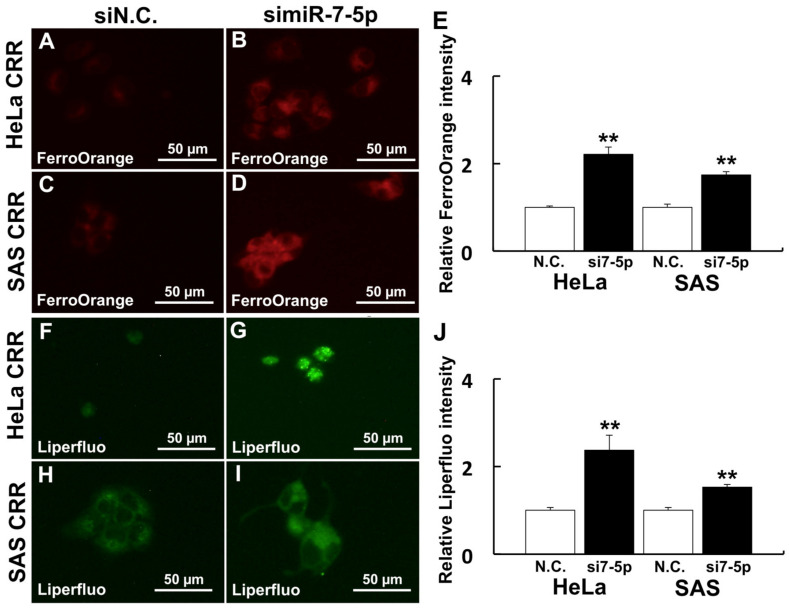
To investigate the relationship between miR-7-5p expression and cell death, especially ferroptosis, gene expressions of Fe2+-related genes (Transferrin receptor [TFR], ferritin, and iron responsive protein [IRP2]) and arachidonate 12-liopxygenase [ALOX12] were examined. As a result, gene expressions of TFR, ferritin, and IRP2 were down-regulated when miR-7-5p was knocked down (Figure 3A–C). By contrast, gene expression of ALOX12 was up-regulated when miR-7-5p was knocked down (Figure 3D). Additionally, the internal Fe2+ amount was detected if miR-7-5p controls the internal Fe2+ by FerroOrange. As a result, the internal Fe2+ amount was increased after miR-7-5p knockdown compared with N.C. (Figure 4A–D). We further analyzed the amount of Liperfluo, a marker of ferroptosis, to examine whether miR-7-5p is involved in ferroptosis after H2O2 treatment. Knockdown of miR-7-5p enhanced the Liperfluo signal after H2O2 treatment (Figure 4E–H). These results indicate that the knockdown of miR-7-5p enhances ferroptosis signaling that leads to cell death.
Figure 3.
Knockdown of miR-7-5p enhances ferroptosis signaling. To investigate whether ferroptosis signaling was enhanced by knockdown of miR-7-5p, ferroptosis–related gene expressions were performed by qPCR. (A) TFR. (B) Ferritin. (C) IRP2. (D) ALOX12. MiR-7-5p down-regulate iron-related gene expression and down-regulation of ferritin leads to an increase in intracellular free iron. The expression of ALOX12, which enhances ferroptosis, increased after the miR-7-5p knockdown. *: p < 0.05, **: p < 0.01 using Student’s t test. Each qPCR was performed 3 times.
Figure 4.
Knockdown of miR-7-5p enhances Fe2+ and ferroptosis marker. Cells were treated with 1 µM FerroOrange and 20 µM Liperfluo to detect intracellular Fe2+ and lipid peroxidation after a miR-7-5p knockdown. (A–E) Intracellular Fe2+ visualized by FerroOrange. (F–J) Ferroptosis marker visualized by Liperfluo. (A,F): HeLa CRR cells siN.C. treatment. (B,G) HeLa CRR cell simiR-7-5p treatment. (C,H) SAS CRR cells siN.C. treatment. (D,I) SAS CRR cells simiR-7-5p treatment. (E) Relative FerroOrange intensity (HeLa CRR N.C.: n = 41, HeLa CRR simiR-7-5p: n = 72, SAS CRR N.C.: n = 16, SAS CRR simiR-7-5p: n = 63). (J) Relative Liperfluo intensity (HeLa CRR N.C.: n = 17, HeLa CRR simiR-7-5p: n = 12, SAS CRR N.C.: n = 32, SAS CRR simiR-7-5p: n = 51). **: p < 0.01 using Student’s t-test. Knockdown of miR-7-5p significantly enhanced Fe2+ amount and Liperfluo signal.
2.3. ALOX12 Enhances Intracellular H2O2 and Lipid Peroxidation
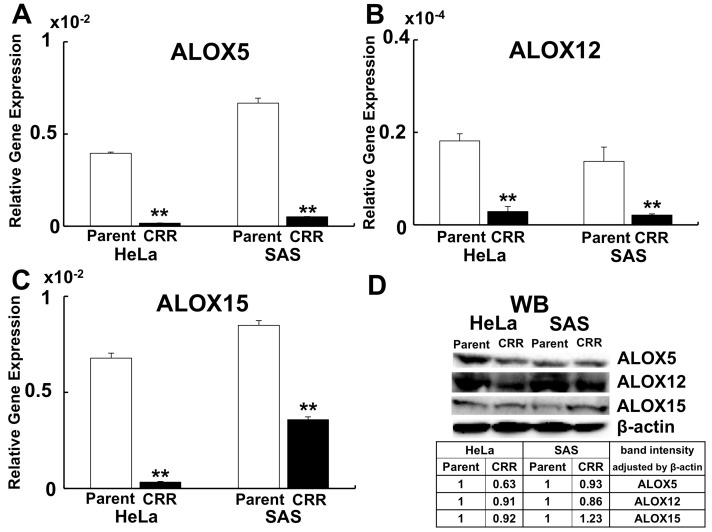
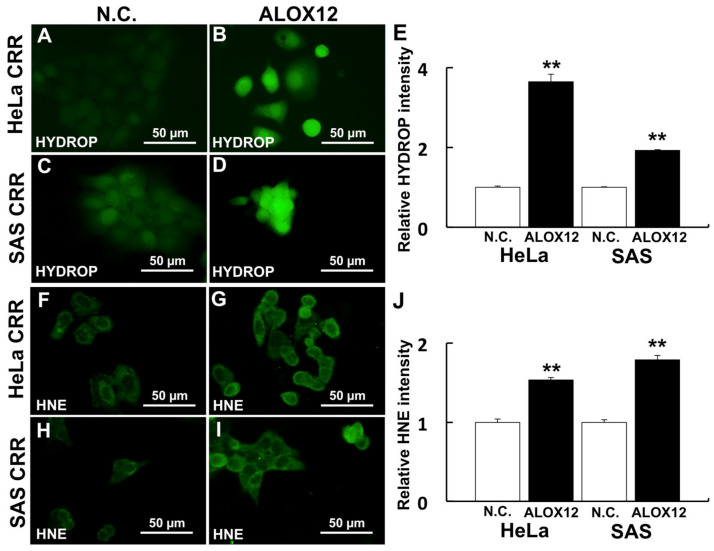
One of the ferroptosis markers, ALOX12, was up-regulated by miR-7-5p (Figure 3D). Conversely, ALOX12 was down-regulated both at gene expression and protein level (Figure 5A–D). The internal H2O2 amount and lipid peroxidation were detected using HYDROP and HNE antibody to investigate whether ALOX12 enhanced ROS generation and lipid peroxidation in CRR cells. HYDROP is a fluorescent probe that specifically detects intracellular H2O2 and HNE is the by-product of lipid peroxidation and accepted as an oxidative stress. As a result, the overexpression of ALOX12 enhanced both internal H2O2 amount and lipid peroxidation after H2O2 treatment (Figure 6A–H).
Figure 5.
Expression of ALOXs in CRR cells. ALOX5, 12, and 15 expressions in parent and CRR cells were detected using qPCR (A–C) and western blotting (D). A: Gene expression of ALOX5. (B) Gene expression of ALOX12. C: Gene expression of ALOX15. **: p < 0.01 using Student’s t-test. Each qPCR was performed 3 times. Gene expressions of ALOX5, 12, and 15 were all significantly down-regulated in CRR cells. (D) Western blotting of ALOX5, 12, and 15. The table shows the expression level of each ALOXs in CRR cells. After correcting the intensity of each band by the expression of β-actin, the value is shown with the parent strain as 1. The protein expressions of ALOX5 and 12 were down-regulated in CRR cells. However, ALOX15 was not down-regulated in protein level in SAS CRR cells.
Figure 6.
ALOX12 enhances intracellular ROS and lipid peroxidation. Cells were treated with 2.5 µM HYDROP after 50 µM H2O2 treatment for 2 h (A–D) to analyze the effect of ALOX12 on intracellular ROS generation. Lipid peroxidation was detected using an HNE antibody after 50 µM H2O2 treatment. (A–E) Intracellular H2O2 visualized by HYDROP (F–J) Lipid peroxidation visualized by HNE antibody. (A,F) HeLa CRR cells siN.C. treatment. (B,G) HeLa CRR cells with ALOX12 overexpression. (C,H) SAS CRR cells siN.C. treatment. (D,I) SAS CRR cells with ALOX12 overexpression. (E) Relative HYDROP intensity (HeLa CRR N.C.: n = 144, HeLa CRR simiR-7-5p: n = 45, SAS CRR N.C.: n = 122, SAS CRR simiR-7-5p: n = 152). (J) Relative HNE intensity (HeLa CRR N.C.: n = 58, HeLa CRR simiR-7-5p: n = 83, SAS CRR N.C.: n = 57, SAS CRR simiR-7-5p: n = 87). **: p < 0.01 using Student’s t-test. ALOX12 significantly enhances intracellular ROS and lipid peroxidation after H2O2 treatment.
2.4. MiR-7-5p Affected HIF-1α Expression but Not COX-2 and PFK Expression
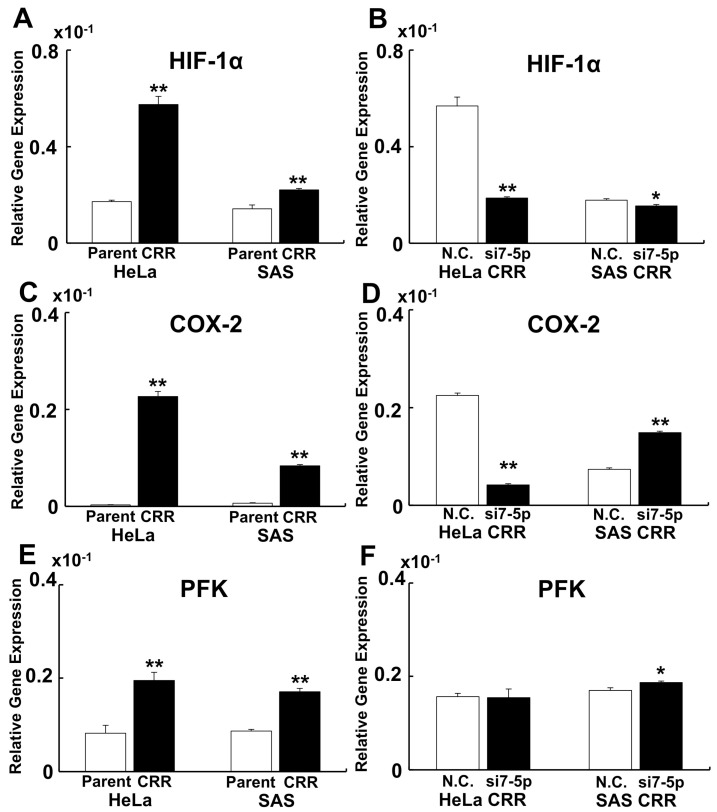
To reveal whether Hypoxia Inducible Factor-1α (HIF-1α), COX-2, and phosphofructokinase (PFK) are involved in the radioresistance and under control of miR-7-5p in CRR cells, qPCR was conducted. As a result, HIF-1α, COX-2, and PFK were significantly up-regulated in CRR cells (Figure 7A,C,E). Knockdown of miR-7-5p down-regulated HIF-1α (Figure 7B). However, miR-7-5p knockdown failed to control COX-2 and PFK gene expression (Figure 7D,F).
Figure 7.
MiR-7-5p affect HIF-1α expression but not COX-2 and PFK expression. To reveal whether HIF-1α, COX-2, and PFK are involved in the resistance to radiotherapy and under control of miR-7-5p in CRR cells, qPCR was conducted. (A,B) Gene expression of HIF-1α. (C,D) Gene expression of COX-2. (E,F) Gene expression of PFK. (A,C,E) Gene expression of parent vs. CRR cells. (B,D,F) Gene expression of N.C. vs. miR-7-5p knockdown. HIF-1α, COX-2, and PFK were significantly up-regulated in CRR cells. However, only HIF-1α gene expression was regulated by miR-7-5p. *: p < 0.05, **: p < 0.01 using Student’s t-test. Each qPCR was performed 3 times.
2.5. MiR-7-5p Knockdown Seems to Reverse the Morphology in CRR Cells
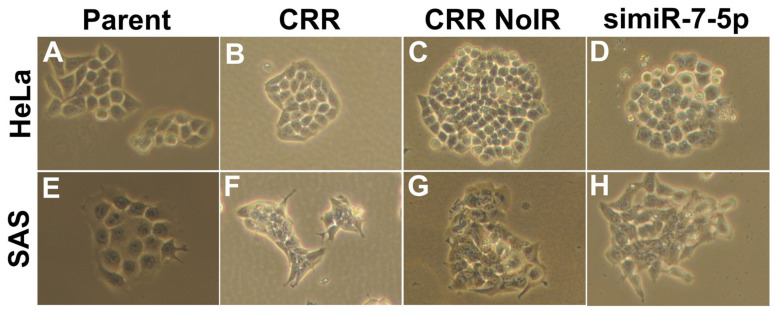
We finally investigated whether miR-7-5p affects CRR morphology. We observed parental cells, CRR cells, CRR nonirradiation (NoIR) cells, and miR-7-5p knocked down cells. NoIR cells were cultured without 2 Gy/day irradiation for over 1 year and lost radioresistance. In both HeLa and SAS CRR cells, the cell shape looks small and tightly aggregated compared with parental cells (Figure 8 A,B,E,F). In NoIR cells, which lost radioresistance, the shape is similar to that in CRR cells (Figure 8 C,G). On the other hand, when miR-7-5p is knocked down, the cell–cell connections appear to be loose; the shape is similar to that in parental cells (Figure 8 D,H). The magnification is 100×.
Figure 8.
Morphology of parent, CRR, NoIR, and simiR-7-5p cells. Morphology of the cells was observed under the optical microscope with 10× eyepieces and 10× objective lenses (magnification: 100×). (A) HeLa parental cells. (B) HeLa CRR cells. (C) HeLa CRR NoIR cells. (D) HeLa CRR cells that were knocked down by miR-7-5p. (E) SAS parental cells. (F) SAS CRR cells. (G) SAS CRR NoIR cells. (H) SAS CRR cells that were knocked down miR-7-5p. NoIR cells were cultured without 2 Gy/day irradiation for over 1 year and lost radioresistance. The cell shape of CRR cells looks small and tightly aggregated compared with that in parental cells. These characteristics are similar in NoIR cells, which lose radioresistance. Conversely, when miR-7-5p is knocked down, the cell–cell connections appear to loosen like the parental cells.
3. Discussion
This study shows that miR-7-5p knockdown increased ROS, ΔΨm, and ferroptosis–related signals such as Fe2+, ALOX12, and HIF1α in CRR cells. Furthermore, we also showed that miR-7-5p is involved in the maintenance of cell morphology in CRR cells.
In the previous study, miR-7-5p enhanced radioresistance in CRR cells and in parental cells [20]. Therefore, we believe that miR-7-5p is involved in radioresistance. Several studies reported that miR-7-5p is involved in cancer including chemoresistance [24,25,26]. Yang et al. showed that miR-7-5p promote cisplatin resistance [24]. Wang et al. showed that miR-7-5p inhibits migration and invasion of cancer cells and is involved in epithelial–mesenchymal transformation increasing E-cadherin expression [25]. Song et al. reported that miR-7-5p enhance autophagy via EGFR/AKT/mTOR signaling [26]. In CRR cells, it has been reported that the expression of the EGF receptor and phosphorylation of AKT decreased [20,27], and as reported by Song et al., the mTOR signaling was enhanced [28]. Conversely, it has been reported that the doxorubicin–resistant cell was down-regulated by the miR-7-5p expression [29]. Oxaliplatin resistance cell highly expresses KCNQ1OT1, directly regulated by miR-7-5p [30]. It has been reported that CRR cells that overexpress miR-7-5p did not show resistance to anticancer reagents such as 5-fluorouracil and etoposide [16]. These results suggest that miR-7-5p is considered a very important factor but is not a master control gene in radiation and drug resistance.
Our results show that miR-7-5p decreased ROS and ΔΨm. The main source of intracellular ROS is derived from mitochondria [31]. ΔΨm is generated by proton pumps in mitochondria [32]. These results indicate that the decrease in mitochondrial function occurs in CRR cells. Our previous study demonstrated that CRR cells have low mtDNA and produce less ATP [18]. Furthermore, up-regulation of PFK, a glycolysis enzyme, was observed in CRR cells. Low mitochondrial function, i.e., low oxidative phosphorylation, leads to low mtROS production. Low mtROS leads to a decreased intracellular ROS amount, reducing lipid peroxidation. Reduced lipid peroxidation will protect the cell death. Therefore, the mitochondrial condition may be one of the important factors in the resistance of CRR cells.
Recently, the concept of ferroptosis was proposed as a cell death [33,34,35]. Ferroptosis is a cell death via Fe2+, •OH, and lipid peroxidation and without caspase activation. Ferroptosis is now one of the effective candidates for cancer treatment because it is becoming clear that other cell deaths such as apoptosis are escaped in cancer cells [36]. A previous study showed that the Fe2+, •OH, and lipid peroxidation were decreased in CRR cells [18,20]. In this study, knockdown of miR-7-5p increased Fe2+, •OH, and lipid peroxidation in CRR cells. Among iron–related genes, ferritin expression was much higher than TFR and IRP2. The effect of ferritin was to decrease free iron in the cell. Therefore, the decrease in Fe2+ was observed in miR-7-5p knockdown cell. Ferrostatin-1, which is an inhibitor of ferroptosis, has been reported recently [37]. Ferrostatin-1 is thought to reduce ROS and inhibit ferroptosis. Further experiments using transfect with miR-7-5p and administration of Ferrostatin-1 would improve our hypothesis.
ALOX12, a lipid oxidase, oxidizes plasma membrane lipids and induces ferroptosis [38]. The administration of oxidized lipid resulted in the increase in cell death after H2O2 treatment [18]. In this study, the expression of ALOX12 was down-regulated in CRR cells and the expression of ALOX12 was up-regulated after miR-7-5p transfection. These results indicated that the ALOX12 is regulated by miR-7-5p. The overexpression of ALOX12 leads to the increase in internal H2O2 amount and lipid peroxidation in CRR cells. ALOX15 gene expression and protein expression were reversed in SAS CRR cell. Gene expression is a quantitative indicator of protein synthesis, but it may not actually correlate. It has been reported that this is due to the existence of a post-transcriptional regulatory mechanism [39]. Since ALOX15 is also subject to post-transcriptional regulation, there may be no correlation between gene expression and protein expression this time. Further investigation will be needed to clarify the relationship between miR-7-5p and ALOX15.
Cancer cells proliferate rapidly, so they cannot reach the bloodstream, resulting in malnutrition and hypoxia. Cancer cells avoid cell death because of malnutrition and hypoxia by enhancing HIF-1α expression [40]. It has been shown that up-regulation of HIF-1α enhances glycolysis and suppresses oxidative phosphorylation. When oxidative phosphorylation is suppressed, the generation of ROS is decreased, and cell death is suppressed. Furthermore, when HIF-1α enhanced the pentose phosphate pathway, the cells gained radioresistance [10,41]. In CRR cells, expression of HIF-1α was increased and miR-7-5p knockdown down-regulated HIF-1α expression. These results indicate that the expression of HIF-1α regulated by miR-7-5p is an important factor for radioresistance in CRR cells.
The COX-2 and glycolysis are involved in radioresistance [9,42]. Celecoxib, a selective COX-2 inhibitor, has been used to enhance radiosensitivity [43]. It has been shown that cancer cells use glycolysis, as we mentioned above. We show that COX-2 and PFK expressions were up-regulated in CRR cells but fail to down-regulate miR-7-5p knockdown. These results show that COX-2 and PFK are involved in radioresistance and will be a target for cancer therapy, but they are not regulated by miR-7-5p. We consider that there are other molecules that regulate radioresistance in addition to miR-7-5p. Further investigation will be needed to understand the relationship between COX-2 and PFK against radioresistance.
The morphology in CRR cells was tightly bound and small. This small cell does not change when maintenance irradiation (MI) is stopped (NoIR). The expression of miR-7-5p is down-regulated in NoIR cells [20]. However, the knockdown of miR-7-5p loosened the adhesion between cells. A similar phenomenon occurs with the expression of COX-2 and PFK. Why the cell adhesion state is different NoIR from simiR-7-5p is still unclear. One possibility is that miR-7-5p has different functions, acute and chronic. The acute effect of miR-7-5p knockdown may loosen the cell–cell junction by downregulating E-cadherin [25] and hypoxia state resolved, and consequently, radioresistance may disappear.
In cancer therapy, special treatment may be required in addition to the usual anticancer drugs or radiation therapy when resistant cells exist. Our results provide several candidates to improve cancer therapy. For example, when HIF-1α is enhanced, H2O2 is administered to the hypoxic part of the cancer tissue to supply oxygen or H2O2 like KORTUC [44], and activate ferroptosis, administrate iron [18], enhance glycolysis, remove glucose and administrate galactose [45]. However, further investigation will be needed to improve cancer therapy and overcome radio-resistant or chemo-resistant cells.
4. Materials and Methods
4.1. Cell Culture
The HeLa and SAS human cancer cell lines were obtained from the Cell Resource Center for Biomedical Research, Institute of Development, Aging and Cancer, Tohoku University, Sendai, Japan. HeLa and SAS CRR cells were established by exposing the cells to gradually increasing doses of X-rays (0.5–2 Gy) [17,46]. Cells were cultured in RPMI 1640 (Fujifilm Wako Pure Chemical Corporation, Osaka, Japan) with 10% FBS (Biological Industries, Cromwell, CT, USA) in a humidified atmosphere at 37 °C with 5% CO2. CRR cells were cultured in RPMI with 10% FBS without MI for over 1 year to obtain the CRR NoIR cells. All the experiments in this study were conducted using cells in the exponentially growing phase.
4.2. Inhibition of miR-7-5p by siRNA Transfection
mirVanaTM miRNA Inhibitor (Thermo Fisher Scientific, Waltham, MA, USA), was transfected into CRR cells using Lipofectamine® RNAiMAX Transfection Reagent (Thermo Fisher Scientific) according to the manufacturer’s protocol to inhibit the miR-7-5p expression. mirVanaTM miRNA Mimic Negative Control (Thermo Fisher Scientific) was used as a negative control.
4.3. Measurement of Intracellular ROS
Intracellular •OH were detected using HPF (hydroxyphenyl fluorescein; Goryo Chemical Inc., Sapporo, Japan) and mtROS were detected using MitoSOXTM (Thermo Fisher Scientific) as recommended by the manufacturer. Briefly, HeLa and SAS CRR cells were cultured overnight in glass bottom dishes (Matsunami Glass Ind., Ltd., Osaka, Japan). Then, the cells were washed twice using Hank’s balanced salt solution (HBSS) (Fujifilm Wako) to remove residual FBS. For •OH, cells were treated with 10 µM of HPF in HBSS for 15 min at 37 °C. For mtROS, cells were treated with 5 µM of MitoSOXTM in HBSS for 10 min at 37 °C. After these treatments, cells were washed with HBSS three times and fluorescence images were obtained using a BZ-8000 fluorescence microscope (KEYENCE Corporation, Osaka, Japan) from 3 separate dishes for each treatment.
4.4. Measurement of ΔΨm
ΔΨm was detected using 5,5′,6,6′ tetrachloro 1,1′,3,3′ tetraethylbenzimidazolylcarbocyanine iodide (JC-1: Thermo Fisher Scientific). Cells in the glass bottom dish were treated with 2 µM of JC-1 in RPMI 1640 for 30 min at 37 °C. After these treatments, cells were washed with HBSS three times and fluorescence images were obtained using a BZ-8000 fluorescence microscope from 3 separate dishes for each treatment.
4.5. Quantitative PCR (qPCR)
The qPCR was conducted as described previously [47] with slight modification. Total RNA from the cells was extracted using ISOGEN (Nippon Gene Toyama, Japan). After the reverse transcription by ReverTra Ace (TOYOBO CO Ltd., Osaka, Japan), cDNA equivalent to 1 ng total RNA was used for qPCR. The qPCR reactions were conducted by an Applied Biosystems 7300 instrument (Applied Biosystems, Foster City, CA, USA) using THUNDERBIRD® qPCR Mix (TOYOBO). β-actin was used as the loading control. PCR amplification was conducted as follows: one cycle at 95 °C for 10 min, followed by 40 cycles of 95 °C for 10 s and 60 °C for 60 s. Each experiment was conducted 3 times independently. Table 1 shows the primer sequences used in this experiment.
Table 1.
Primer sequence used in this study.
| Primer Name | Primer Sequence |
|---|---|
| TFR F | 5′-ACACGCTGCCAGCTTTACTGGAGAACTT-3′ |
| TFR R | 5′-AGAGGGCATTTGCAGCTCCCTGAATA-3′ |
| Ferritin F | 5’-TCTCCTGAAGATGCAAAACCAGCGTG-3’ |
| Ferritin R | 5’-CAGCTTTCATGGCGTCTGGGGTTTTA-3’ |
| IRP2 F | 5′-GACAAGCACTGGAAAAGTATTCAGCGTGAT-3′ |
| IRP2 R | 5′-TCGTGCCACAAAGTTTAATAATCCTCCATG-3′ |
| ALOX12 F | 5’-TTCAAATGGCCATCTCATGGCATCTGAGT-3’ |
| ALOX12 R | 5’-ATCTGTTCGGAATTGGTTTAGCACAGCTTT-3’ |
| ALOX5 F | 5′-CTGGGCATGTACCCAGAAGAGCATTTTAT-3′ |
| ALOX5 R | 5′-ACAAGTAGTAATATGGCAGCTGCTTCTTCT-3′ |
| ALOX15 F | 5′-ATCTATCGGTATGTGGAAGGAATCGTGAGT-3′ |
| ALOX15 R | 5′-TAAAGAGACAGGAAACCCTCGGTCCT-3′ |
| HIF-1α F | 5′-AATACCCTCTGATTTAGCATGTAGACTGCT-3′ |
| HIF-1α R | 5′-TCTGAGTAATTCTTCACCCTGCAGTAGGT-3′ |
| COX-2 F | 5′-TGGAGCACCATTCTCCTTGAAAGGACTTAT-3′ |
| COX-2 R | 5′-GACTGTTTTAATGAGCTCTGGATCTGGAAC-3′ |
| PFK F | 5′-TGGAGCACATGACGGAGAAGATGAAGAC-3′ |
| PFK R | 5′-AGTCGAAGACGCCCTTGCCCTCT-3′ |
| β-actin F | 5′-AGAGCTACGAGCTGCCTGAC-3′ |
| β-actin R | 5′-AGCACTGTGTTGGCGTACAG-3′ |
4.6. Measurement of Intracellular Fe2+ Amount
FerroOrange (Goryo Chemical Inc.) was used to detect intracellular Fe2+ as described previously [48]. In the glass bottom dish, cells were treated with 1 μM FerroOrange in HBSS for 30 min at 37 °C. After incubation, FerroOrange was removed by washing three times with HBSS. Fluorescence images were obtained using a BZ-8000 fluorescence microscope from 3 separate dishes for each treatment.
4.7. Ferroptosis Detection by Liperfluo after H2O2 Treatment
Lipid peroxidation after H2O2 treatment was detected via Liperfluo (Dojindo), the ferroptosis marker. Cells in the glass bottom dish were treated with 50 µM of H2O2 in RPMI 1640 for 2 h at 37 °C. After removing H2O2, cells were washed with HBSS three times. Cells were then treated with 10 µM of Liperfluo in HBSS for 30 min at 37 °C. After removing Liperfluo, cells were washed with HBSS three times, and fluorescence images were obtained using a BZ-8000 fluorescence microscope from 3 separate dishes for each treatment.
4.8. Western Blotting
Western blotting was conducted as described previously [49]. Briefly, cells were extracted in lysis buffer (50 mM Tris-HCl [pH 7.5], 150 mM sodium chloride, 1% Nonidet P-40, 0.1% sodium deoxycholate, 1 mM sodium fluoride, 1 mM sodium vanadate, and 1 mM PMSF). Each cell lysate (30 µg per lane) was subject to SDS-PAGE under reduced condition using 15% polyacrylamide gel. Proteins were subsequently blotted on a PVDF membrane. After blocking with buffer (3% skim milk in TBS-T; TBS with 0.05% Tween 20, for ALOX12 antibody and 5% skim milk in PBS-T for the other primary antibodies), the blotted membranes were incubated with primary antibodies (rabbit anti-ALOX5, -ALOX12, -ALOX15: Abcam, Cambridge, UK; ab169755, ab211506, ab80221, dilution factor: 1:1000) at 4 °C overnight. After five washes with TBS-T (ALOX12 antibody) or PBS-T (other antibodies), the membranes were incubated with peroxidase-conjugated anti-rabbit IgG antibody (#7074; Cell Signaling Technology, Danvers, MA, USA) at room temperature for 2 h. Immunoreactive proteins were visualized with ECL prime (GE Healthcare) using ChemiDocTM XRS Plus (BIO-RAD Laboratories, Inc., Hercules, CA, USA). Anti-β–actin antibody (NB100-56874; Novus Biologicals LLC, Centennial, CO, USA, dilution factor: 1:1000) was used as a loading control.
4.9. Overexpression of ALOX12 and Detection of Internal H2O2 and HNE
For ALOX12 overexpression, full-length ALOX12 in pCDNA3 vector (a kind gift from Dr. Torii, Gunma University, Gunma) was used. The plasmid was purified using QIAGEN Plasmid Midi Kit (QIAGEN GmbH, Hilden, Germany). Transfection was conducted using Lipofectamine® 2000 as recommended by the manufacturer (1.6 µg DNA was transfected per 1 mL medium). Internal H2O2 and HNE, plasma membrane lipid peroxidation, were detected via 2.5 µM HYDROP (Goryo Chemical Inc.) and mouse anti-HNE antibody (Japan Institute for the control of aging, Shizuoka, Japan; 1:200 dilution) as described previously [18]. Fluorescence images were obtained from 3 separate dishes for each treatment.
4.10. Statistical Analysis
All the statistical analyses were conducted using Student’s t-test. p < 0.05 was considered statistically significant. The results are expressed as means ± standard error.
5. Conclusions
We showed that miR-7-5p knockdown enhanced ROS amount in CRR cells. Knockdown of miR-7-5p also facilitated ferroptosis signaling such as ALOX12 expression. Furthermore, overexpression of ALOX12 enhances intracellular H2O2 amount and lipid peroxidation. We also demonstrated the relationship between miR-7-5p and HIF-1α, COX-2, PFK, and morphology of the cell. Our results suggest the novel therapeutic strategy to be able to overcome radioresistance decreasing ROS generation by controlling microRNA that regulates ferroptosis.
Author Contributions
Conceptualization, K.T., T.S.; methodology, K.T., T.N. and K.I.; formal analysis, K.T., Y.K., M.H.R., A.M.R. and A.K.; investigation, K.T., T.N. and Y.K.; resources, S.T.; data curation, K.T., A.K.; writing—original draft preparation, K.T., T.N., T.S.; writing—review and editing, Y.K., S.T., K.I., M.H.R., A.M.R. and A.K.; visualization, K.T.; supervision, T.S.; project administration, K.T., T.S.; funding acquisition, K.T. All authors have read and agreed to the published version of the manuscript.
Funding
This research was funded by JSPS KAKENHI, grant number 19K10318.
Institutional Review Board Statement
Not applicable.
Informed Consent Statement
Not applicable.
Data Availability Statement
The data presented in this study are available on request from the corresponding author. The data are not publicly available since they are raw data.
Conflicts of Interest
The authors declare no conflict of interest. The funders had no role in the design of the study; in the collection, analyses, or interpretation of data; in the writing of the manuscript, or in the decision to publish the results.
Footnotes
Publisher’s Note: MDPI stays neutral with regard to jurisdictional claims in published maps and institutional affiliations.
References
- 1.Finkel T. Signal transduction by reactive oxygen species. J. Cell Biol. 2011;194:7–15. doi: 10.1083/jcb.201102095. [DOI] [PMC free article] [PubMed] [Google Scholar]
- 2.Liou G.Y., Storz P. Reactive oxygen species in cancer. Free Radic. Res. 2010;44:479–496. doi: 10.3109/10715761003667554. [DOI] [PMC free article] [PubMed] [Google Scholar]
- 3.Kim W., Lee S., Seo D., Kim D., Kim K., Kim E., Kang J., Seong K.M., Youn H., Youn B. Cellular stress responses in radiotherapy. Cells. 2019;8:1105. doi: 10.3390/cells8091105. [DOI] [PMC free article] [PubMed] [Google Scholar]
- 4.Allawzi A., Elajaili H., Redente E.F., Nozik-Grayck E. Oxidative toxicology of bleomycin: Role of the extracellular redox environment. Curr. Opin. Toxicol. 2019;13:68–73. doi: 10.1016/j.cotox.2018.08.001. [DOI] [PMC free article] [PubMed] [Google Scholar]
- 5.Goradel N.H., Najafi M., Salehi E., Farhood B., Mortezaee K. Cyclooxygenase-2 in cancer: A review. J. Cell. Physiol. 2019;234:5683–5699. doi: 10.1002/jcp.27411. [DOI] [PubMed] [Google Scholar]
- 6.Gungor H., Ilhan N., Eroksuz H. The effectiveness of cyclooxygenase-2 inhibitors and evaluation of angiogenesis in the model of experimental colorectal cancer. Biomed. Pharmacother. 2018;102:221–229. doi: 10.1016/j.biopha.2018.03.066. [DOI] [PubMed] [Google Scholar]
- 7.Hosseini F., Mahdian-Shakib A., Jadidi-Niaragh F., Enderami S.E., Mohammadi H., Hemmatzadeh M., Mohammed H.A., Anissian A., Kokhaei P., Mirshafiey A., et al. Anti-inflammatory and anti-tumor effects of α-l-guluronic acid (G2013) on cancer-related inflammation in a murine breast cancer model. Biomed. Pharmacother. 2018;98:793–800. doi: 10.1016/j.biopha.2017.12.111. [DOI] [PubMed] [Google Scholar]
- 8.Janakiraman H., House R.P., Talwar S., Courtney S.M., Hazard E.S., Hardiman G., Mehrotra S., Howe P.H., Gangaraju V., Palanisamy V. Repression of caspase-3 and RNA-binding protein HuR cleavage by cyclooxygenase-2 promotes drug resistance in oral squamous cell carcinoma. Oncogene. 2017;36:3137–3148. doi: 10.1038/onc.2016.451. [DOI] [PMC free article] [PubMed] [Google Scholar]
- 9.Rashmi R., Huang X., Floberg J.M., Elhammali A.E., McCormick M.L., Patti G.J., Spitz D.R., Schwarz J.K. Radioresistant cervical cancers are sensitive to inhibition of glycolysis and redox metabolism. Cancer Res. 2018;78:1392–1403. doi: 10.1158/0008-5472.CAN-17-2367. [DOI] [PMC free article] [PubMed] [Google Scholar]
- 10.Nagao A., Kobayashi M., Koyasu S., Chow C.C.T., Harada H. HIF-1-dependent reprogramming of glucose metabolic pathway of cancer cells and its therapeutic significance. Int. J. Mol. Sci. 2019;20:238. doi: 10.3390/ijms20020238. [DOI] [PMC free article] [PubMed] [Google Scholar]
- 11.Howley H.E.A., Raaphorst G.P. Comparison of repair and rejoining fidelity between two isogenic human ovarian carcinoma cell lines. Int. J. Radiat. Biol. 2002;78:1095–1102. doi: 10.1080/0955300021000020111. [DOI] [PubMed] [Google Scholar]
- 12.De Llobet L.I., Baro M., Figueras A., Modolell I., Da Silva M.V., Muñoz P., Navarro A., Mesia R., Balart J. Development and characterization of an isogenic cell line with a radioresistant phenotype. Clin. Transl. Oncol. 2012;15:189–197. doi: 10.1007/s12094-012-0898-8. [DOI] [PubMed] [Google Scholar]
- 13.Kim B.M., Hong Y., Lee S., Liu P., Lim J.H., Lee Y.H., Lee T.H., Chang K.T., Hong Y. Therapeutic implications for overcoming radiation resistance in cancer therapy. Int. J. Mol. Sci. 2015;16:26880–26913. doi: 10.3390/ijms161125991. [DOI] [PMC free article] [PubMed] [Google Scholar]
- 14.Todorovic V., Prevc A., Zakelj M.N., Savarin M., Brozic A., Groselj B., Strojan P., Cemazar M., Sersa G. Mechanisms of different response to ionizing irradiation in isogenic head and neck cancer cell lines. Radiat. Oncol. 2019;14:1–20. doi: 10.1186/s13014-019-1418-6. [DOI] [PMC free article] [PubMed] [Google Scholar]
- 15.Kuwahara Y., Mori M., Oikawa T., Shimura T., Ohtake Y., Mori S., Ohkubo Y., Fukumoto M. The modified high-density survival assay is the useful tool to predict the effectiveness of fractionated radiation exposure. J. Radiat. Res. 2010;51:297–302. doi: 10.1269/jrr.09094. [DOI] [PubMed] [Google Scholar]
- 16.Kuwahara Y., Roudkenar M.H., Suzuki M., Urushihara Y., Fukumoto M., Saito Y., Fukumoto M. The involvement of mitochondrial membrane potential in cross-resistance between radiation and docetaxel. Int. J. Radiat. Oncol. 2016;96:556–565. doi: 10.1016/j.ijrobp.2016.07.002. [DOI] [PubMed] [Google Scholar]
- 17.Kuwahara Y., Roudkenar M.H., Urushihara Y., Saito Y., Tomita K., Roushandeh A.M., Sato T., Kurimasa A., Fukumoto M. Clinically relevant radioresistant cell line: A simple model to understand cancer radioresistance. Med. Mol. Morphol. 2017;50:195–204. doi: 10.1007/s00795-017-0171-x. [DOI] [PubMed] [Google Scholar]
- 18.Tomita K., Kuwahara Y., Takashi Y., Igarashi K., Nagasawa T., Nabika H., Kurimasa A., Fukumoto M., Nishitani Y., Sato T. Clinically relevant radioresistant cells exhibit resistance to H2O2 by decreasing internal H2O2 and lipid peroxidation. Tumor Biol. 2018;40 doi: 10.1177/1010428318799250. [DOI] [PubMed] [Google Scholar]
- 19.Suski J.M., Lebiedzińska-Arciszewska M., Bonora M., Pinton P., Duszynski J., Wieckowski M.R. Relation between mitochondrial membrane potential and ROS formation. Methods Mol. Biol. 2011;810:183–205. doi: 10.1007/978-1-61779-382-0_12. [DOI] [PubMed] [Google Scholar]
- 20.Tomita K., Fukumoto M., Itoh K., Kuwahara Y., Igarashi K., Nagasawa T., Suzuki M., Kurimasa A., Sato T. MiR-7-5p is a key factor that controls radioresistance via intracellular Fe2+ content in clinically relevant radioresistant cells. Biochem. Biophys. Res. Commun. 2019;518:712–718. doi: 10.1016/j.bbrc.2019.08.117. [DOI] [PubMed] [Google Scholar]
- 21.Roudkenar M.H., Fukumoto M., Roushandeh A.M., Kuwahra Y., Uroshihara Y., Harada H., Fukumoto M. Disturbance in the regulation of miR 17-92 cluster on HIF-1-α expression contributes to clinically relevant radioresistant cells: An in vitro study. Cytotechnology. 2020;72:141–153. doi: 10.1007/s10616-019-00364-9. [DOI] [PMC free article] [PubMed] [Google Scholar]
- 22.Braughler J.M.A., Duncan L., Chase R.L. The involvement of iron in lipid peroxidation. Importance of ferric to ferrous ratios in initiation. J. Biol. Chem. 1986;261:10282–10289. doi: 10.1016/S0021-9258(18)67521-0. [DOI] [PubMed] [Google Scholar]
- 23.Yang W.S., Stockwell B.R. Ferroptosis: Death by lipid peroxidation. Trends Cell Biol. 2016;26:165–176. doi: 10.1016/j.tcb.2015.10.014. [DOI] [PMC free article] [PubMed] [Google Scholar]
- 24.Yang F., Guo L., Cao Y., Li S., Li J., Liu M. MicroRNA-7-5p promotes cisplatin resistance of cervical cancer cells and modulation of cellular energy homeostasis by regulating the expression of the PARP-1 and BCL2 genes. Med. Sci. Monit. 2018;24:6506–6516. doi: 10.12659/MSM.910969. [DOI] [PMC free article] [PubMed] [Google Scholar]
- 25.Wang H., Dong Z., Yan L., Yang S., Xu H., Chen S., Wang W., Yang Q., Chen C. The N-terminal polypeptide derived from vMIP-II exerts its antitumor activity in human breast cancer through CXCR4/miR-7-5p/Skp2 pathway. J. Cell. Physiol. 2020;235:9474–9486. doi: 10.1002/jcp.29755. [DOI] [PubMed] [Google Scholar]
- 26.Song M., Wang Y., Shang Z.-F., Liu X.-D., Xie D.-F., Wang Q., Guan H., Zhou P.-K. Bystander autophagy mediated by radiation-induced exosomal miR-7-5p in non-targeted human bronchial epithelial cells. Sci. Rep. 2016;6:30165. doi: 10.1038/srep30165. [DOI] [PMC free article] [PubMed] [Google Scholar]
- 27.Saito Y., Abiko R., Kishida A., Kuwahara Y., Yamamoto Y., Yamamoto F., Fukumoto M., Ohkubo Y. Loss of EGF-dependent cell proliferation ability on radioresistant cell HepG2-8960-R. Cell Biochem. Funct. 2015;33:73–79. doi: 10.1002/cbf.3090. [DOI] [PubMed] [Google Scholar]
- 28.Kuwahara Y., Mori M., Kitahara S., Fukumoto M., Ezaki T., Mori S., Echigo S., Ohkubo Y., Fukumoto M. Targeting of tumor endothelial cells combining 2 Gy/day of X-ray with Everolimus is the effective modality for overcoming clinically relevant radioresistant tumors. Cancer Med. 2014;3:310–321. doi: 10.1002/cam4.185. [DOI] [PMC free article] [PubMed] [Google Scholar]
- 29.Lai J., Yang H., Zhu Y., Ruan M., Huang Y., Zhang Q. MiR-7-5p-mediated downregulation of PARP1 impacts DNA homologous recombination repair and resistance to doxorubicin in small cell lung cancer. BMC Cancer. 2019;19:1–9. doi: 10.1186/s12885-019-5798-7. [DOI] [PMC free article] [PubMed] [Google Scholar]
- 30.Hu H., Yang L., Li L., Zeng C. Long non-coding RNA KCNQ1OT1 modulates oxaliplatin resistance in hepatocellular carcinoma through miR-7-5p/ABCC1 axis. Biochem. Biophys. Res. Commun. 2018;503:2400–2406. doi: 10.1016/j.bbrc.2018.06.168. [DOI] [PubMed] [Google Scholar]
- 31.Indo H.P., Davidson M., Yen H.-C., Suenaga S., Tomita K., Nishii T., Higuchi M., Koga Y., Ozawa T., Majima H.J. Evidence of ROS generation by mitochondria in cells with impaired electron transport chain and mitochondrial DNA damage. Mitochondrion. 2007;7:106–118. doi: 10.1016/j.mito.2006.11.026. [DOI] [PubMed] [Google Scholar]
- 32.Zhang W., Hu X., Shen Q., Xing D. Mitochondria-specific drug release and reactive oxygen species burst induced by polyprodrug nanoreactors can enhance chemotherapy. Nat. Commun. 2019;10:1–14. doi: 10.1038/s41467-019-09566-3. [DOI] [PMC free article] [PubMed] [Google Scholar]
- 33.Stockwell B.R., Angeli J.P.F., Bayir H., Bush A., Conrad M., Dixon S.J., Fulda S., Gascón S., Hatzios S., Kagan V.E., et al. Ferroptosis: A regulated cell death nexus linking metabolism, redox biology, and disease. Cell. 2017;171:273–285. doi: 10.1016/j.cell.2017.09.021. [DOI] [PMC free article] [PubMed] [Google Scholar]
- 34.Jiang L., Kon N., Li T., Wang S.-J., Su T., Hibshoosh H., Baer R., Gu W. Ferroptosis as a p53-mediated activity during tumour suppression. Nat. Cell Biol. 2015;520:57–62. doi: 10.1038/nature14344. [DOI] [PMC free article] [PubMed] [Google Scholar]
- 35.Dixon S.J., Lemberg K.M., Lamprecht M.R., Skouta R., Zaitsev E.M., Gleason C.E., Patel D.N., Bauer A.J., Cantley A.M., Yang W.S., et al. Ferroptosis: An iron-dependent form of nonapoptotic cell death. Cell. 2012;149:1060–1072. doi: 10.1016/j.cell.2012.03.042. [DOI] [PMC free article] [PubMed] [Google Scholar]
- 36.Bebber C.M., Müller F., Prieto Clemente L., Weber J., Von Karstedt S. Ferroptosis in cancer cell biology. Cancers. 2020;12:164. doi: 10.3390/cancers12010164. [DOI] [PMC free article] [PubMed] [Google Scholar]
- 37.Sagasser J., Ma B., Baecker D., Salcher S., Hermann M., Lamprecht J., Angerer S., Obexer P., Kircher B., Gust R. A new approach in cancer treatment: Discovery of chlorido[N,N′-disalicylidene-1,2-phenylenediamine]iron(III) complexes as ferroptosis inducers. J. Med. Chem. 2019;62:8053–8061. doi: 10.1021/acs.jmedchem.9b00814. [DOI] [PubMed] [Google Scholar]
- 38.Chu B., Kon N., Chen D., Li T., Liu T., Jiang L., Song S., Tavana O., Gu W. ALOX12 is required for p53-mediated tumour suppression through a distinct ferroptosis pathway. Nat. Cell Biol. 2019;21:579–591. doi: 10.1038/s41556-019-0305-6. [DOI] [PMC free article] [PubMed] [Google Scholar]
- 39.Ingolia N.T., Ghaemmaghami S., Newman J.R.S., Weissman J.S. Genome-wide analysis in vivo of translation with nucleotide resolution using ribosome profiling. Science. 2009;324:218–223. doi: 10.1126/science.1168978. [DOI] [PMC free article] [PubMed] [Google Scholar]
- 40.Semenza G.L. Targeting HIF-1 for cancer therapy. Nat. Rev. Cancer. 2003;3:721–732. doi: 10.1038/nrc1187. [DOI] [PubMed] [Google Scholar]
- 41.Gray L.H., Conger A.D., Ebert M., Hornsey S., Scott O.C.A. The concentration of oxygen dissolved in tissues at the time of irradiation as a factor in radiotherapy. Br. J. Radiol. 1953;26:638–648. doi: 10.1259/0007-1285-26-312-638. [DOI] [PubMed] [Google Scholar]
- 42.Xia S., Zhao Y., Yu S., Zhang M. Activated PI3K/Akt/COX-2 pathway induces resistance to radiation in human cervical cancer HeLa cells. Cancer Biother. Radiopharm. 2010;25:317–323. doi: 10.1089/cbr.2009.0707. [DOI] [PubMed] [Google Scholar]
- 43.Yang M.-Y., Lee H.-T., Chen C.-M., Shen C.-C., Ma H.-I. Celecoxib suppresses the phosphorylation of STAT3 protein and can enhance the radiosensitivity of medulloblastoma-derived cancer stem-like cells. Int. J. Mol. Sci. 2014;15:11013–11029. doi: 10.3390/ijms150611013. [DOI] [PMC free article] [PubMed] [Google Scholar]
- 44.Ogawa Y., Ue H., Tsuzuki K., Tadokoro M., Miyatake K., Sasaki T., Yokota N., Hamada N., Kariya S., Hitomi J., et al. New radiosensitization treatment (KORTUC I) using hydrogen peroxide solution-soaked gauze bolus for unresectable and superficially exposed neoplasms. Oncol. Rep. 2008;19:1389–1394. doi: 10.3892/or.19.6.1389. [DOI] [PubMed] [Google Scholar]
- 45.Raut G.K., Chakrabarti M., Pamarthy D., Bhadra M.P. Glucose starvation-induced oxidative stress causes mitochondrial dysfunction and apoptosis via Prohibitin 1 upregulation in human breast cancer cells. Free. Radic. Biol. Med. 2019;145:428–441. doi: 10.1016/j.freeradbiomed.2019.09.020. [DOI] [PubMed] [Google Scholar]
- 46.Kuwahara Y., Li L., Baba T., Nakagawa H., Shimura T., Yamamoto Y., Ohkubo Y., Fukumoto M. Clinically relevant radioresistant cells efficiently repair DNA double-strand breaks induced by X-rays. Cancer Sci. 2009;100:747–752. doi: 10.1111/j.1349-7006.2009.01082.x. [DOI] [PMC free article] [PubMed] [Google Scholar]
- 47.Tomita K., Kuwahara Y., Takashi Y., Tsukahara T., Kurimasa A., Fukumoto M., Nishitani Y., Sato T. Sensitivity of mitochondrial DNA depleted ρ0 cells to H2O2 depends on the plasma membrane status. Biochem. Biophys. Res. Commun. 2017;490:330–335. doi: 10.1016/j.bbrc.2017.06.044. [DOI] [PubMed] [Google Scholar]
- 48.Takashi Y., Tomita K., Kuwahara Y., Roudkenar M.H., Roushandeh A.M., Igarashi K., Nagasawa T., Nishitani Y., Sato T. Mitochondrial dysfunction promotes aquaporin expression that controls hydrogen peroxide permeability and ferroptosis. Free Radic. Biol. Med. 2020;161:60–70. doi: 10.1016/j.freeradbiomed.2020.09.027. [DOI] [PMC free article] [PubMed] [Google Scholar]
- 49.Tomita K., Takashi Y., Ouchi Y., Kuwahara Y., Igarashi K., Nagasawa T., Nabika H., Kurimasa A., Fukumoto M., Nishitani Y., et al. Lipid peroxidation increases hydrogen peroxide permeability leading to cell death in cancer cell lines that lack mtDNA. Cancer Sci. 2019;110:2856–2866. doi: 10.1111/cas.14132. [DOI] [PMC free article] [PubMed] [Google Scholar]
Associated Data
This section collects any data citations, data availability statements, or supplementary materials included in this article.
Data Availability Statement
The data presented in this study are available on request from the corresponding author. The data are not publicly available since they are raw data.


